Estimated zip code population in 2022: 3,477 Zip code population in 2010: 4,180 Zip code population in 2000: 4,085
Houses and condos: 1,770 Renter-occupied apartments: 408
% of renters here:
36%
State:
38%
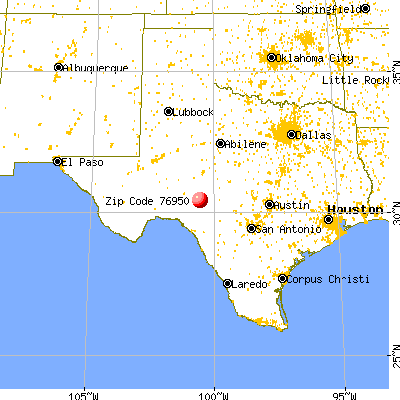
March 2022 cost of living index in zip code 76950: 76.8 (low, U.S. average is 100)
Land area: 1839.9 sq. mi. Water area: 0.9 sq. mi.
Population density: 2 people per square mile
(very low).
OSM Map
General Map
Google Map
MSN Map
OSM Map
General Map
Google Map
MSN Map
OSM Map
General Map
Google Map
MSN Map
OSM Map
General Map
Google Map
MSN Map
Please wait while loading the map...
Real estate property taxes paid for housing units in 2022:
This zip code:
1.3% ($1,990)
Texas:
1.5% ($4,050)
Median real estate property taxes paid for housing units with mortgages in 2022: $2,778 (1.3%) Median real estate property taxes paid for housing units with no mortgage in 2022: $1,428 (1.3%)
Business Search- 14 Million verified businesses
Males: 1,724
(49.6%)
Females: 1,752
(50.4%)
For population 25 years and over in 76950:
High school or higher: 79.9%
Bachelor's degree or higher: 16.9%
Graduate or professional degree: 7.7%
Unemployed: 3.9%
Mean travel time to work (commute): 20.0 minutes
For population 15 years and over in 76950:
Never married: 20.1%
Now married: 60.8%
Separated: 2.3%
Widowed: 4.1%
Divorced: 12.7%
Zip code 76950 compared to state average:
Median house value below state average.
Black race population percentage significantly below state average.
Hispanic race population percentage above state average.
Length of stay since moving in significantly above state average.
House age above state average.
Percentage of population with a bachelor's degree or higher below state average.
Averages for the 2020 tax year for zip code 76950, filed in 2021:
Average Adjusted Gross Income (AGI) in 2020: $67,966 (Individual Income Tax Returns)
Here:
$67,966
State:
$77,054
Salary/wage: $49,208 (reported on 84.8% of returns)
Here:
$49,208
State:
$62,766
(% of AGI for various income ranges: 1376.0% for AGIs below $25k, 4026.8% for AGIs $25k-50k, 6780.0% for AGIs $50k-75k, 9063.8% for AGIs $75k-100k, 15292.5% for AGIs $100k-200k)
Taxable interest for individuals: $1,649 (reported on 24.8% of returns)
This zip code:
$1,649
Texas:
$2,665
(% of AGI for various income ranges: 6.9% for AGIs below $25k, 15.5% for AGIs $25k-50k, 20.6% for AGIs $50k-75k, 36.9% for AGIs $75k-100k, 117.5% for AGIs $100k-200k)
Ordinary dividends: $9,996 (reported on 13.9% of returns)
Here:
$9,996
State:
$10,044
(% of AGI for various income ranges: 12.4% for AGIs below $25k, 50.3% for AGIs $25k-50k, 31.7% for AGIs $50k-75k, 273.1% for AGIs $75k-100k, 265.0% for AGIs $100k-200k)
Net capital gain/loss in AGI: +$34,774 (reported on 13.9% of returns)
Here:
+$34,774
State:
+$39,590
(% of AGI for various income ranges: 4.0% for AGIs below $25k, 59.0% for AGIs $25k-50k, 46.7% for AGIs $50k-75k, 533.8% for AGIs $75k-100k, 827.5% for AGIs $100k-200k)
Profit/loss from business: +$15,500 (reported on 23.0% of returns)
Here:
+$15,500
State:
+$10,888
(% of AGI for various income ranges: 79.8% for AGIs below $25k, 164.4% for AGIs $50k-75k, 270.0% for AGIs $75k-100k, 792.5% for AGIs $100k-200k)
Taxable individual retirement arrangement distribution: $17,610 (reported on 6.1% of returns)
76950:
$17,610
Texas:
$24,740
(% of AGI for various income ranges: 49.3% for AGIs below $25k, 177.2% for AGIs $50k-75k, 1029.2% for AGIs $100k-200k)
Total itemized deductions: $36,667 (reported on 3.6% of returns)
Here:
$36,667
State:
$40,428
(% of AGI for various income ranges: 563.9% for AGIs $50k-75k)
Charity contributions: $18,540 (reported on 3.0% of returns)
Here:
$18,540
State:
$18,201
(% of AGI for various income ranges: 41.0% for AGIs below $25k, 629.2% for AGIs $100k-200k)
Taxes paid: $5,783 (reported on 3.6% of returns)
76950:
$5,783
State:
$7,821
(% of AGI for various income ranges: 131.5% for AGIs $75k-100k)
Earned income credit: $2,536 (reported on 20.0% of returns)
Here:
$2,536
State:
$2,584
(% of AGI for various income ranges: 120.7% for AGIs below $25k, 106.5% for AGIs $25k-50k)
Percentage of individuals using paid preparers for their 2020 taxes: 93.9%
Here:
94%
State:
92%
(% for various income ranges: 96.4% for AGIs below $25k, 94.9% for AGIs $25k-50k, 91.7% for AGIs $50k-75k, 94.4% for AGIs $75k-100k, 90.5% for AGIs $100k-200k, 85.7% for AGIs over 200k)
Averages for the 2012 tax year for zip code 76950, filed in 2013:
Average Adjusted Gross Income (AGI) in 2012: $68,397 (Individual Income Tax Returns)
Here:
$68,397
State:
$65,384
Salary/wage: $52,769 (reported on 87.6% of returns)
Here:
$52,769
State:
$52,524
(% of AGI for various income ranges: 80.9% for AGIs below $25k, 81.6% for AGIs $25k-50k, 85.4% for AGIs $50k-75k, 86.0% for AGIs $75k-100k, 76.1% for AGIs $100k-200k, 36.4% for AGIs over 200k)
Taxable interest for individuals: $1,813 (reported on 24.9% of returns)
This zip code:
$1,813
Texas:
$2,372
(% of AGI for various income ranges: 0.9% for AGIs below $25k, 0.2% for AGIs $25k-50k, 0.3% for AGIs $50k-75k, 0.5% for AGIs $75k-100k, 0.7% for AGIs $100k-200k, 1.0% for AGIs over 200k)
Ordinary dividends: $5,641 (reported on 14.6% of returns)
Here:
$5,641
State:
$9,721
(% of AGI for various income ranges: 0.7% for AGIs below $25k, 0.5% for AGIs $25k-50k, 0.7% for AGIs $50k-75k, 0.6% for AGIs $75k-100k, 1.2% for AGIs $100k-200k, 2.1% for AGIs over 200k)
Net capital gain/loss in AGI: +$20,309 (reported on 12.4% of returns)
Here:
+$20,309
State:
+$35,319
(% of AGI for various income ranges: 0.8% for AGIs below $25k, 0.8% for AGIs $25k-50k, 0.3% for AGIs $50k-75k, 0.9% for AGIs $75k-100k, 1.7% for AGIs $100k-200k, 9.7% for AGIs over 200k)
Profit/loss from business: +$23,190 (reported on 22.7% of returns)
Here:
+$23,190
State:
+$13,732
(% of AGI for various income ranges: 6.3% for AGIs below $25k, 7.7% for AGIs $25k-50k, 2.8% for AGIs $50k-75k, 2.3% for AGIs $75k-100k, 5.7% for AGIs $100k-200k, 14.4% for AGIs over 200k)
Taxable individual retirement arrangement distribution: $11,730 (reported on 5.4% of returns)
76950:
$11,730
Texas:
$19,511
(% of AGI for various income ranges: 2.2% for AGIs below $25k, 1.8% for AGIs $50k-75k, 2.3% for AGIs $100k-200k)
Total itemized deductions: $25,259 (14% of AGI, reported on 14.6% of returns)
Here:
$25,259
State:
$24,724
Here:
13.5% of AGI
State:
15.9% of AGI
(% of AGI for various income ranges: 4.9% for AGIs $25k-50k, 4.8% for AGIs $50k-75k, 5.4% for AGIs $75k-100k, 5.8% for AGIs $100k-200k, 6.6% for AGIs over 200k)
Charity contributions: $13,047 (reported on 9.2% of returns)
Here:
$13,047
State:
$6,808
(% of AGI for various income ranges: 0.9% for AGIs $50k-75k, 0.8% for AGIs $75k-100k, 1.4% for AGIs $100k-200k, 3.8% for AGIs over 200k)
Taxes paid: $5,052 (reported on 14.6% of returns)
76950:
$5,052
State:
$6,921
(% of AGI for various income ranges: 0.7% for AGIs $25k-50k, 1.0% for AGIs $50k-75k, 0.9% for AGIs $75k-100k, 1.5% for AGIs $100k-200k, 1.3% for AGIs over 200k)
Earned income credit: $2,331 (reported on 18.9% of returns)
Here:
$2,331
State:
$2,570
(% of AGI for various income ranges: 8.0% for AGIs below $25k, 1.3% for AGIs $25k-50k)
Percentage of individuals using paid preparers for their 2012 taxes: 80.0%
Here:
80%
State:
51%
(% for various income ranges: 77.3% for AGIs below $25k, 78.4% for AGIs $25k-50k, 83.3% for AGIs $50k-75k, 81.8% for AGIs $75k-100k, 81.8% for AGIs $100k-200k, 87.5% for AGIs over 200k)
Averages for the 2004 tax year for zip code 76950, filed in 2005:
Average Adjusted Gross Income (AGI) in 2004: $49,677 (Individual Income Tax Returns)
Here:
$49,677
State:
$47,881
Salary/wage: $35,040 (reported on 86.1% of returns)
Here:
$35,040
State:
$41,947
(% of AGI for various income ranges: 110.2% for AGIs below $10k, 85.6% for AGIs $10k-25k, 88.0% for AGIs $25k-50k, 86.2% for AGIs $50k-75k, 78.6% for AGIs $75k-100k, 24.1% for AGIs over 100k)
Taxable interest for individuals: $1,688 (reported on 29.2% of returns)
This zip code:
$1,688
Texas:
$2,255
(% of AGI for various income ranges: 5.8% for AGIs below $10k, 1.0% for AGIs $10k-25k, 0.7% for AGIs $25k-50k, 0.7% for AGIs $50k-75k, 0.6% for AGIs $75k-100k, 1.2% for AGIs over 100k)
Taxable dividends: $3,033 (reported on 15.5% of returns)
Here:
$3,033
State:
$4,261
(% of AGI for various income ranges: 2.6% for AGIs below $10k, 0.9% for AGIs $10k-25k, 0.9% for AGIs $25k-50k, 0.4% for AGIs $50k-75k, 0.4% for AGIs $75k-100k, 1.4% for AGIs over 100k)
Net capital gain/loss: +$7,684 (reported on 15.0% of returns)
Here:
+$7,684
State:
+$16,110
(% of AGI for various income ranges: -1.9% for AGIs below $10k, 0.5% for AGIs $10k-25k, 0.3% for AGIs $25k-50k, 0.9% for AGIs $50k-75k, 0.7% for AGIs $75k-100k, 4.9% for AGIs over 100k)
Profit/loss from business: +$9,788 (reported on 23.8% of returns)
Here:
+$9,788
State:
+$11,013
(% of AGI for various income ranges: 14.4% for AGIs below $10k, 6.0% for AGIs $10k-25k, 1.5% for AGIs $25k-50k, -0.7% for AGIs $50k-75k, 7.3% for AGIs $75k-100k, 7.1% for AGIs over 100k)
IRA payment deduction: $3,026 (reported on 2.0% of returns)
76950:
$3,026
Texas:
$3,120
(% of AGI for various income ranges: 0.4% for AGIs $10k-25k, 0.2% for AGIs $50k-75k, 0.1% for AGIs over 100k)
Self-employed pension: $14,923 (reported on 0.7% of returns)
Here:
$14,923
Texas:
$16,401
Total itemized deductions: $17,858 (16% of AGI, reported on 11.2% of returns)
Here:
$17,858
State:
$19,631
Here:
15.9% of AGI
State:
18.9% of AGI
(% of AGI for various income ranges: 4.3% for AGIs $10k-25k, 4.1% for AGIs $25k-50k, 3.7% for AGIs $50k-75k, 5.9% for AGIs $75k-100k, 3.6% for AGIs over 100k)
Charity contributions deductions: $7,806 (6% of AGI, reported on 8.7% of returns)
Here:
$7,806
State:
$4,753
Here:
6.1% of AGI
State:
4.2% of AGI
(% of AGI for various income ranges: 0.6% for AGIs $10k-25k, 0.8% for AGIs $25k-50k, 0.7% for AGIs $50k-75k, 1.4% for AGIs $75k-100k, 2.2% for AGIs over 100k)
Total tax: $10,107 (reported on 72.3% of returns)
76950:
$10,107
State:
$9,058
(% of AGI for various income ranges: 3.9% for AGIs below $10k, 3.8% for AGIs $10k-25k, 6.3% for AGIs $25k-50k, 8.8% for AGIs $50k-75k, 12.0% for AGIs $75k-100k, 24.6% for AGIs over 100k)
Earned income credit: $1,795 (reported on 19.5% of returns)
Here:
$1,795
State:
$2,024
Percentage of individuals using paid preparers for their 2004 taxes: 83.3%
Here:
83%
State:
57%
(% for various income ranges: 78.4% for AGIs below $10k, 86.2% for AGIs $10k-25k, 82.9% for AGIs $25k-50k, 86.6% for AGIs $50k-75k, 77.2% for AGIs $75k-100k, 91.6% for AGIs over 100k)
Household received Food Stamps/SNAP in the past 12 months: 107 Household did not receive Food Stamps/SNAP in the past 12 months: 1,024
Women who had a birth in the past 12 months: 68 (66 now married, 2 unmarried) Women who did not have a birth in the past 12 months: 811 (495 now married, 311 unmarried)
Housing units in zip code 76950 with a mortgage: 343 (9 second mortgage, 10 both second mortgage and home equity loan) Median monthly owner costs for units with a mortgage: $1,565 Median monthly owner costs for units without a mortgage: $554
Residents with income below the poverty level in 2022:
This zip code:
16.7%
Whole state:
14.0%
Residents with income below 50% of the poverty level in 2022:
This zip code:
8.9%
Whole state:
7.4%
Median number of rooms in houses and condos:
Here:
5.7
State:
6.3
Median number of rooms in apartments:
Here:
4.7
State:
4.0
Notable locations in this zip code not listed on our city pages
Notable locations in zip code 76950: Cauthorn Ranch (A), Clarkson Ranch (B), Cowsert Ranch (C), D Baker Ranch (D), Davis Ranch (E), DeBerry Ranch (F), Duke Wilson Ranch (G), E Sawyer Ranch (H), Espy Ranch (I), F A Hill Ranch (J), Fawcett Ranch (K), Fort Terrett Ranch Historical Site (L), Foster Ranch (M), Friess Ranch (N), G Allison Ranch (O), Galbreath Ranch (P), Gene Wallace Ranch (Q), George Wallace Ranch (R), Gibbs Ranch (S), H Fields Ranch (T). Display/hide their locations on the map
Churches in zip code 76950 include: Cedar Hill Church (A), Presbyterian Church of the Good Shepherd (B), Saint Johns Episcopal Church (C), Church of Christ (D). Display/hide their locations on the map
Lakes and reservoirs: Tenmile Waterhole (A), Eightmile Waterhole (B), Cloudt Waterhole (C), Fivemile Waterhole (D), Steen Lake (E), Little Ogden Waterhole (F), Rock Waterhole (G), Lost Lake (H). Display/hide their locations on the map
In group quarters: 23 (-1 institutionalized population)
Size of family households: 313 2-persons, 174 3-persons, 238 4-persons, 153 5-persons
Size of nonfamily households: 229 1-person, 12 2-persons
610 married couples with children.
436 single-parent households (33 men, 403 women).
46.0% of residents of 76950 zip code speak English at home.
53.3% of residents speak Spanish at home (74% very well, 19% well, 5% not well, 3% not at all).
0.3% of residents speak Asian or Pacific Island language at home (100% very well).
Foreign born population: 410 (11.8%) (30.0% of them are naturalized citizens)
This zip code:
11.8%
Whole state:
17.2%
71%Honduras
24%Barbados
2%Malaysia
2%Taiwan
2%American
2%English
1%German
1%Irish
1%Scotch-Irish
1%Italian
0%French
Year of entry for the foreign-born population
1932010 or later
772000 to 2009
161990 to 1999
157Before 1990
Housing units lacking complete plumbing facilities: 7.3% Housing units lacking complete kitchen facilities: 6.8%
71.1%Electricity
28.3%Utility gas
Population in 1990: 4,135.
Place of birth for U.S.-born residents:
This state: 2,775
Northeast: 6
Midwest: 83
South: 72
West: 72
65% of the 76950 zip code residents lived in the same house 5 years ago. Out of people who lived in different houses, 61% lived in this county. Out of people who lived in different counties, 50% lived in Texas.
92% of the 76950 zip code residents lived in the same house 1 year ago. Out of people who lived in different houses, 52% moved from this county. Out of people who lived in different houses, 40% moved from different county within same state. Out of people who lived in different houses, 7% moved from different state.
Private vs. public school enrollment:
Students in private schools in grades 1 to 8 (elementary and middle school):
Here:
0.0%
Texas:
8.8%
Students in private schools in grades 9 to 12 (high school):
Here:
0.0%
Texas:
8.0%
Students in private undergraduate colleges:
Here:
0.0%
Texas:
16.2%
Occupation by median earnings in the past 12 months ($)
86,245Management occupations
67,744Production occupations
66,567Transportation occupations
66,224Health diagnosing and treating practitioners and other technical occupations
58,338Law enforcement workers including supervisors
40,923Construction and extraction occupations
Top industries in this zip code by the number of employees in 2005:
Mining: Support Activities for Oil and Gas Operations (100-249 employees: 2 establishments, 10-19 employees: 1 establishment, 5-9 employees: 1 establishment, 1-4 employees: 2 establishments)
Construction: Site Preparation Contractors (50-99: 1, 20-49: 1)
Accommodation and Food Services: Full-Service Restaurants (20-49: 2, 10-19: 2)
Accommodation and Food Services: Hotels (except Casino Hotels) and Motels (20-49: 2, 1-4: 5)
Wholesale Trade: Other Chemical and Allied Products Merchant Wholesalers (20-49: 1, 10-19: 1, 5-9: 1)
Construction: Land Subdivision (20-49: 1, 10-19: 1)
People in group quarters in 2010:
10 people in local jails and other municipal confinement facilities
3 people in emergency and transitional shelters (with sleeping facilities) for people experiencing homelessness
People in group quarters in 2000:
26 people in nursing homes
4 people in local jails and other confinement facilities (including police lockups)
Fatal accident statistics in 2014:
Fatal accident count: 3
Vehicles involved in fatal accidents: 4
Fatal accidents caused by drunken drivers: 0
Fatalities: 3
Persons involved in fatal accidents: 9
Pedestrians involved in fatal accidents: 0
Fatal accident statistics in 2013:
Fatal accident count: 4
Vehicles involved in fatal accidents: 4
Fatal accidents caused by drunken drivers: 1
Fatalities: 6
Persons involved in fatal accidents: 9
Pedestrians involved in fatal accidents: 0
2002 - 2018 National Fire Incident Reporting System (NFIRS) incidents
Based on the data from the years 2002 - 2018 the average number of fires per year is 35. The highest number of reported fire incidents - 87 took place in 2008, and the least - 4 in 2017. The data has a declining trend.
When looking into fire subcategories, the most reports belonged to: Outside Fires (72.9%), and Mobile Property/Vehicle Fires (16.9%).
Fire incident types reported to NFIRS in Zip Code 76950


 Nearest zip codes: 76936, 76874, 78880, 76841, 76935, 76849.


 Based on the data from the years 2002 - 2018 the average number of fires per year is 35. The highest number of reported fire incidents - 87 took place in 2008, and the least - 4 in 2017. The data has a declining trend.
 When looking into fire subcategories, the most reports belonged to: Outside Fires (72.9%), and Mobile Property/Vehicle Fires (16.9%).