Estimated zip code population in 2022: 26,185
Zip code population in 2010: 26,042
Zip code population in 2000: 24,159
Houses and condos: 13,051
Renter-occupied apartments: 7,230
% of renters here:
63%State:
38%
March 2022 cost of living index in zip code 77021: 96.6
(near average, U.S. average is 100)
Land area: 6.1
sq. mi.
Water area: 0.0
sq. mi.
Population density: 4,307 people per square mile (average).
OSM Map
General Map
Google Map
MSN Map
OSM Map
General Map
Google Map
MSN Map
OSM Map
General Map
Google Map
MSN Map
OSM Map
General Map
Google Map
MSN Map
Please wait while loading the map...
Real estate property taxes paid for housing units in 2022:
This zip code:
1.2% ($2,225)Texas:
1.5% ($4,050)
Median real estate property taxes paid for housing units with mortgages in 2022: $3,321 (1.2%)
Median real estate property taxes paid for housing units with no mortgage in 2022: $1,797 (1.2%)
Profiles of local businesses
Business Search - 14 Million verified businesses
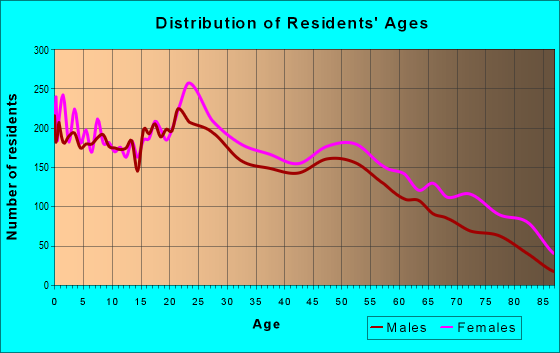
Males: 11,258 Females: 14,926
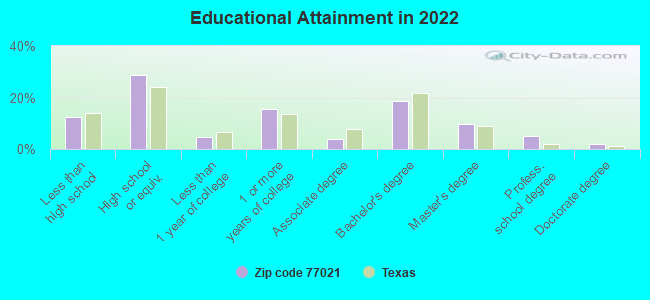
For population 25 years and over in 77021:
High school or higher: 87.1%Bachelor's degree or higher: 34.8%Graduate or professional degree: 16.4%Unemployed: 9.8%Mean travel time to work (commute): 27.6 minutes
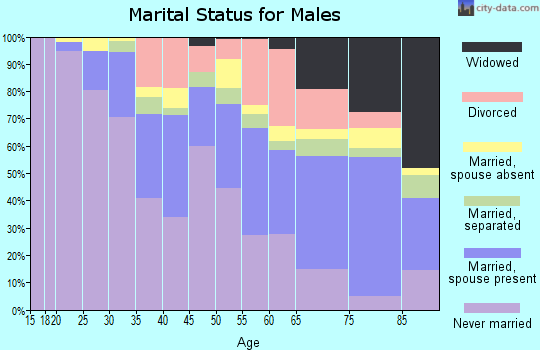
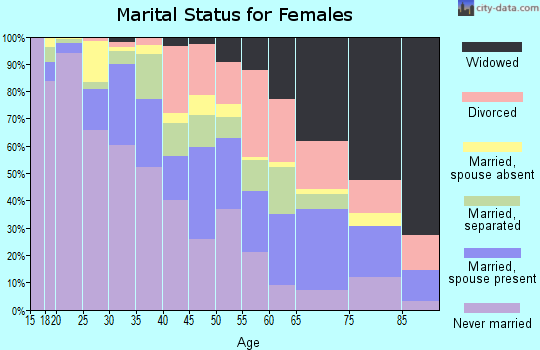
For population 15 years and over in 77021:
Never married: 46.8%Now married: 31.2%Separated: 4.7%Widowed: 6.5%Divorced: 10.8%
Zip code 77021 compared to state average:
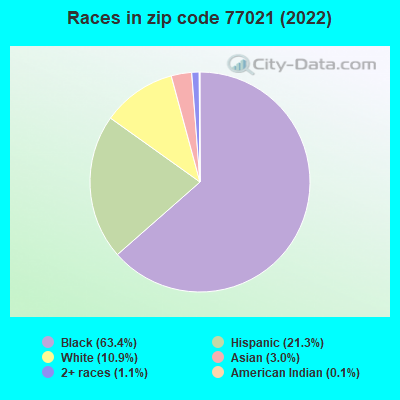
Median household income below state average. Unemployed percentage above state average. Black race population percentage significantly above state average. Hispanic race population percentage below state average. Renting percentage above state average. Length of stay since moving in significantly above state average. House age above state average. 16,605 63.4% Black 5,586 21.3% Hispanic or Latino 2,860 10.9% White 784 3.0% Asian 287 1.1% Two or more races 37 0.1% American Indian 22 0.08% Some other race
Data:
Median household income ($)
Median household income (% change since 2000)
Household income diversity
Ratio of average income to average house value (%)
Ratio of average income to average rent
Median household income ($) - White
Median household income ($) - Black or African American
Median household income ($) - Asian
Median household income ($) - Hispanic or Latino
Median household income ($) - American Indian and Alaska Native
Median household income ($) - Multirace
Median household income ($) - Other Race
Median household income for houses/condos with a mortgage ($)
Median household income for apartments without a mortgage ($)
Races - White alone (%)
Races - White alone (% change since 2000)
Races - Black alone (%)
Races - Black alone (% change since 2000)
Races - American Indian alone (%)
Races - American Indian alone (% change since 2000)
Races - Asian alone (%)
Races - Asian alone (% change since 2000)
Races - Hispanic (%)
Races - Hispanic (% change since 2000)
Races - Native Hawaiian and Other Pacific Islander alone (%)
Races - Native Hawaiian and Other Pacific Islander alone (% change since 2000)
Races - Two or more races (%)
Races - Two or more races (% change since 2000)
Races - Other race alone (%)
Races - Other race alone (% change since 2000)
Racial diversity
Unemployment (%)
Unemployment (% change since 2000)
Unemployment (%) - White
Unemployment (%) - Black or African American
Unemployment (%) - Asian
Unemployment (%) - Hispanic or Latino
Unemployment (%) - American Indian and Alaska Native
Unemployment (%) - Multirace
Unemployment (%) - Other Race
Population density (people per square mile)
Population - Males (%)
Population - Females (%)
Population - Males (%) - White
Population - Males (%) - Black or African American
Population - Males (%) - Asian
Population - Males (%) - Hispanic or Latino
Population - Males (%) - American Indian and Alaska Native
Population - Males (%) - Multirace
Population - Males (%) - Other Race
Population - Females (%) - White
Population - Females (%) - Black or African American
Population - Females (%) - Asian
Population - Females (%) - Hispanic or Latino
Population - Females (%) - American Indian and Alaska Native
Population - Females (%) - Multirace
Population - Females (%) - Other Race
Coronavirus confirmed cases (May 17, 2024)
Deaths caused by coronavirus (May 17, 2024)
Coronavirus confirmed cases (per 100k population) (May 17, 2024)
Deaths caused by coronavirus (per 100k population) (May 17, 2024)
Daily increase in number of cases (May 17, 2024)
Weekly increase in number of cases (May 17, 2024)
Cases doubled (in days) (May 17, 2024)
Hospitalized patients (Apr 18, 2022)
Negative test results (Apr 18, 2022)
Total test results (Apr 18, 2022)
COVID Vaccine doses distributed (per 100k population) (Sep 19, 2023)
COVID Vaccine doses administered (per 100k population) (Sep 19, 2023)
COVID Vaccine doses distributed (Sep 19, 2023)
COVID Vaccine doses administered (Sep 19, 2023)
Likely homosexual households (%)
Likely homosexual households (% change since 2000)
Likely homosexual households - Lesbian couples (%)
Likely homosexual households - Lesbian couples (% change since 2000)
Likely homosexual households - Gay men (%)
Likely homosexual households - Gay men (% change since 2000)
Cost of living index
Median gross rent ($)
Median contract rent ($)
Median monthly housing costs ($)
Median house or condo value ($)
Median house or condo value ($ change since 2000)
Mean house or condo value by units in structure - 1, detached ($)
Mean house or condo value by units in structure - 1, attached ($)
Mean house or condo value by units in structure - 2 ($)
Mean house or condo value by units in structure by units in structure - 3 or 4 ($)
Mean house or condo value by units in structure - 5 or more ($)
Mean house or condo value by units in structure - Boat, RV, van, etc. ($)
Mean house or condo value by units in structure - Mobile home ($)
Median house or condo value ($) - White
Median house or condo value ($) - Black or African American
Median house or condo value ($) - Asian
Median house or condo value ($) - Hispanic or Latino
Median house or condo value ($) - American Indian and Alaska Native
Median house or condo value ($) - Multirace
Median house or condo value ($) - Other Race
Median resident age
Resident age diversity
Median resident age - Males
Median resident age - Females
Median resident age - White
Median resident age - Black or African American
Median resident age - Asian
Median resident age - Hispanic or Latino
Median resident age - American Indian and Alaska Native
Median resident age - Multirace
Median resident age - Other Race
Median resident age - Males - White
Median resident age - Males - Black or African American
Median resident age - Males - Asian
Median resident age - Males - Hispanic or Latino
Median resident age - Males - American Indian and Alaska Native
Median resident age - Males - Multirace
Median resident age - Males - Other Race
Median resident age - Females - White
Median resident age - Females - Black or African American
Median resident age - Females - Asian
Median resident age - Females - Hispanic or Latino
Median resident age - Females - American Indian and Alaska Native
Median resident age - Females - Multirace
Median resident age - Females - Other Race
Commute - mean travel time to work (minutes)
Travel time to work - Less than 5 minutes (%)
Travel time to work - Less than 5 minutes (% change since 2000)
Travel time to work - 5 to 9 minutes (%)
Travel time to work - 5 to 9 minutes (% change since 2000)
Travel time to work - 10 to 19 minutes (%)
Travel time to work - 10 to 19 minutes (% change since 2000)
Travel time to work - 20 to 29 minutes (%)
Travel time to work - 20 to 29 minutes (% change since 2000)
Travel time to work - 30 to 39 minutes (%)
Travel time to work - 30 to 39 minutes (% change since 2000)
Travel time to work - 40 to 59 minutes (%)
Travel time to work - 40 to 59 minutes (% change since 2000)
Travel time to work - 60 to 89 minutes (%)
Travel time to work - 60 to 89 minutes (% change since 2000)
Travel time to work - 90 or more minutes (%)
Travel time to work - 90 or more minutes (% change since 2000)
Marital status - Never married (%)
Marital status - Now married (%)
Marital status - Separated (%)
Marital status - Widowed (%)
Marital status - Divorced (%)
Median family income ($)
Median family income (% change since 2000)
Median non-family income ($)
Median non-family income (% change since 2000)
Median per capita income ($)
Median per capita income (% change since 2000)
Median family income ($) - White
Median family income ($) - Black or African American
Median family income ($) - Asian
Median family income ($) - Hispanic or Latino
Median family income ($) - American Indian and Alaska Native
Median family income ($) - Multirace
Median family income ($) - Other Race
Median year house/condo built
Median year apartment built
Year house built - Built 2005 or later (%)
Year house built - Built 2000 to 2004 (%)
Year house built - Built 1990 to 1999 (%)
Year house built - Built 1980 to 1989 (%)
Year house built - Built 1970 to 1979 (%)
Year house built - Built 1960 to 1969 (%)
Year house built - Built 1950 to 1959 (%)
Year house built - Built 1940 to 1949 (%)
Year house built - Built 1939 or earlier (%)
Average household size
Household density (households per square mile)
Average household size - White
Average household size - Black or African American
Average household size - Asian
Average household size - Hispanic or Latino
Average household size - American Indian and Alaska Native
Average household size - Multirace
Average household size - Other Race
Occupied housing units (%)
Vacant housing units (%)
Owner occupied housing units (%)
Renter occupied housing units (%)
Vacancy status - For rent (%)
Vacancy status - For sale only (%)
Vacancy status - Rented or sold, not occupied (%)
Vacancy status - For seasonal, recreational, or occasional use (%)
Vacancy status - For migrant workers (%)
Vacancy status - Other vacant (%)
Residents with income below the poverty level (%)
Residents with income below 50% of the poverty level (%)
Children below poverty level (%)
Poor families by family type - Married-couple family (%)
Poor families by family type - Male, no wife present (%)
Poor families by family type - Female, no husband present (%)
Poverty status for native-born residents (%)
Poverty status for foreign-born residents (%)
Poverty among high school graduates not in families (%)
Poverty among people who did not graduate high school not in families (%)
Residents with income below the poverty level (%) - White
Residents with income below the poverty level (%) - Black or African American
Residents with income below the poverty level (%) - Asian
Residents with income below the poverty level (%) - Hispanic or Latino
Residents with income below the poverty level (%) - American Indian and Alaska Native
Residents with income below the poverty level (%) - Multirace
Residents with income below the poverty level (%) - Other Race
Air pollution - Air Quality Index (AQI)
Air pollution - CO
Air pollution - NO2
Air pollution - SO2
Air pollution - Ozone
Air pollution - PM10
Air pollution - PM25
Air pollution - Pb
Crime - Murders per 100,000 population
Crime - Rapes per 100,000 population
Crime - Robberies per 100,000 population
Crime - Assaults per 100,000 population
Crime - Burglaries per 100,000 population
Crime - Thefts per 100,000 population
Crime - Auto thefts per 100,000 population
Crime - Arson per 100,000 population
Crime - City-data.com crime index
Crime - Violent crime index
Crime - Property crime index
Crime - Murders per 100,000 population (5 year average)
Crime - Rapes per 100,000 population (5 year average)
Crime - Robberies per 100,000 population (5 year average)
Crime - Assaults per 100,000 population (5 year average)
Crime - Burglaries per 100,000 population (5 year average)
Crime - Thefts per 100,000 population (5 year average)
Crime - Auto thefts per 100,000 population (5 year average)
Crime - Arson per 100,000 population (5 year average)
Crime - City-data.com crime index (5 year average)
Crime - Violent crime index (5 year average)
Crime - Property crime index (5 year average)
1996 Presidential Elections Results (%) - Democratic Party (Clinton)
1996 Presidential Elections Results (%) - Republican Party (Dole)
1996 Presidential Elections Results (%) - Other
2000 Presidential Elections Results (%) - Democratic Party (Gore)
2000 Presidential Elections Results (%) - Republican Party (Bush)
2000 Presidential Elections Results (%) - Other
2004 Presidential Elections Results (%) - Democratic Party (Kerry)
2004 Presidential Elections Results (%) - Republican Party (Bush)
2004 Presidential Elections Results (%) - Other
2008 Presidential Elections Results (%) - Democratic Party (Obama)
2008 Presidential Elections Results (%) - Republican Party (McCain)
2008 Presidential Elections Results (%) - Other
2012 Presidential Elections Results (%) - Democratic Party (Obama)
2012 Presidential Elections Results (%) - Republican Party (Romney)
2012 Presidential Elections Results (%) - Other
2016 Presidential Elections Results (%) - Democratic Party (Clinton)
2016 Presidential Elections Results (%) - Republican Party (Trump)
2016 Presidential Elections Results (%) - Other
2020 Presidential Elections Results (%) - Democratic Party (Biden)
2020 Presidential Elections Results (%) - Republican Party (Trump)
2020 Presidential Elections Results (%) - Other
Ancestries Reported - Arab (%)
Ancestries Reported - Czech (%)
Ancestries Reported - Danish (%)
Ancestries Reported - Dutch (%)
Ancestries Reported - English (%)
Ancestries Reported - French (%)
Ancestries Reported - French Canadian (%)
Ancestries Reported - German (%)
Ancestries Reported - Greek (%)
Ancestries Reported - Hungarian (%)
Ancestries Reported - Irish (%)
Ancestries Reported - Italian (%)
Ancestries Reported - Lithuanian (%)
Ancestries Reported - Norwegian (%)
Ancestries Reported - Polish (%)
Ancestries Reported - Portuguese (%)
Ancestries Reported - Russian (%)
Ancestries Reported - Scotch-Irish (%)
Ancestries Reported - Scottish (%)
Ancestries Reported - Slovak (%)
Ancestries Reported - Subsaharan African (%)
Ancestries Reported - Swedish (%)
Ancestries Reported - Swiss (%)
Ancestries Reported - Ukrainian (%)
Ancestries Reported - United States (%)
Ancestries Reported - Welsh (%)
Ancestries Reported - West Indian (%)
Ancestries Reported - Other (%)
Educational Attainment - No schooling completed (%)
Educational Attainment - Less than high school (%)
Educational Attainment - High school or equivalent (%)
Educational Attainment - Less than 1 year of college (%)
Educational Attainment - 1 or more years of college (%)
Educational Attainment - Associate degree (%)
Educational Attainment - Bachelor's degree (%)
Educational Attainment - Master's degree (%)
Educational Attainment - Professional school degree (%)
Educational Attainment - Doctorate degree (%)
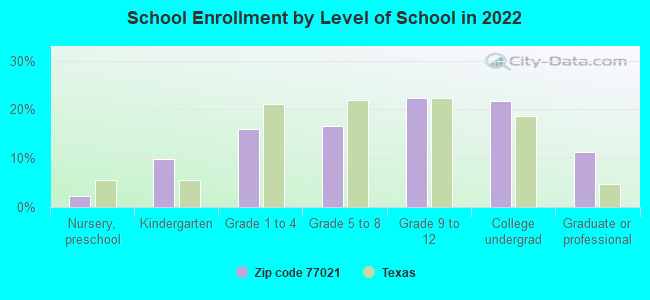
School Enrollment - Nursery, preschool (%)
School Enrollment - Kindergarten (%)
School Enrollment - Grade 1 to 4 (%)
School Enrollment - Grade 5 to 8 (%)
School Enrollment - Grade 9 to 12 (%)
School Enrollment - College undergrad (%)
School Enrollment - Graduate or professional (%)
School Enrollment - Not enrolled in school (%)
School enrollment - Public schools (%)
School enrollment - Private schools (%)
School enrollment - Not enrolled (%)
Median number of rooms in houses and condos
Median number of rooms in apartments
Housing units lacking complete plumbing facilities (%)
Housing units lacking complete kitchen facilities (%)
Density of houses
Urban houses (%)
Rural houses (%)
Households with people 60 years and over (%)
Households with people 65 years and over (%)
Households with people 75 years and over (%)
Households with one or more nonrelatives (%)
Households with no nonrelatives (%)
Population in households (%)
Family households (%)
Nonfamily households (%)
Population in families (%)
Family households with own children (%)
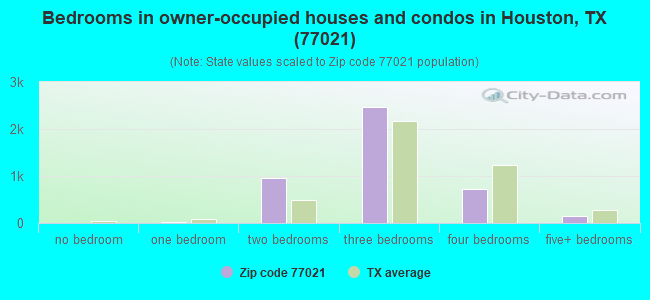
Median number of bedrooms in owner occupied houses
Mean number of bedrooms in owner occupied houses
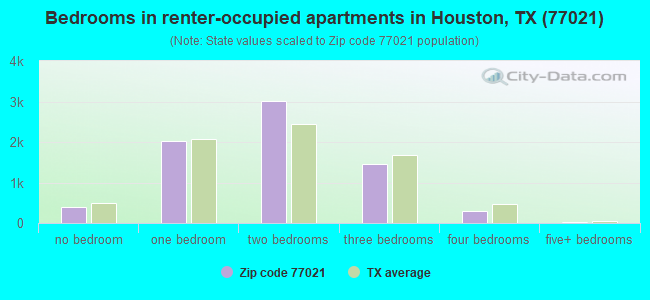
Median number of bedrooms in renter occupied houses
Mean number of bedrooms in renter occupied houses
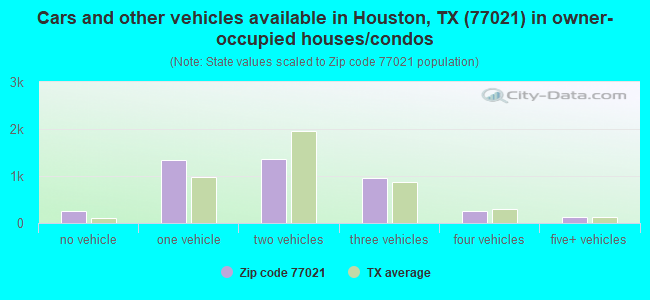
Median number of vehichles in owner occupied houses
Mean number of vehichles in owner occupied houses
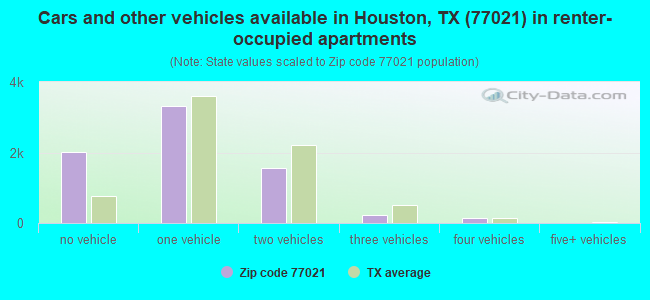
Median number of vehichles in renter occupied houses
Mean number of vehichles in renter occupied houses
Mortgage status - with mortgage (%)
Mortgage status - with second mortgage (%)
Mortgage status - with home equity loan (%)
Mortgage status - with both second mortgage and home equity loan (%)
Mortgage status - without a mortgage (%)
Average family size
Average family size - White
Average family size - Black or African American
Average family size - Asian
Average family size - Hispanic or Latino
Average family size - American Indian and Alaska Native
Average family size - Multirace
Average family size - Other Race
Geographical mobility - Same house 1 year ago (%)
Geographical mobility - Moved within same county (%)
Geographical mobility - Moved from different county within same state (%)
Geographical mobility - Moved from different state (%)
Geographical mobility - Moved from abroad (%)
Place of birth - Born in state of residence (%)
Place of birth - Born in other state (%)
Place of birth - Native, outside of US (%)
Place of birth - Foreign born (%)
Housing units in structures - 1, detached (%)
Housing units in structures - 1, attached (%)
Housing units in structures - 2 (%)
Housing units in structures - 3 or 4 (%)
Housing units in structures - 5 to 9 (%)
Housing units in structures - 10 to 19 (%)
Housing units in structures - 20 to 49 (%)
Housing units in structures - 50 or more (%)
Housing units in structures - Mobile home (%)
Housing units in structures - Boat, RV, van, etc. (%)
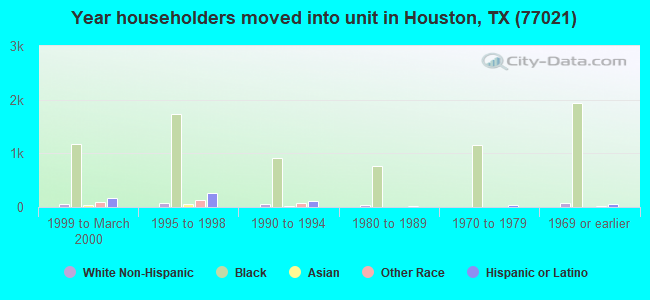
House/condo owner moved in on average (years ago)
Renter moved in on average (years ago)
Year householder moved into unit - Moved in 1999 to March 2000 (%)
Year householder moved into unit - Moved in 1995 to 1998 (%)
Year householder moved into unit - Moved in 1990 to 1994 (%)
Year householder moved into unit - Moved in 1980 to 1989 (%)
Year householder moved into unit - Moved in 1970 to 1979 (%)
Year householder moved into unit - Moved in 1969 or earlier (%)
Means of transportation to work - Drove car alone (%)
Means of transportation to work - Carpooled (%)
Means of transportation to work - Public transportation (%)
Means of transportation to work - Bus or trolley bus (%)
Means of transportation to work - Streetcar or trolley car (%)
Means of transportation to work - Subway or elevated (%)
Means of transportation to work - Railroad (%)
Means of transportation to work - Ferryboat (%)
Means of transportation to work - Taxicab (%)
Means of transportation to work - Motorcycle (%)
Means of transportation to work - Bicycle (%)
Means of transportation to work - Walked (%)
Means of transportation to work - Other means (%)
Working at home (%)
Industry diversity
Most Common Industries - Agriculture, forestry, fishing and hunting, and mining (%)
Most Common Industries - Agriculture, forestry, fishing and hunting (%)
Most Common Industries - Mining, quarrying, and oil and gas extraction (%)
Most Common Industries - Construction (%)
Most Common Industries - Manufacturing (%)
Most Common Industries - Wholesale trade (%)
Most Common Industries - Retail trade (%)
Most Common Industries - Transportation and warehousing, and utilities (%)
Most Common Industries - Transportation and warehousing (%)
Most Common Industries - Utilities (%)
Most Common Industries - Information (%)
Most Common Industries - Finance and insurance, and real estate and rental and leasing (%)
Most Common Industries - Finance and insurance (%)
Most Common Industries - Real estate and rental and leasing (%)
Most Common Industries - Professional, scientific, and management, and administrative and waste management services (%)
Most Common Industries - Professional, scientific, and technical services (%)
Most Common Industries - Management of companies and enterprises (%)
Most Common Industries - Administrative and support and waste management services (%)
Most Common Industries - Educational services, and health care and social assistance (%)
Most Common Industries - Educational services (%)
Most Common Industries - Health care and social assistance (%)
Most Common Industries - Arts, entertainment, and recreation, and accommodation and food services (%)
Most Common Industries - Arts, entertainment, and recreation (%)
Most Common Industries - Accommodation and food services (%)
Most Common Industries - Other services, except public administration (%)
Most Common Industries - Public administration (%)
Occupation diversity
Most Common Occupations - Management, business, science, and arts occupations (%)
Most Common Occupations - Management, business, and financial occupations (%)
Most Common Occupations - Management occupations (%)
Most Common Occupations - Business and financial operations occupations (%)
Most Common Occupations - Computer, engineering, and science occupations (%)
Most Common Occupations - Computer and mathematical occupations (%)
Most Common Occupations - Architecture and engineering occupations (%)
Most Common Occupations - Life, physical, and social science occupations (%)
Most Common Occupations - Education, legal, community service, arts, and media occupations (%)
Most Common Occupations - Community and social service occupations (%)
Most Common Occupations - Legal occupations (%)
Most Common Occupations - Education, training, and library occupations (%)
Most Common Occupations - Arts, design, entertainment, sports, and media occupations (%)
Most Common Occupations - Healthcare practitioners and technical occupations (%)
Most Common Occupations - Health diagnosing and treating practitioners and other technical occupations (%)
Most Common Occupations - Health technologists and technicians (%)
Most Common Occupations - Service occupations (%)
Most Common Occupations - Healthcare support occupations (%)
Most Common Occupations - Protective service occupations (%)
Most Common Occupations - Fire fighting and prevention, and other protective service workers including supervisors (%)
Most Common Occupations - Law enforcement workers including supervisors (%)
Most Common Occupations - Food preparation and serving related occupations (%)
Most Common Occupations - Building and grounds cleaning and maintenance occupations (%)
Most Common Occupations - Personal care and service occupations (%)
Most Common Occupations - Sales and office occupations (%)
Most Common Occupations - Sales and related occupations (%)
Most Common Occupations - Office and administrative support occupations (%)
Most Common Occupations - Natural resources, construction, and maintenance occupations (%)
Most Common Occupations - Farming, fishing, and forestry occupations (%)
Most Common Occupations - Construction and extraction occupations (%)
Most Common Occupations - Installation, maintenance, and repair occupations (%)
Most Common Occupations - Production, transportation, and material moving occupations (%)
Most Common Occupations - Production occupations (%)
Most Common Occupations - Transportation occupations (%)
Most Common Occupations - Material moving occupations (%)
People in Group quarters - Institutionalized population (%)
People in Group quarters - Correctional institutions (%)
People in Group quarters - Federal prisons and detention centers (%)
People in Group quarters - Halfway houses (%)
People in Group quarters - Local jails and other confinement facilities (including police lockups) (%)
People in Group quarters - Military disciplinary barracks (%)
People in Group quarters - State prisons (%)
People in Group quarters - Other types of correctional institutions (%)
People in Group quarters - Nursing homes (%)
People in Group quarters - Hospitals/wards, hospices, and schools for the handicapped (%)
People in Group quarters - Hospitals/wards and hospices for chronically ill (%)
People in Group quarters - Hospices or homes for chronically ill (%)
People in Group quarters - Military hospitals or wards for chronically ill (%)
People in Group quarters - Other hospitals or wards for chronically ill (%)
People in Group quarters - Hospitals or wards for drug/alcohol abuse (%)
People in Group quarters - Mental (Psychiatric) hospitals or wards (%)
People in Group quarters - Schools, hospitals, or wards for the mentally retarded (%)
People in Group quarters - Schools, hospitals, or wards for the physically handicapped (%)
People in Group quarters - Institutions for the deaf (%)
People in Group quarters - Institutions for the blind (%)
People in Group quarters - Orthopedic wards and institutions for the physically handicapped (%)
People in Group quarters - Wards in general hospitals for patients who have no usual home elsewhere (%)
People in Group quarters - Wards in military hospitals for patients who have no usual home elsewhere (%)
People in Group quarters - Juvenile institutions (%)
People in Group quarters - Long-term care (%)
People in Group quarters - Homes for abused, dependent, and neglected children (%)
People in Group quarters - Residential treatment centers for emotionally disturbed children (%)
People in Group quarters - Training schools for juvenile delinquents (%)
People in Group quarters - Short-term care, detention or diagnostic centers for delinquent children (%)
People in Group quarters - Type of juvenile institution unknown (%)
People in Group quarters - Noninstitutionalized population (%)
People in Group quarters - College dormitories (includes college quarters off campus) (%)
People in Group quarters - Military quarters (%)
People in Group quarters - On base (%)
People in Group quarters - Barracks, unaccompanied personnel housing (UPH), (Enlisted/Officer), ;and similar group living quarters for military personnel (%)
People in Group quarters - Transient quarters for temporary residents (%)
People in Group quarters - Military ships (%)
People in Group quarters - Group homes (%)
People in Group quarters - Homes or halfway houses for drug/alcohol abuse (%)
People in Group quarters - Homes for the mentally ill (%)
People in Group quarters - Homes for the mentally retarded (%)
People in Group quarters - Homes for the physically handicapped (%)
People in Group quarters - Other group homes (%)
People in Group quarters - Religious group quarters (%)
People in Group quarters - Dormitories (%)
People in Group quarters - Agriculture workers' dormitories on farms (%)
People in Group quarters - Job Corps and vocational training facilities (%)
People in Group quarters - Other workers' dormitories (%)
People in Group quarters - Crews of maritime vessels (%)
People in Group quarters - Other nonhousehold living situations (%)
People in Group quarters - Other noninstitutional group quarters (%)
Residents speaking English at home (%)
Residents speaking English at home - Born in the United States (%)
Residents speaking English at home - Native, born elsewhere (%)
Residents speaking English at home - Foreign born (%)
Residents speaking Spanish at home (%)
Residents speaking Spanish at home - Born in the United States (%)
Residents speaking Spanish at home - Native, born elsewhere (%)
Residents speaking Spanish at home - Foreign born (%)
Residents speaking other language at home (%)
Residents speaking other language at home - Born in the United States (%)
Residents speaking other language at home - Native, born elsewhere (%)
Residents speaking other language at home - Foreign born (%)
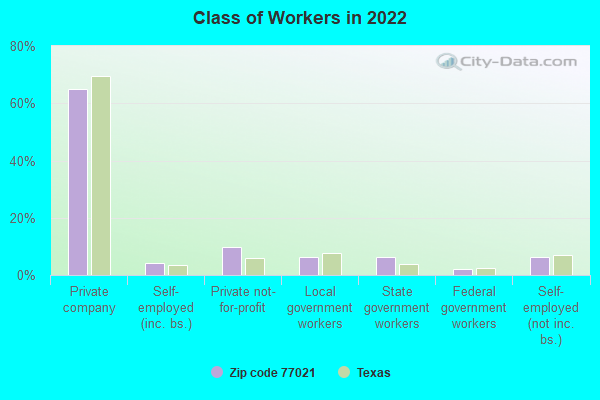
Class of Workers - Employee of private company (%)
Class of Workers - Self-employed in own incorporated business (%)
Class of Workers - Private not-for-profit wage and salary workers (%)
Class of Workers - Local government workers (%)
Class of Workers - State government workers (%)
Class of Workers - Federal government workers (%)
Class of Workers - Self-employed workers in own not incorporated business and Unpaid family workers (%)
House heating fuel used in houses and condos - Utility gas (%)
House heating fuel used in houses and condos - Bottled, tank, or LP gas (%)
House heating fuel used in houses and condos - Electricity (%)
House heating fuel used in houses and condos - Fuel oil, kerosene, etc. (%)
House heating fuel used in houses and condos - Coal or coke (%)
House heating fuel used in houses and condos - Wood (%)
House heating fuel used in houses and condos - Solar energy (%)
House heating fuel used in houses and condos - Other fuel (%)
House heating fuel used in houses and condos - No fuel used (%)
House heating fuel used in apartments - Utility gas (%)
House heating fuel used in apartments - Bottled, tank, or LP gas (%)
House heating fuel used in apartments - Electricity (%)
House heating fuel used in apartments - Fuel oil, kerosene, etc. (%)
House heating fuel used in apartments - Coal or coke (%)
House heating fuel used in apartments - Wood (%)
House heating fuel used in apartments - Solar energy (%)
House heating fuel used in apartments - Other fuel (%)
House heating fuel used in apartments - No fuel used (%)
Armed forces status - In Armed Forces (%)
Armed forces status - Civilian (%)
Armed forces status - Civilian - Veteran (%)
Armed forces status - Civilian - Nonveteran (%)
Fatal accidents locations in years 2005-2021
Fatal accidents locations in 2005
Fatal accidents locations in 2006
Fatal accidents locations in 2007
Fatal accidents locations in 2008
Fatal accidents locations in 2009
Fatal accidents locations in 2010
Fatal accidents locations in 2011
Fatal accidents locations in 2012
Fatal accidents locations in 2013
Fatal accidents locations in 2014
Fatal accidents locations in 2015
Fatal accidents locations in 2016
Fatal accidents locations in 2017
Fatal accidents locations in 2018
Fatal accidents locations in 2019
Fatal accidents locations in 2020
Fatal accidents locations in 2021
Alcohol use - People drinking some alcohol every month (%)
Alcohol use - People not drinking at all (%)
Alcohol use - Average days/month drinking alcohol
Alcohol use - Average drinks/week
Alcohol use - Average days/year people drink much
Audiometry - Average condition of hearing (%)
Audiometry - People that can hear a whisper from across a quiet room (%)
Audiometry - People that can hear normal voice from across a quiet room (%)
Audiometry - Ears ringing, roaring, buzzing (%)
Audiometry - Had a job exposure to loud noise (%)
Audiometry - Had off-work exposure to loud noise (%)
Blood Pressure & Cholesterol - Has high blood pressure (%)
Blood Pressure & Cholesterol - Checking blood pressure at home (%)
Blood Pressure & Cholesterol - Frequently checking blood cholesterol (%)
Blood Pressure & Cholesterol - Has high cholesterol level (%)
Consumer Behavior - Money monthly spent on food at supermarket/grocery store
Consumer Behavior - Money monthly spent on food at other stores
Consumer Behavior - Money monthly spent on eating out
Consumer Behavior - Money monthly spent on carryout/delivered foods
Consumer Behavior - Income spent on food at supermarket/grocery store (%)
Consumer Behavior - Income spent on food at other stores (%)
Consumer Behavior - Income spent on eating out (%)
Consumer Behavior - Income spent on carryout/delivered foods (%)
Current Health Status - General health condition (%)
Current Health Status - Blood donors (%)
Current Health Status - Has blood ever tested for HIV virus (%)
Current Health Status - Left-handed people (%)
Dermatology - People using sunscreen (%)
Diabetes - Diabetics (%)
Diabetes - Had a blood test for high blood sugar (%)
Diabetes - People taking insulin (%)
Diet Behavior & Nutrition - Diet health (%)
Diet Behavior & Nutrition - Milk product consumption (# of products/month)
Diet Behavior & Nutrition - Meals not home prepared (#/week)
Diet Behavior & Nutrition - Meals from fast food or pizza place (#/week)
Diet Behavior & Nutrition - Ready-to-eat foods (#/month)
Diet Behavior & Nutrition - Frozen meals/pizza (#/month)
Drug Use - People that ever used marijuana or hashish (%)
Drug Use - Ever used hard drugs (%)
Drug Use - Ever used any form of cocaine (%)
Drug Use - Ever used heroin (%)
Drug Use - Ever used methamphetamine (%)
Health Insurance - People covered by health insurance (%)
Kidney Conditions-Urology - Avg. # of times urinating at night
Medical Conditions - People with asthma (%)
Medical Conditions - People with anemia (%)
Medical Conditions - People with psoriasis (%)
Medical Conditions - People with overweight (%)
Medical Conditions - Elderly people having difficulties in thinking or remembering (%)
Medical Conditions - People who ever received blood transfusion (%)
Medical Conditions - People having trouble seeing even with glass/contacts (%)
Medical Conditions - People with arthritis (%)
Medical Conditions - People with gout (%)
Medical Conditions - People with congestive heart failure (%)
Medical Conditions - People with coronary heart disease (%)
Medical Conditions - People with angina pectoris (%)
Medical Conditions - People who ever had heart attack (%)
Medical Conditions - People who ever had stroke (%)
Medical Conditions - People with emphysema (%)
Medical Conditions - People with thyroid problem (%)
Medical Conditions - People with chronic bronchitis (%)
Medical Conditions - People with any liver condition (%)
Medical Conditions - People who ever had cancer or malignancy (%)
Mental Health - People who have little interest in doing things (%)
Mental Health - People feeling down, depressed, or hopeless (%)
Mental Health - People who have trouble sleeping or sleeping too much (%)
Mental Health - People feeling tired or having little energy (%)
Mental Health - People with poor appetite or overeating (%)
Mental Health - People feeling bad about themself (%)
Mental Health - People who have trouble concentrating on things (%)
Mental Health - People moving or speaking slowly or too fast (%)
Mental Health - People having thoughts they would be better off dead (%)
Oral Health - Average years since last visit a dentist
Oral Health - People embarrassed because of mouth (%)
Oral Health - People with gum disease (%)
Oral Health - General health of teeth and gums (%)
Oral Health - Average days a week using dental floss/device
Oral Health - Average days a week using mouthwash for dental problem
Oral Health - Average number of teeth
Pesticide Use - Households using pesticides to control insects (%)
Pesticide Use - Households using pesticides to kill weeds (%)
Physical Activity - People doing vigorous-intensity work activities (%)
Physical Activity - People doing moderate-intensity work activities (%)
Physical Activity - People walking or bicycling (%)
Physical Activity - People doing vigorous-intensity recreational activities (%)
Physical Activity - People doing moderate-intensity recreational activities (%)
Physical Activity - Average hours a day doing sedentary activities
Physical Activity - Average hours a day watching TV or videos
Physical Activity - Average hours a day using computer
Physical Functioning - People having limitations keeping them from working (%)
Physical Functioning - People limited in amount of work they can do (%)
Physical Functioning - People that need special equipment to walk (%)
Physical Functioning - People experiencing confusion/memory problems (%)
Physical Functioning - People requiring special healthcare equipment (%)
Prescription Medications - Average number of prescription medicines taking
Preventive Aspirin Use - Adults 40+ taking low-dose aspirin (%)
Reproductive Health - Vaginal deliveries (%)
Reproductive Health - Cesarean deliveries (%)
Reproductive Health - Deliveries resulted in a live birth (%)
Reproductive Health - Pregnancies resulted in a delivery (%)
Reproductive Health - Women breastfeeding newborns (%)
Reproductive Health - Women that had a hysterectomy (%)
Reproductive Health - Women that had both ovaries removed (%)
Reproductive Health - Women that have ever taken birth control pills (%)
Reproductive Health - Women taking birth control pills (%)
Reproductive Health - Women that have ever used Depo-Provera or injectables (%)
Reproductive Health - Women that have ever used female hormones (%)
Sexual Behavior - People 18+ that ever had sex (vaginal, anal, or oral) (%)
Sexual Behavior - Males 18+ that ever had vaginal sex with a woman (%)
Sexual Behavior - Males 18+ that ever performed oral sex on a woman (%)
Sexual Behavior - Males 18+ that ever had anal sex with a woman (%)
Sexual Behavior - Males 18+ that ever had any sex with a man (%)
Sexual Behavior - Females 18+ that ever had vaginal sex with a man (%)
Sexual Behavior - Females 18+ that ever performed oral sex on a man (%)
Sexual Behavior - Females 18+ that ever had anal sex with a man (%)
Sexual Behavior - Females 18+ that ever had any kind of sex with a woman (%)
Sexual Behavior - Average age people first had sex
Sexual Behavior - Average number of female sex partners in lifetime (males 18+)
Sexual Behavior - Average number of female vaginal sex partners in lifetime (males 18+)
Sexual Behavior - Average age people first performed oral sex on a woman (18+)
Sexual Behavior - Average number of woman performed oral sex on in lifetime (18+)
Sexual Behavior - Average number of male sex partners in lifetime (males 18+)
Sexual Behavior - Average number of male anal sex partners in lifetime (males 18+)
Sexual Behavior - Average age people first performed oral sex on a man (18+)
Sexual Behavior - Average number of male oral sex partners in lifetime (18+)
Sexual Behavior - People using protection when performing oral sex (%)
Sexual Behavior - Average number of times people have vaginal or anal sex a year
Sexual Behavior - People having sex without condom (%)
Sexual Behavior - Average number of male sex partners in lifetime (females 18+)
Sexual Behavior - Average number of male vaginal sex partners in lifetime (females 18+)
Sexual Behavior - Average number of female sex partners in lifetime (females 18+)
Sexual Behavior - Circumcised males 18+ (%)
Sleep Disorders - Average hours sleeping at night
Sleep Disorders - People that has trouble sleeping (%)
Smoking-Cigarette Use - People smoking cigarettes (%)
Taste & Smell - People 40+ having problems with smell (%)
Taste & Smell - People 40+ having problems with taste (%)
Taste & Smell - People 40+ that ever had wisdom teeth removed (%)
Taste & Smell - People 40+ that ever had tonsils teeth removed (%)
Taste & Smell - People 40+ that ever had a loss of consciousness because of a head injury (%)
Taste & Smell - People 40+ that ever had a broken nose or other serious injury to face or skull (%)
Taste & Smell - People 40+ that ever had two or more sinus infections (%)
Weight - Average height (inches)
Weight - Average weight (pounds)
Weight - Average BMI
Weight - People that are obese (%)
Weight - People that ever were obese (%)
Weight - People trying to lose weight (%)
100%
urban population.
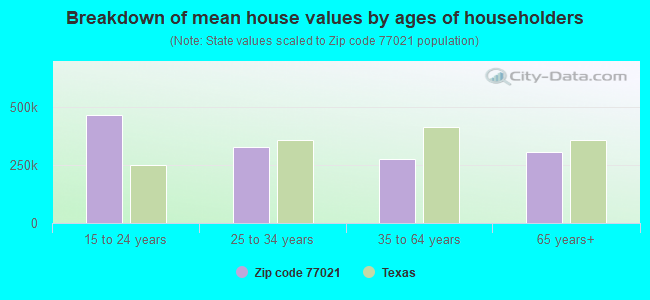
Estimated median house/condo value in 2022: $188,961
77021:
$188,961Texas:
$275,400
Median resident age: This zip code:
35.0 yearsTexas median age:
35.6 years
Average household size: This zip code:
2.2 peopleTexas:
2.6 people
Averages for the 2020 tax year for zip code 77021, filed in 2021:
Average Adjusted Gross Income (AGI) in 2020: $44,929 (Individual Income Tax Returns) Here:
$44,929State:
$77,054
Salary/wage: $41,879 (reported on 81.5% of returns )Here:
$41,879State:
$62,766
(% of AGI for various income ranges: 1148.8% for AGIs below $25k , 3509.7% for AGIs $25k-50k , 6591.7% for AGIs $50k-75k , 10193.7% for AGIs $75k-100k , 17951.2% for AGIs $100k-200k , 75701.7% for AGIs over 200k ) Taxable interest for individuals: $1,009 (reported on 11.7% of returns )This zip code:
$1,009Texas:
$2,665
(% of AGI for various income ranges: 1.8% for AGIs below $25k , 6.4% for AGIs $25k-50k , 9.5% for AGIs $50k-75k , 36.9% for AGIs $75k-100k , 67.1% for AGIs $100k-200k , 574.2% for AGIs over 200k ) Ordinary dividends: $3,936 (reported on 8.1% of returns )(% of AGI for various income ranges: 2.8% for AGIs below $25k , 17.6% for AGIs $25k-50k , 21.2% for AGIs $50k-75k , 49.7% for AGIs $75k-100k , 168.5% for AGIs $100k-200k , 1836.7% for AGIs over 200k ) Net capital gain/loss in AGI: +$18,427 (reported on 7.2% of returns )Here:
+$18,427State:
+$39,590
(% of AGI for various income ranges: 1.5% for AGIs below $25k , 10.7% for AGIs $25k-50k , 47.6% for AGIs $50k-75k , 182.9% for AGIs $75k-100k , 472.6% for AGIs $100k-200k , 10629.2% for AGIs over 200k ) Profit/loss from business: +$4,593 (reported on 25.4% of returns )Here:
+$4,593State:
+$10,888
(% of AGI for various income ranges: 81.0% for AGIs below $25k , 42.4% for AGIs $50k-75k , 242.9% for AGIs $75k-100k , 913.8% for AGIs $100k-200k , 5965.8% for AGIs over 200k ) Taxable individual retirement arrangement distribution: $16,878 (reported on 3.0% of returns )77021:
$16,878Texas:
$24,740
(% of AGI for various income ranges: 11.6% for AGIs below $25k , 27.5% for AGIs $25k-50k , 76.3% for AGIs $50k-75k , 188.9% for AGIs $75k-100k , 395.3% for AGIs $100k-200k , 1655.0% for AGIs over 200k ) Self-employed (Keogh) retirement plans: $34,200 (reported on 0.3% of returns )77021:
$34,200Texas:
$29,298
(% of AGI for various income ranges: 855.0% for AGIs over 200k ) Total itemized deductions: $32,579 (reported on 6.5% of returns )Here:
$32,579State:
$40,428
(% of AGI for various income ranges: 28.1% for AGIs below $25k , 155.5% for AGIs $25k-50k , 331.9% for AGIs $50k-75k , 699.1% for AGIs $75k-100k , 1424.4% for AGIs $100k-200k , 7370.8% for AGIs over 200k ) Charity contributions: $14,505 (reported on 5.5% of returns )Here:
$14,505State:
$18,201
(% of AGI for various income ranges: 4.3% for AGIs below $25k , 40.2% for AGIs $25k-50k , 95.8% for AGIs $50k-75k , 268.0% for AGIs $75k-100k , 540.9% for AGIs $100k-200k , 3649.2% for AGIs over 200k ) Taxes paid: $6,601 (reported on 5.9% of returns )(% of AGI for various income ranges: 5.1% for AGIs below $25k , 22.0% for AGIs $25k-50k , 63.9% for AGIs $50k-75k , 144.6% for AGIs $75k-100k , 300.0% for AGIs $100k-200k , 1335.0% for AGIs over 200k ) Earned income credit: $2,775 (reported on 31.9% of returns )(% of AGI for various income ranges: 167.7% for AGIs below $25k , 87.7% for AGIs $25k-50k ) Percentage of individuals using paid preparers for their 2020 taxes: 91.2%(% for various income ranges: 90.9% for AGIs below $25k , 92.0% for AGIs $25k-50k , 92.5% for AGIs $50k-75k , 90.7% for AGIs $75k-100k , 87.7% for AGIs $100k-200k , 87.5% for AGIs over 200k )
Averages for the 2012 tax year for zip code 77021, filed in 2013:
Average Adjusted Gross Income (AGI) in 2012: $37,660 (Individual Income Tax Returns) Here:
$37,660State:
$65,384
Salary/wage: $34,565 (reported on 84.6% of returns )Here:
$34,565State:
$52,524
(% of AGI for various income ranges: 79.1% for AGIs below $25k , 86.2% for AGIs $25k-50k , 79.5% for AGIs $50k-75k , 76.7% for AGIs $75k-100k , 79.9% for AGIs $100k-200k , 63.1% for AGIs over 200k ) Taxable interest for individuals: $983 (reported on 12.8% of returns )This zip code:
$983Texas:
$2,372
(% of AGI for various income ranges: 0.5% for AGIs below $25k , 0.2% for AGIs $25k-50k , 0.4% for AGIs $50k-75k , 0.4% for AGIs $75k-100k , 0.2% for AGIs $100k-200k , 0.3% for AGIs over 200k ) Ordinary dividends: $5,281 (reported on 6.9% of returns )(% of AGI for various income ranges: 1.4% for AGIs below $25k , 0.8% for AGIs $25k-50k , 0.4% for AGIs $50k-75k , 0.3% for AGIs $75k-100k , 0.8% for AGIs $100k-200k , 1.6% for AGIs over 200k ) Net capital gain/loss in AGI: +$24,015 (reported on 4.5% of returns )Here:
+$24,015State:
+$35,319
(% of AGI for various income ranges: 0.2% for AGIs $25k-50k , 0.3% for AGIs $50k-75k , 0.1% for AGIs $75k-100k , 1.1% for AGIs $100k-200k , 12.9% for AGIs over 200k ) Profit/loss from business: +$6,700 (reported on 21.9% of returns )Here:
+$6,700State:
+$13,732
(% of AGI for various income ranges: 10.8% for AGIs below $25k , 0.2% for AGIs $25k-50k , 1.7% for AGIs $50k-75k , 2.5% for AGIs $75k-100k , 2.3% for AGIs $100k-200k , 5.0% for AGIs over 200k ) Taxable individual retirement arrangement distribution: $11,802 (reported on 4.2% of returns )77021:
$11,802Texas:
$19,511
(% of AGI for various income ranges: 0.9% for AGIs below $25k , 0.7% for AGIs $25k-50k , 1.9% for AGIs $50k-75k , 2.9% for AGIs $75k-100k , 3.2% for AGIs $100k-200k ) Self-employment retirement plans: $18,900 (reported on 0.3% of returns )77021:
$18,900Texas:
$23,938
Total itemized deductions: $21,458 (20% of AGI, reported on 15.2% of returns )Here:
$21,458State:
$24,724
Here:
20.4% of AGIState:
15.9% of AGI
(% of AGI for various income ranges: 3.2% for AGIs below $25k , 7.6% for AGIs $25k-50k , 10.5% for AGIs $50k-75k , 12.1% for AGIs $75k-100k , 12.7% for AGIs $100k-200k , 9.5% for AGIs over 200k ) Charity contributions: $6,833 (reported on 12.6% of returns )(% of AGI for various income ranges: 0.5% for AGIs below $25k , 1.6% for AGIs $25k-50k , 2.7% for AGIs $50k-75k , 3.8% for AGIs $75k-100k , 3.3% for AGIs $100k-200k , 3.1% for AGIs over 200k ) Taxes paid: $5,222 (reported on 14.5% of returns )(% of AGI for various income ranges: 0.5% for AGIs below $25k , 1.2% for AGIs $25k-50k , 2.1% for AGIs $50k-75k , 2.4% for AGIs $75k-100k , 3.6% for AGIs $100k-200k , 3.0% for AGIs over 200k ) Earned income credit: $2,754 (reported on 37.3% of returns )(% of AGI for various income ranges: 12.4% for AGIs below $25k , 1.3% for AGIs $25k-50k ) Percentage of individuals using paid preparers for their 2012 taxes: 56.0%(% for various income ranges: 58.0% for AGIs below $25k , 53.0% for AGIs $25k-50k , 52.0% for AGIs $50k-75k , 53.5% for AGIs $75k-100k , 54.3% for AGIs $100k-200k , 68.4% for AGIs over 200k )
Averages for the 2004 tax year for zip code 77021, filed in 2005:
Average Adjusted Gross Income (AGI) in 2004: $28,675 (Individual Income Tax Returns) Here:
$28,675State:
$47,881
Salary/wage: $26,197 (reported on 86.2% of returns )Here:
$26,197State:
$41,947
(% of AGI for various income ranges: 85.2% for AGIs below $10k , 84.6% for AGIs $10k-25k , 86.6% for AGIs $25k-50k , 80.2% for AGIs $50k-75k , 68.4% for AGIs $75k-100k , 62.3% for AGIs over 100k ) Taxable interest for individuals: $1,424 (reported on 17.5% of returns )This zip code:
$1,424Texas:
$2,255
(% of AGI for various income ranges: 0.9% for AGIs below $10k , 0.4% for AGIs $10k-25k , 0.4% for AGIs $25k-50k , 1.0% for AGIs $50k-75k , 1.0% for AGIs $75k-100k , 1.9% for AGIs over 100k ) Taxable dividends: $1,429 (reported on 6.5% of returns )(% of AGI for various income ranges: 0.4% for AGIs below $10k , 0.2% for AGIs $10k-25k , 0.1% for AGIs $25k-50k , 0.3% for AGIs $50k-75k , 0.3% for AGIs $75k-100k , 0.7% for AGIs over 100k ) Net capital gain/loss: +$7,263 (reported on 4.7% of returns )Here:
+$7,263State:
+$16,110
(% of AGI for various income ranges: -0.1% for AGIs below $10k , 0.1% for AGIs $10k-25k , 0.3% for AGIs $25k-50k , -0.1% for AGIs $50k-75k , 1.8% for AGIs $75k-100k , 4.6% for AGIs over 100k ) Profit/loss from business: +$5,351 (reported on 15.1% of returns )Here:
+$5,351State:
+$11,013
(% of AGI for various income ranges: 10.2% for AGIs below $10k , 4.8% for AGIs $10k-25k , -0.2% for AGIs $25k-50k , 1.2% for AGIs $50k-75k , 3.2% for AGIs $75k-100k , 4.6% for AGIs over 100k ) IRA payment deduction: $2,312 (reported on 0.8% of returns )(% of AGI for various income ranges: 0.1% for AGIs $10k-25k , 0.1% for AGIs $25k-50k , 0.1% for AGIs $50k-75k , 0.1% for AGIs over 100k ) Self-employed pension: $21,619 (reported on 0.2% of returns )Here:
$21,619Texas:
$16,401
Total itemized deductions: $18,197 (25% of AGI, reported on 14.4% of returns )Here:
$18,197State:
$19,631
Here:
25.2% of AGIState:
18.9% of AGI
(% of AGI for various income ranges: 2.5% for AGIs below $10k , 3.4% for AGIs $10k-25k , 8.7% for AGIs $25k-50k , 12.3% for AGIs $50k-75k , 14.5% for AGIs $75k-100k , 12.9% for AGIs over 100k ) Charity contributions deductions: $5,783 (8% of AGI, reported on 13.0% of returns )Here:
7.8% of AGIState:
4.2% of AGI
(% of AGI for various income ranges: 0.2% for AGIs below $10k , 0.8% for AGIs $10k-25k , 2.4% for AGIs $25k-50k , 3.7% for AGIs $50k-75k , 4.4% for AGIs $75k-100k , 4.0% for AGIs over 100k ) Total tax: $4,549 (reported on 58.2% of returns )(% of AGI for various income ranges: 2.8% for AGIs below $10k , 2.9% for AGIs $10k-25k , 6.0% for AGIs $25k-50k , 10.4% for AGIs $50k-75k , 13.0% for AGIs $75k-100k , 19.7% for AGIs over 100k ) Earned income credit: $2,077 (reported on 40.1% of returns )Percentage of individuals using paid preparers for their 2004 taxes: 62.9%(% for various income ranges: 61.6% for AGIs below $10k , 67.1% for AGIs $10k-25k , 60.1% for AGIs $25k-50k , 58.3% for AGIs $50k-75k , 61.4% for AGIs $75k-100k , 59.8% for AGIs over 100k )
Estimated median household income in 2022: This zip code:
$46,030Texas:
$72,284
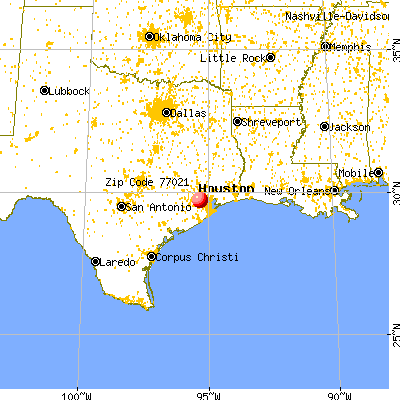
Nearest zip codes: 77004 ,
77033 ,
77023 ,
77030 ,
77051 ,
77054 .
Houston Zip Code Map
Percentage of family households: This zip code:
36.9%Texas:
50.5%
Percentage of households with unmarried partners: This zip code:
5.6%Texas:
48.7%
Likely homosexual households (counted as self-reported same-sex unmarried-partner households)
Lesbian couples: 0.1% of all households Gay men: 0.3% of all households
Household received Food Stamps/SNAP in the past 12 months: 2,730Household did not receive Food Stamps/SNAP in the past 12 months: 8,891
Women who had a birth in the past 12 months: 385 (134 now married , 243 unmarried) Women who did not have a birth in the past 12 months: 7,545 (1,978 now married , 5,608 unmarried)
Housing units in zip code 77021 with a mortgage: 1,880 (112
second mortgage , 57
both second mortgage and home equity loan )
Houses without a mortgage: 48
Median monthly owner costs for units with a mortgage: $1,810
Median monthly owner costs for units without a mortgage: $456
Residents with income below the poverty level in 2022:
This zip code:
28.6%Whole state:
14.0%
Residents with income below 50% of the poverty level in 2022:
This zip code:
10.8%Whole state:
7.4%
Median number of rooms in houses and condos: Median number of rooms in apartments: Notable locations in this zip code not listed on our city pages
Click to draw/clear zip code borders Notable locations in zip code 77021: (A) , Houston Police Department - Palm Center (B) , Houston Fire Station Number 46 (C) . Display/hide their locations on the map
Shopping Center: (1) . Display/hide its location on the map
Churches in zip code 77021 include: (A) , Garden of Gethsemane Baptist Church (B) , Greater Ebenezer Baptist Church (C) , Joy Missionary Baptist Church (D) , East Bethel Baptist Church (E) , Fellowship Christian Church (F) , Lilly Grove Baptist Church (G) , New Bright Star Missionary Baptist Church (H) , Southland Baptist Church (I) . Display/hide their locations on the map
Parks in zip code 77021 include: (1) , Southland Park (2) , Yellowstone Park (3) , Parkwood Park (4) , MacGregor Park (5) , Institute Park (6) . Display/hide their locations on the map
Year house built (houses)
170 2020 or later1,271 2010 to 20192,007 2000 to 2009731 1990 to 1999589 1980 to 1989891 1970 to 19791,377 1960 to 19693,134 1950 to 19591,943 1940 to 1949315 1939 or earlier
Zip code 77021 household income distribution in 2022 1,799 Less than $10,000983 $10,000 to $14,999458 $15,000 to $19,999707 $20,000 to $24,999474 $25,000 to $29,999550 $30,000 to $34,999313 $35,000 to $39,999459 $40,000 to $44,999422 $45,000 to $49,999597 $50,000 to $59,9991,259 $60,000 to $74,999881 $75,000 to $99,999686 $100,000 to $124,999716 $125,000 to $149,999673 $150,000 to $199,999652 $200,000 or moreEstimate of home value of owner-occupied houses/condos in 2022 in zip code 77021 16 Less than $10,00037 $10,000 to $14,9995 $15,000 to $19,99924 $25,000 to $29,99915 $30,000 to $34,99924 $35,000 to $39,99962 $40,000 to $49,999225 $50,000 to $59,999170 $60,000 to $69,999130 $70,000 to $79,999121 $80,000 to $89,99986 $90,000 to $99,999414 $100,000 to $124,999194 $125,000 to $149,999366 $150,000 to $174,999123 $175,000 to $199,999250 $200,000 to $249,999247 $250,000 to $299,999462 $300,000 to $399,999267 $400,000 to $499,999666 $500,000 to $749,999110 $750,000 to $999,99975 $1,000,000 to $1,499,99919 $1,500,000 to $1,999,99916 $2,000,000 or moreRent paid by renters in 2022 in zip code 77021 94 Less than $100111 $100 to $14971 $150 to $19975 $200 to $24930 $250 to $29933 $300 to $34966 $350 to $399129 $400 to $44950 $450 to $499103 $500 to $54983 $550 to $599211 $600 to $649381 $650 to $699379 $700 to $749282 $750 to $799770 $800 to $899521 $900 to $999998 $1,000 to $1,249964 $1,250 to $1,499988 $1,500 to $1,999351 $2,000 to $2,49939 $3,000 to $3,49942 $3,500 or more415 No cash rent
Median gross rent in 2022: $1,206.
Median price asked for vacant for-sale houses and condos in 2022: $154,201.
Estimated median house (or condo) value in 2022 for: White Non-Hispanic householders: $350,022Black or African American householders: $188,115American Indian or Alaska Native householders: $274,776Some other race householders: $139,078Two or more races householders: $266,321Hispanic or Latino householders: $124,283Estimated median house or condo value in 2022: $188,961
77021:
$188,961Texas:
$275,400
Lower value quartile - upper value quartile: $112,791 - $401,725
Mean price in 2022: Detached houses: $403,917Here:
$403,917State:
$369,058
Townhouses or other attached units: $334,796Here:
$334,796State:
$327,631
In 2-unit structures: $384,300Here:
$384,300State:
$374,947
In 3-to-4-unit structures: $236,072Here:
$236,072State:
$209,652
In 5-or-more-unit structures: $331,659Here:
$331,659State:
$413,944
Mobile homes: $100,419Here:
$100,419State:
$124,413
Occupied boats, RVs, vans, etc.: $353,410Here:
$353,410State:
$73,921
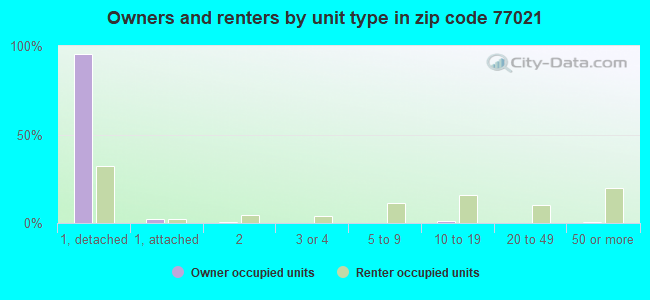
Housing units in structures:
One, detached: 7,162One, attached: 328Two: 3453 or 4: 4765 to 9: 84210 to 19: 1,44320 to 49: 75950 or more: 1,718Mobile homes: 24Boats, RVs, vans, etc.: 10Unemployment : 9.8%
Means of transportation to work in zip code 77021 68.2% 7,749 Drove a car alone7.1% 812 Carpooled3.1% 348 Bus or trolley bus0.1% 8 Subway or elevated1.8% 203 Railroad0.2% 22 Motorcycle1.1% 121 Bicycle0.9% 105 Walked1.4% 157 Other means16.2% 1,837 Worked at homeTravel time to work (commute) in zip code 77021 148 Less than 5 minutes427 5 to 9 minutes1,251 10 to 14 minutes1,634 15 to 19 minutes1,458 20 to 24 minutes436 25 to 29 minutes2,438 30 to 34 minutes240 35 to 39 minutes233 40 to 44 minutes525 45 to 59 minutes534 60 to 89 minutes246 90 or more minutes
Neighborhoods in zip code 77021: Percentage of zip code residents living and working in this county: 94.5%
Household type by relationship:
Households: 26,185
Male householders: 4,530 (1,832 living alone ), Female householders: 7,047 (2,827 living alone )2,673 spouses (2,653 opposite-sex spouses ), 949 unmarried partners , (751 opposite-sex unmarried partners ), 6,435 children (6,173 natural , 93 adopted , 167 stepchildren ), 1,151 grandchildren , 842 brothers or sisters , 407 parents , 0 foster children , 621 other relatives , 1,114 non-relatives In group quarters: 429 (-1 institutionalized population )
Size of family households: 2,946 2-persons , 1,551 3-persons , 715 4-persons , 339 5-persons , 166 6-persons , 239 7-or-more-persons
Size of nonfamily households: 4,657 1-person , 955 2-persons , 46 3-persons , 64 4-persons
1,966 married couples with children. single-parent households (244 men , 1,957 women ).
76.7% of residents of 77021 zip code speak English at home. of residents speak Spanish at home (68% very well, 17% well, 7% not well, 7% not at all ).of residents speak other Indo-European language at home (74% very well, 3% well, 7% not well, 16% not at all ).of residents speak Asian or Pacific Island language at home (59% very well, 28% well, 13% not well ).of residents speak other language at home (84% very well, 16% well ).
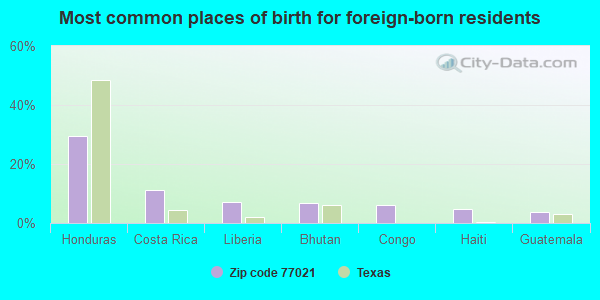
Foreign born population: 3,332 (12.7%)
(41.8%
of them are naturalized citizens )
This zip code:
12.7%Whole state:
17.2%
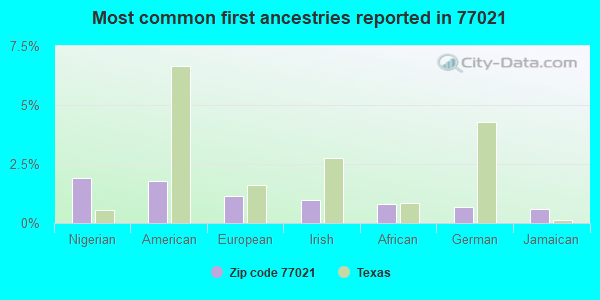
29% Honduras 11% Costa Rica 7% Liberia 7% Bhutan 6% Congo 5% Haiti 4% Guatemala 2% Nigerian 2% American 1% European 1% Irish 1% African 1% German 1% Jamaican
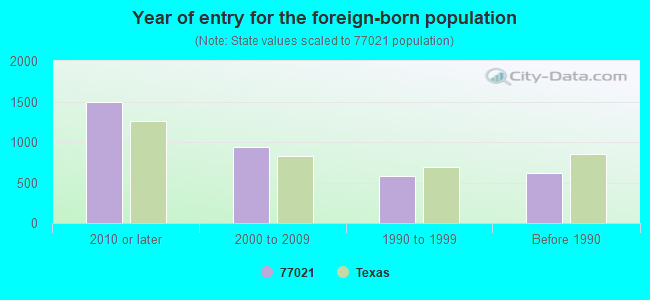
Year of entry for the foreign-born population
1,492 2010 or later 941 2000 to 2009 578 1990 to 1999 612 Before 1990
There are
110 Medical Specialists in Zip Code 77021 .
Facilities with environmental interests located in this zip code:
AMCO CHEMICAL COMPANY (6123 ENGLAND STREET in HOUSTON, TX)
(Integrated Compliance Information System) - ICIS-06-1988-0391, FORMAL ENFORCEMENT ACTION COMPLIANCE ACTIVITY (Tracking inspections of insecticide, fungicide, and rodenticide, and toxic substances) Business SIC classification: DISINFECTING AND PEST CONTROL SERVICES
BANNEKER-MCNAIR MATH/SCIENCE A (4924 GRIGGS RD in HOUSTON, TX)
(National Center for Education Statistics) - STATE ID-101912388 Organizations: HOUSTON ISD (SCHOOL DISTRICT)
AUTOCARE INC (3354 YELLOWSTONE in HOUSTON, TX)
(Resource Conservation and Recovery Act (tracking hazardous waste))
Housing units lacking complete plumbing facilities: 1.7%
Housing units lacking complete kitchen facilities: 5.2%
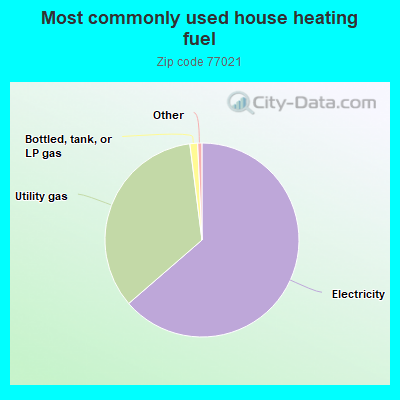
63.7% Electricity 34.4% Utility gas 1.3% Bottled, tank, or LP gas
Population in 1990: 23,815. Population change in the 1990s: +344 (+1.4%).
Place of birth for U.S.-born residents:
This state: 17,191Northeast: 392Midwest: 901South: 3,085West: 966
63% of the 77021 zip code residents lived in the same house 5 years ago.
Out of people who lived in different houses, 85% lived in this county.
Out of people who lived in different counties, 50% lived in Texas.
86% of the 77021 zip code residents lived in the same house 1 year ago.
Out of people who lived in different houses, 66% moved from this county.
Out of people who lived in different houses, 9% moved from different county within same state.
Out of people who lived in different houses, 17% moved from different state.
Out of people who lived in different houses, 5% moved from abroad.
Private vs. public school enrollment:
Students in private schools in grades 1 to 8 (elementary and middle school): 132
Students in private schools in grades 9 to 12 (high school): 1
Students in private undergraduate colleges: 103
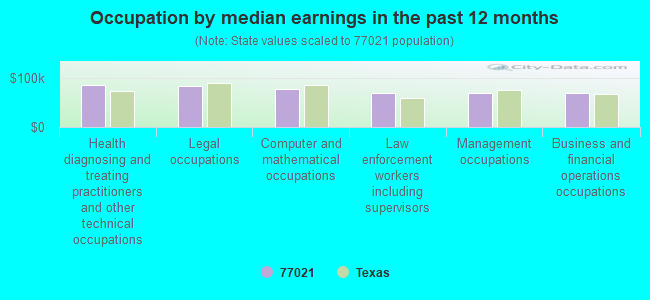
Occupation by median earnings in the past 12 months ($)
85,667 Health diagnosing and treating practitioners and other technical occupations 83,379 Legal occupations 77,236 Computer and mathematical occupations 70,690 Law enforcement workers including supervisors 68,913 Management occupations 68,874 Business and financial operations occupations
Top industries in this zip code by the number of employees in 2005:
Wholesale Trade: General Line Grocery Merchant Wholesalers (over 1000 employees: 1 establishment)Health Care and Social Assistance: Psychiatric and Substance Abuse Hospitals (250-499: 1)Other Services (except Public Administration): Religious Organizations (100-249: 1, 20-49: 2, 5-9: 5, 1-4: 6)Health Care and Social Assistance: Child Day Care Services (50-99: 1, 20-49: 1, 10-19: 7, 5-9: 6, 1-4: 7)Health Care and Social Assistance: Ambulance Services (100-249: 1, 10-19: 1)Administrative and Support and Waste Management and Remediation Services: Armored Car Services (100-249: 1, 10-19: 1)Other Services (except Public Administration): Other Social Advocacy Organizations (100-249: 1)Accommodation and Food Services: Limited-Service Restaurants (20-49: 3, 10-19: 3, 5-9: 1)
People in group quarters in 2010:
163 people in nursing facilities/skilled-nursing facilities
55 people in other noninstitutional facilities
25 people in emergency and transitional shelters (with sleeping facilities) for people experiencing homelessness
14 people in group homes for juveniles (non-correctional)
9 people in group homes intended for adults
4 people in residential treatment centers for adults
People in group quarters in 2000:
246 people in nursing homes
157 people in homes for the physically handicapped
137 people in mental (psychiatric) hospitals or wards
80 people in religious group quarters
53 people in other group homes
37 people in homes for the mentally ill
28 people in other noninstitutional group quarters
25 people in college dormitories (includes college quarters off campus)
20 people in other nonhousehold living situations
16 people in other workers' dormitories
Fatal accident statistics in 2014:
Fatal accident count: 8Vehicles involved in fatal accidents: 12Fatal accidents caused by drunken drivers: 4Fatalities: 8Persons involved in fatal accidents: 19Pedestrians involved in fatal accidents: 2
Fatal accident statistics in 2013:
Fatal accident count: 1Vehicles involved in fatal accidents: 1Fatal accidents caused by drunken drivers: 0Fatalities: 1Persons involved in fatal accidents: 3Pedestrians involved in fatal accidents: 1
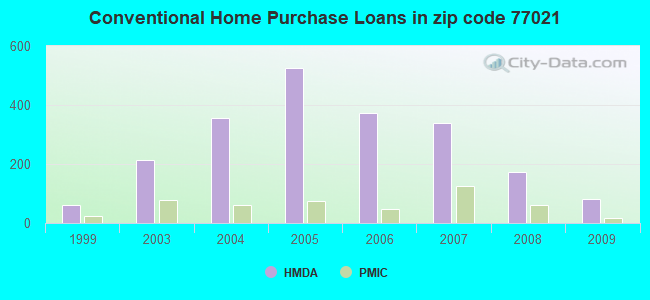
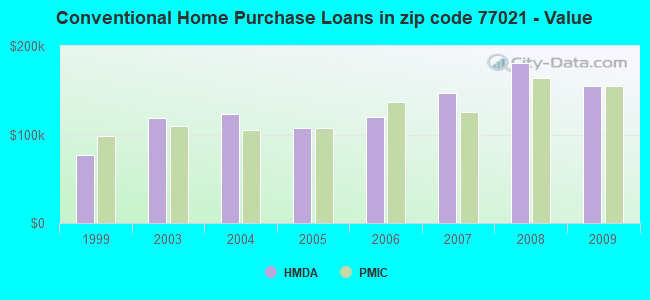
Home Mortgage Disclosure Act Aggregated Statistics For Year 2009(Based on 6 full and 12 partial tracts) A) FHA, FSA/RHS & VA B) Conventional C) Refinancings D) Home Improvement Loans E) Loans on Dwellings For 5+ Families F) Non-occupant Loans on Number Average Value Number Average Value Number Average Value Number Average Value Number Average Value Number Average Value
LOANS ORIGINATED 74 $120,365 80 $154,915 125 $166,050 22 $53,026 5 $244,380 35 $83,787 APPLICATIONS APPROVED, NOT ACCEPTED 10 $111,396 7 $325,916 16 $201,537 4 $104,232 0 $0 5 $166,042 APPLICATIONS DENIED 25 $81,291 33 $141,158 130 $132,133 86 $39,468 3 $381,240 19 $61,684 APPLICATIONS WITHDRAWN 9 $93,506 19 $202,687 48 $148,139 7 $42,049 0 $0 17 $94,135 FILES CLOSED FOR INCOMPLETENESS 4 $88,612 0 $0 14 $83,991 5 $59,664 0 $0 3 $50,943
Aggregated Statistics For Year 2008(Based on 6 full and 12 partial tracts) A) FHA, FSA/RHS & VA B) Conventional C) Refinancings D) Home Improvement Loans E) Loans on Dwellings For 5+ Families F) Non-occupant Loans on G) Loans On Manufactured Number Average Value Number Average Value Number Average Value Number Average Value Number Average Value Number Average Value Number Average Value
LOANS ORIGINATED 45 $112,695 172 $180,344 125 $156,616 47 $68,002 2 $135,745 97 $176,665 0 $0 APPLICATIONS APPROVED, NOT ACCEPTED 6 $68,430 26 $196,729 29 $127,559 11 $32,127 0 $0 17 $99,989 2 $57,115 APPLICATIONS DENIED 19 $117,915 84 $133,399 233 $90,104 150 $45,266 3 $309,067 94 $118,161 0 $0 APPLICATIONS WITHDRAWN 4 $105,645 29 $139,107 91 $117,689 20 $51,191 0 $0 23 $103,621 0 $0 FILES CLOSED FOR INCOMPLETENESS 2 $94,170 8 $101,521 13 $96,107 4 $32,500 0 $0 6 $67,383 0 $0
Aggregated Statistics For Year 2007(Based on 6 full and 12 partial tracts) A) FHA, FSA/RHS & VA B) Conventional C) Refinancings D) Home Improvement Loans E) Loans on Dwellings For 5+ Families F) Non-occupant Loans on G) Loans On Manufactured Number Average Value Number Average Value Number Average Value Number Average Value Number Average Value Number Average Value Number Average Value
LOANS ORIGINATED 18 $101,237 339 $147,292 196 $141,910 95 $53,799 3 $332,663 154 $102,086 1 $97,410 APPLICATIONS APPROVED, NOT ACCEPTED 0 $0 105 $142,689 69 $111,663 27 $44,697 0 $0 41 $121,665 1 $64,000 APPLICATIONS DENIED 4 $114,268 236 $135,057 509 $139,811 196 $48,544 3 $494,807 155 $114,824 0 $0 APPLICATIONS WITHDRAWN 2 $78,435 80 $130,236 208 $114,362 27 $51,877 0 $0 43 $92,579 0 $0 FILES CLOSED FOR INCOMPLETENESS 0 $0 37 $176,028 59 $143,250 5 $101,218 2 $492,210 14 $230,289 0 $0
Aggregated Statistics For Year 2006(Based on 6 full and 12 partial tracts) A) FHA, FSA/RHS & VA B) Conventional C) Refinancings D) Home Improvement Loans E) Loans on Dwellings For 5+ Families F) Non-occupant Loans on G) Loans On Manufactured Number Average Value Number Average Value Number Average Value Number Average Value Number Average Value Number Average Value Number Average Value
LOANS ORIGINATED 10 $92,758 374 $119,750 312 $106,779 79 $47,200 11 $645,608 170 $72,437 0 $0 APPLICATIONS APPROVED, NOT ACCEPTED 0 $0 174 $137,329 96 $102,168 23 $67,656 0 $0 50 $97,606 0 $0 APPLICATIONS DENIED 8 $103,149 319 $150,852 487 $122,008 227 $44,494 2 $90,795 177 $95,591 6 $57,985 APPLICATIONS WITHDRAWN 3 $112,110 118 $153,348 294 $118,810 29 $34,937 0 $0 54 $85,704 0 $0 FILES CLOSED FOR INCOMPLETENESS 0 $0 28 $218,464 62 $120,270 3 $34,113 0 $0 7 $93,379 0 $0
Aggregated Statistics For Year 2005(Based on 6 full and 12 partial tracts) A) FHA, FSA/RHS & VA B) Conventional C) Refinancings D) Home Improvement Loans E) Loans on Dwellings For 5+ Families F) Non-occupant Loans on G) Loans On Manufactured Number Average Value Number Average Value Number Average Value Number Average Value Number Average Value Number Average Value Number Average Value
LOANS ORIGINATED 18 $74,783 525 $107,686 399 $116,356 93 $52,076 2 $895,440 165 $73,530 4 $76,898 APPLICATIONS APPROVED, NOT ACCEPTED 4 $90,950 164 $92,437 112 $135,741 30 $70,025 2 $242,400 53 $60,182 2 $61,145 APPLICATIONS DENIED 2 $74,460 271 $109,481 547 $107,861 180 $35,632 0 $0 139 $91,848 8 $52,109 APPLICATIONS WITHDRAWN 2 $89,395 148 $121,729 288 $110,958 58 $210,179 0 $0 53 $88,428 0 $0 FILES CLOSED FOR INCOMPLETENESS 0 $0 15 $92,689 106 $111,916 0 $0 0 $0 12 $88,846 0 $0
Aggregated Statistics For Year 2004(Based on 6 full and 12 partial tracts) A) FHA, FSA/RHS & VA B) Conventional C) Refinancings D) Home Improvement Loans E) Loans on Dwellings For 5+ Families F) Non-occupant Loans on G) Loans On Manufactured Number Average Value Number Average Value Number Average Value Number Average Value Number Average Value Number Average Value Number Average Value
LOANS ORIGINATED 31 $93,291 356 $123,253 422 $110,554 71 $57,474 6 $463,882 162 $84,649 1 $20,060 APPLICATIONS APPROVED, NOT ACCEPTED 2 $144,395 137 $110,533 154 $111,578 25 $48,059 0 $0 50 $101,136 5 $48,172 APPLICATIONS DENIED 8 $90,746 209 $116,237 605 $79,237 183 $34,563 4 $88,652 98 $79,086 7 $35,036 APPLICATIONS WITHDRAWN 6 $79,748 96 $97,320 229 $88,229 30 $50,803 1 $2,494,000 39 $69,308 0 $0 FILES CLOSED FOR INCOMPLETENESS 0 $0 41 $117,670 76 $125,259 6 $80,567 0 $0 3 $74,500 0 $0
Aggregated Statistics For Year 2003(Based on 6 full and 12 partial tracts) A) FHA, FSA/RHS & VA B) Conventional C) Refinancings D) Home Improvement Loans E) Loans on Dwellings For 5+ Families F) Non-occupant Loans on Number Average Value Number Average Value Number Average Value Number Average Value Number Average Value Number Average Value
LOANS ORIGINATED 47 $77,372 214 $119,079 441 $119,146 60 $88,966 8 $997,651 98 $121,616 APPLICATIONS APPROVED, NOT ACCEPTED 5 $70,176 110 $115,046 137 $78,830 23 $116,088 0 $0 68 $81,871 APPLICATIONS DENIED 10 $88,048 120 $108,544 610 $79,949 143 $43,942 0 $0 63 $46,825 APPLICATIONS WITHDRAWN 9 $90,466 50 $105,840 273 $94,154 6 $63,865 0 $0 17 $99,376 FILES CLOSED FOR INCOMPLETENESS 1 $50,000 23 $98,271 25 $115,119 0 $0 0 $0 4 $70,435
Aggregated Statistics For Year 1999(Based on 4 full and 5 partial tracts) A) FHA, FSA/RHS & VA B) Conventional C) Refinancings D) Home Improvement Loans E) Loans on Dwellings For 5+ Families F) Non-occupant Loans on Number Average Value Number Average Value Number Average Value Number Average Value Number Average Value Number Average Value
LOANS ORIGINATED 15 $64,848 60 $76,673 158 $63,463 39 $23,460 4 $175,772 18 $42,079 APPLICATIONS APPROVED, NOT ACCEPTED 0 $0 24 $82,806 46 $46,926 23 $21,545 0 $0 1 $21,570 APPLICATIONS DENIED 0 $0 52 $65,973 123 $52,066 110 $12,482 1 $758,470 26 $26,360 APPLICATIONS WITHDRAWN 0 $0 29 $100,497 77 $62,399 13 $14,003 0 $0 3 $71,030 FILES CLOSED FOR INCOMPLETENESS 4 $37,960 5 $65,168 39 $49,412 1 $49,350 0 $0 1 $112,100
Private Mortgage Insurance Companies Aggregated Statistics For Year 2009(Based on 5 full and 10 partial tracts) A) Conventional B) Refinancings C) Non-occupant Loans on Number Average Value Number Average Value Number Average Value
LOANS ORIGINATED 16 $154,402 8 $273,439 0 $0 APPLICATIONS APPROVED, NOT ACCEPTED 4 $114,540 2 $34,110 0 $0 APPLICATIONS DENIED 4 $127,422 0 $0 1 $90,010 APPLICATIONS WITHDRAWN 2 $124,110 0 $0 0 $0 FILES CLOSED FOR INCOMPLETENESS 2 $116,865 0 $0 0 $0
Aggregated Statistics For Year 2008(Based on 6 full and 12 partial tracts) A) Conventional B) Refinancings C) Non-occupant Loans on Number Average Value Number Average Value Number Average Value
LOANS ORIGINATED 62 $163,703 10 $103,205 18 $135,388 APPLICATIONS APPROVED, NOT ACCEPTED 54 $216,052 10 $200,906 13 $123,851 APPLICATIONS DENIED 12 $175,173 1 $62,000 8 $151,260 APPLICATIONS WITHDRAWN 6 $186,390 0 $0 2 $80,190 FILES CLOSED FOR INCOMPLETENESS 6 $204,880 2 $114,475 8 $182,280
Aggregated Statistics For Year 2007(Based on 6 full and 12 partial tracts) A) Conventional B) Refinancings C) Non-occupant Loans on Number Average Value Number Average Value Number Average Value
LOANS ORIGINATED 126 $125,541 10 $267,499 30 $113,691 APPLICATIONS APPROVED, NOT ACCEPTED 33 $205,460 2 $261,790 4 $148,645 APPLICATIONS DENIED 2 $166,775 0 $0 0 $0 APPLICATIONS WITHDRAWN 8 $78,725 0 $0 1 $123,170 FILES CLOSED FOR INCOMPLETENESS 0 $0 0 $0 0 $0
Aggregated Statistics For Year 2006(Based on 6 full and 12 partial tracts) A) Conventional B) Refinancings C) Non-occupant Loans on Number Average Value Number Average Value Number Average Value
LOANS ORIGINATED 46 $136,390 4 $278,280 10 $87,339 APPLICATIONS APPROVED, NOT ACCEPTED 13 $262,242 7 $403,026 4 $258,715 APPLICATIONS DENIED 4 $39,250 2 $630,240 2 $23,920 APPLICATIONS WITHDRAWN 5 $64,536 0 $0 0 $0 FILES CLOSED FOR INCOMPLETENESS 0 $0 0 $0 0 $0
Aggregated Statistics For Year 2005(Based on 6 full and 12 partial tracts) A) Conventional B) Refinancings C) Non-occupant Loans on Number Average Value Number Average Value Number Average Value
LOANS ORIGINATED 74 $106,799 6 $191,908 14 $72,252 APPLICATIONS APPROVED, NOT ACCEPTED 18 $174,225 0 $0 2 $77,345 APPLICATIONS DENIED 5 $117,620 0 $0 2 $141,560 APPLICATIONS WITHDRAWN 6 $103,912 3 $226,253 2 $55,810 FILES CLOSED FOR INCOMPLETENESS 0 $0 2 $531,340 0 $0
Aggregated Statistics For Year 2004(Based on 6 full and 12 partial tracts) A) Conventional B) Refinancings C) Non-occupant Loans on D) Loans On Manufactured Number Average Value Number Average Value Number Average Value Number Average Value
LOANS ORIGINATED 62 $105,159 16 $151,164 11 $61,200 0 $0 APPLICATIONS APPROVED, NOT ACCEPTED 20 $162,158 3 $180,810 4 $61,182 2 $298,635 APPLICATIONS DENIED 4 $104,468 4 $57,925 4 $104,232 0 $0 APPLICATIONS WITHDRAWN 6 $205,338 1 $50,300 2 $119,390 0 $0 FILES CLOSED FOR INCOMPLETENESS 0 $0 2 $66,900 2 $66,900 0 $0
Aggregated Statistics For Year 2003(Based on 6 full and 12 partial tracts) A) Conventional B) Refinancings C) Non-occupant Loans on Number Average Value Number Average Value Number Average Value
LOANS ORIGINATED 77 $110,008 13 $149,838 7 $108,024 APPLICATIONS APPROVED, NOT ACCEPTED 43 $137,522 2 $197,800 2 $35,940 APPLICATIONS DENIED 0 $0 0 $0 0 $0 APPLICATIONS WITHDRAWN 6 $77,863 0 $0 1 $69,330 FILES CLOSED FOR INCOMPLETENESS 0 $0 0 $0 0 $0
Aggregated Statistics For Year 1999(Based on 4 full and 5 partial tracts) A) Conventional B) Refinancings C) Non-occupant Loans on Number Average Value Number Average Value Number Average Value
LOANS ORIGINATED 24 $97,755 4 $181,495 1 $17,520 APPLICATIONS APPROVED, NOT ACCEPTED 6 $144,488 2 $241,320 0 $0 APPLICATIONS DENIED 6 $81,785 2 $206,880 0 $0 APPLICATIONS WITHDRAWN 1 $35,380 0 $0 0 $0 FILES CLOSED FOR INCOMPLETENESS 0 $0 2 $46,070 0 $0
2002 - 2018 National Fire Incident Reporting System (NFIRS) incidents See full 2006 National Fire Incident Reporting System statistics for zip code 77021, Texas
Most common first names in zip code 77021 among deceased individuals Name Count Lived (average)
Willie 179 71.4 years James 169 68.7 years Mary 155 78.7 years John 146 70.0 years Robert 102 69.6 years William 95 69.9 years Charles 83 69.4 years George 74 72.6 years Joseph 72 71.3 years Annie 66 75.7 years
Most common last names in zip code 77021 among deceased individuals Last name Count Lived (average)
Williams 198 73.8 years Johnson 144 71.7 years Smith 125 69.5 years Jones 113 68.0 years Brown 108 69.5 years Thomas 86 65.8 years Jackson 86 69.7 years Davis 67 65.3 years Lewis 66 69.3 years Harris 63 65.1 years
Businesses in zip code 77021
Name Count Name Count
Advance Auto Parts 1 Payless 1 AutoZone 1 Popeyes 1 Burger King 1 RadioShack 1 CVS 1 SONIC Drive-In 1 Church's Chicken 3 Subway 2 Cricket Wireless 4 T-Mobile 1 Domino's Pizza 1 Taco Bell 1 FedEx 2 The Athlete's Foot 1 H&R Block 1 U-Haul 3 Jack In The Box 1 UPS 1 KFC 1 Walgreens 1 McDonald's 2 YMCA 1


 Nearest zip codes: 77004, 77033, 77023, 77030, 77051, 77054.
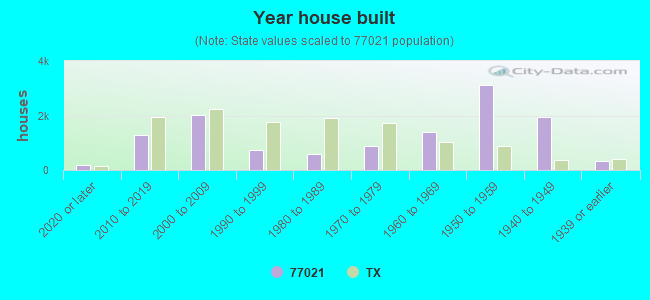


 According to the data from the years 2002 - 2018 the average number of fire incidents per year is 67. The highest number of reported fires - 164 took place in 2011, and the least - 0 in 2007. The data has a rising trend.
 When looking into fire subcategories, the most incidents belonged to: Outside Fires (39.5%), and Structure Fires (31.7%).