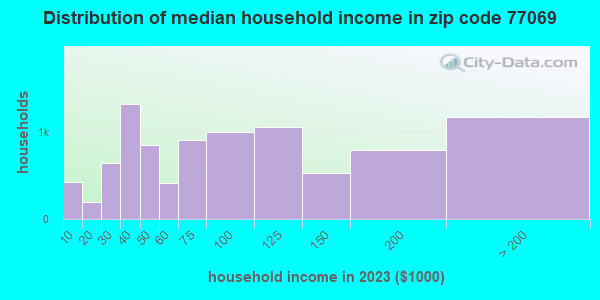
Estimated zip code population in 2022: 21,187 Zip code population in 2010: 16,541 Zip code population in 2000: 14,756
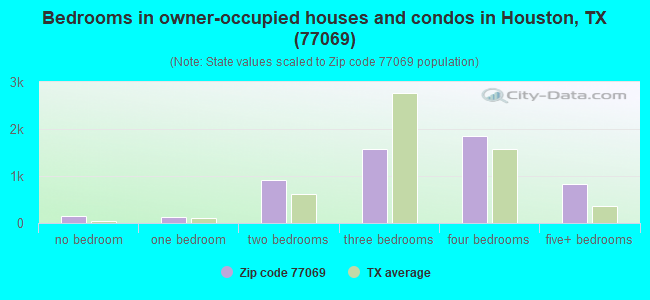
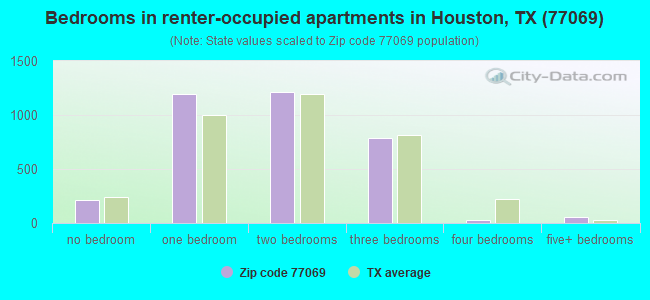
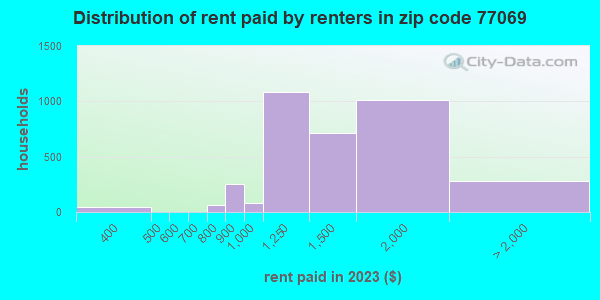
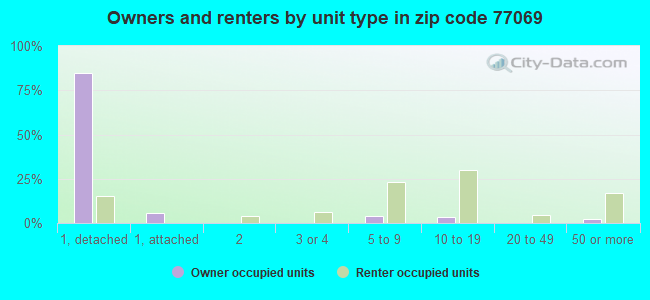
Houses and condos: 9,570 Renter-occupied apartments: 3,504
% of renters here:
39%
State:
38%
March 2022 cost of living index in zip code 77069: 98.4 (near average, U.S. average is 100)
Land area: 4.8 sq. mi. Water area: 0.0 sq. mi.
Population density: 4,419 people per square mile
(average).
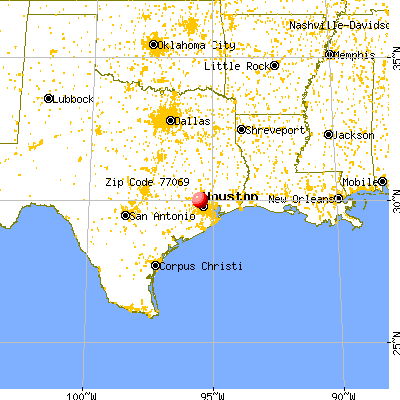
OSM Map
General Map
Google Map
MSN Map
OSM Map
General Map
Google Map
MSN Map
OSM Map
General Map
Google Map
MSN Map
OSM Map
General Map
Google Map
MSN Map
Please wait while loading the map...
Real estate property taxes paid for housing units in 2022:
This zip code:
1.3% ($4,634)
Texas:
1.5% ($4,050)
Median real estate property taxes paid for housing units with mortgages in 2022: $5,047 (1.4%) Median real estate property taxes paid for housing units with no mortgage in 2022: $3,792 (1.1%)
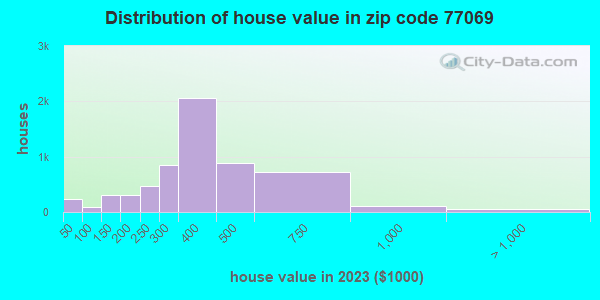
Estimated median house/condo value in 2022: $355,706
77069:
$355,706
Texas:
$275,400
According to our research of Texas and other state lists, there were 36 registered sex offenders living in 77069 zip code as of May 17, 2024. The ratio of all residents to sex offenders in zip code 77069 is 508 to 1. The ratio of registered sex offenders to all residents in this zip code is near the state average.
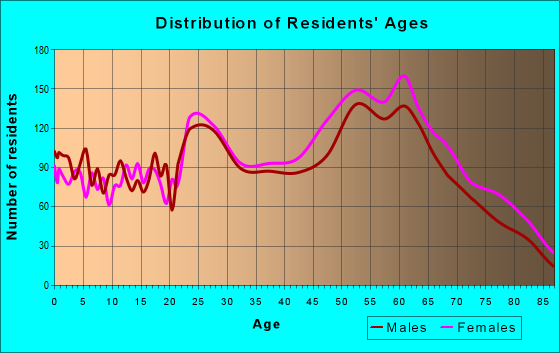
Median resident age:
This zip code:
34.8 years
Texas median age:
35.6 years
Average household size:
This zip code:
2.4 people
Texas:
2.6 people
Averages for the 2020 tax year for zip code 77069, filed in 2021:
Average Adjusted Gross Income (AGI) in 2020: $87,878 (Individual Income Tax Returns)
Here:
$87,878
State:
$77,054
Salary/wage: $71,027 (reported on 78.3% of returns)
Here:
$71,027
State:
$62,766
(% of AGI for various income ranges: 1200.9% for AGIs below $25k, 3569.1% for AGIs $25k-50k, 6466.6% for AGIs $50k-75k, 9470.6% for AGIs $75k-100k, 17355.8% for AGIs $100k-200k, 78352.4% for AGIs over 200k)
Taxable interest for individuals: $3,472 (reported on 29.2% of returns)
This zip code:
$3,472
Texas:
$2,665
(% of AGI for various income ranges: 17.7% for AGIs below $25k, 31.4% for AGIs $25k-50k, 50.9% for AGIs $50k-75k, 140.0% for AGIs $75k-100k, 278.2% for AGIs $100k-200k, 2127.2% for AGIs over 200k)
Ordinary dividends: $12,259 (reported on 25.5% of returns)
Here:
$12,259
State:
$10,044
(% of AGI for various income ranges: 34.4% for AGIs below $25k, 63.7% for AGIs $25k-50k, 196.4% for AGIs $50k-75k, 414.1% for AGIs $75k-100k, 893.2% for AGIs $100k-200k, 6733.2% for AGIs over 200k)
Net capital gain/loss in AGI: +$25,664 (reported on 24.4% of returns)
Here:
+$25,664
State:
+$39,590
(% of AGI for various income ranges: 6.3% for AGIs below $25k, 62.3% for AGIs $25k-50k, 89.1% for AGIs $50k-75k, 295.5% for AGIs $75k-100k, 877.2% for AGIs $100k-200k, 19394.0% for AGIs over 200k)
Profit/loss from business: +$10,238 (reported on 24.2% of returns)
Here:
+$10,238
State:
+$10,888
(% of AGI for various income ranges: 69.0% for AGIs below $25k, 37.6% for AGIs $25k-50k, 202.3% for AGIs $50k-75k, 394.5% for AGIs $75k-100k, 942.4% for AGIs $100k-200k, 4080.0% for AGIs over 200k)
Taxable individual retirement arrangement distribution: $33,866 (reported on 12.1% of returns)
77069:
$33,866
Texas:
$24,740
(% of AGI for various income ranges: 50.6% for AGIs below $25k, 130.6% for AGIs $25k-50k, 275.1% for AGIs $50k-75k, 859.0% for AGIs $75k-100k, 1811.4% for AGIs $100k-200k, 5852.4% for AGIs over 200k)
Self-employed (Keogh) retirement plans: $19,560 (reported on 0.5% of returns)
77069:
$19,560
Texas:
$29,298
(% of AGI for various income ranges: 40.8% for AGIs $100k-200k, 270.4% for AGIs over 200k)
Total itemized deductions: $40,383 (reported on 10.8% of returns)
Here:
$40,383
State:
$40,428
(% of AGI for various income ranges: 56.4% for AGIs below $25k, 216.6% for AGIs $25k-50k, 477.8% for AGIs $50k-75k, 759.2% for AGIs $75k-100k, 1306.6% for AGIs $100k-200k, 7172.8% for AGIs over 200k)
Charity contributions: $17,399 (reported on 8.9% of returns)
Here:
$17,399
State:
$18,201
(% of AGI for various income ranges: 5.9% for AGIs below $25k, 33.5% for AGIs $25k-50k, 102.2% for AGIs $50k-75k, 153.9% for AGIs $75k-100k, 415.9% for AGIs $100k-200k, 3577.2% for AGIs over 200k)
Taxes paid: $7,306 (reported on 10.3% of returns)
77069:
$7,306
State:
$7,821
(% of AGI for various income ranges: 8.4% for AGIs below $25k, 37.4% for AGIs $25k-50k, 91.0% for AGIs $50k-75k, 174.5% for AGIs $75k-100k, 281.5% for AGIs $100k-200k, 954.0% for AGIs over 200k)
Earned income credit: $2,381 (reported on 17.1% of returns)
Here:
$2,381
State:
$2,584
(% of AGI for various income ranges: 120.0% for AGIs below $25k, 71.2% for AGIs $25k-50k)
Percentage of individuals using paid preparers for their 2020 taxes: 90.5%
Here:
90%
State:
92%
(% for various income ranges: 90.0% for AGIs below $25k, 91.9% for AGIs $25k-50k, 92.0% for AGIs $50k-75k, 89.2% for AGIs $75k-100k, 90.2% for AGIs $100k-200k, 87.8% for AGIs over 200k)
Averages for the 2012 tax year for zip code 77069, filed in 2013:
Average Adjusted Gross Income (AGI) in 2012: $149,140 (Individual Income Tax Returns)
Here:
$149,140
State:
$65,384
Salary/wage: $83,479 (reported on 81.1% of returns)
Here:
$83,479
State:
$52,524
(% of AGI for various income ranges: 76.3% for AGIs below $25k, 81.6% for AGIs $25k-50k, 74.4% for AGIs $50k-75k, 68.2% for AGIs $75k-100k, 66.8% for AGIs $100k-200k, 33.1% for AGIs over 200k)
Taxable interest for individuals: $3,999 (reported on 38.5% of returns)
This zip code:
$3,999
Texas:
$2,372
(% of AGI for various income ranges: 1.3% for AGIs below $25k, 0.9% for AGIs $25k-50k, 1.2% for AGIs $50k-75k, 1.5% for AGIs $75k-100k, 1.3% for AGIs $100k-200k, 0.9% for AGIs over 200k)
Ordinary dividends: $15,725 (reported on 31.0% of returns)
Here:
$15,725
State:
$9,721
(% of AGI for various income ranges: 3.5% for AGIs below $25k, 2.3% for AGIs $25k-50k, 2.5% for AGIs $50k-75k, 3.1% for AGIs $75k-100k, 3.2% for AGIs $100k-200k, 3.4% for AGIs over 200k)
Net capital gain/loss in AGI: +$85,655 (reported on 27.3% of returns)
Here:
+$85,655
State:
+$35,319
(% of AGI for various income ranges: 0.2% for AGIs below $25k, 0.2% for AGIs $25k-50k, 0.5% for AGIs $50k-75k, 1.1% for AGIs $75k-100k, 1.6% for AGIs $100k-200k, 22.6% for AGIs over 200k)
Profit/loss from business: +$22,157 (reported on 19.4% of returns)
Here:
+$22,157
State:
+$13,732
(% of AGI for various income ranges: 8.7% for AGIs below $25k, 2.4% for AGIs $25k-50k, 3.1% for AGIs $50k-75k, 2.0% for AGIs $75k-100k, 4.6% for AGIs $100k-200k, 2.4% for AGIs over 200k)
Taxable individual retirement arrangement distribution: $33,766 (reported on 14.5% of returns)
77069:
$33,766
Texas:
$19,511
(% of AGI for various income ranges: 3.7% for AGIs below $25k, 3.2% for AGIs $25k-50k, 4.4% for AGIs $50k-75k, 6.4% for AGIs $75k-100k, 7.4% for AGIs $100k-200k, 2.1% for AGIs over 200k)
Self-employment retirement plans: $24,264 (reported on 1.2% of returns)
77069:
$24,264
Texas:
$23,938
Total itemized deductions: $33,310 (10% of AGI, reported on 36.1% of returns)
Here:
$33,310
State:
$24,724
Here:
10.2% of AGI
State:
15.9% of AGI
(% of AGI for various income ranges: 13.0% for AGIs below $25k, 10.2% for AGIs $25k-50k, 11.4% for AGIs $50k-75k, 11.1% for AGIs $75k-100k, 11.8% for AGIs $100k-200k, 6.5% for AGIs over 200k)
Charity contributions: $11,283 (reported on 31.1% of returns)
Here:
$11,283
State:
$6,808
(% of AGI for various income ranges: 1.0% for AGIs below $25k, 1.4% for AGIs $25k-50k, 1.9% for AGIs $50k-75k, 2.1% for AGIs $75k-100k, 2.5% for AGIs $100k-200k, 2.5% for AGIs over 200k)
Taxes paid: $7,504 (reported on 35.3% of returns)
77069:
$7,504
State:
$6,921
(% of AGI for various income ranges: 2.9% for AGIs below $25k, 1.9% for AGIs $25k-50k, 2.6% for AGIs $50k-75k, 3.2% for AGIs $75k-100k, 3.6% for AGIs $100k-200k, 1.2% for AGIs over 200k)
Earned income credit: $2,098 (reported on 13.4% of returns)
Here:
$2,098
State:
$2,570
(% of AGI for various income ranges: 5.7% for AGIs below $25k, 0.8% for AGIs $25k-50k)
Percentage of individuals using paid preparers for their 2012 taxes: 48.3%
Here:
48%
State:
51%
(% for various income ranges: 44.0% for AGIs below $25k, 44.3% for AGIs $25k-50k, 45.9% for AGIs $50k-75k, 47.1% for AGIs $75k-100k, 52.2% for AGIs $100k-200k, 66.3% for AGIs over 200k)
Averages for the 2004 tax year for zip code 77069, filed in 2005:
Average Adjusted Gross Income (AGI) in 2004: $97,110 (Individual Income Tax Returns)
Here:
$97,110
State:
$47,881
Salary/wage: $81,804 (reported on 80.0% of returns)
Here:
$81,804
State:
$41,947
(% of AGI for various income ranges: 74.8% for AGIs $10k-25k, 79.3% for AGIs $25k-50k, 70.4% for AGIs $50k-75k, 65.9% for AGIs $75k-100k, 64.4% for AGIs over 100k)
Taxable interest for individuals: $3,625 (reported on 54.3% of returns)
This zip code:
$3,625
Texas:
$2,255
(% of AGI for various income ranges: 3.8% for AGIs $10k-25k, 2.1% for AGIs $25k-50k, 2.9% for AGIs $50k-75k, 3.2% for AGIs $75k-100k, 1.6% for AGIs over 100k)
Taxable dividends: $6,207 (reported on 41.5% of returns)
Here:
$6,207
State:
$4,261
(% of AGI for various income ranges: 3.4% for AGIs $10k-25k, 2.2% for AGIs $25k-50k, 2.8% for AGIs $50k-75k, 3.4% for AGIs $75k-100k, 2.5% for AGIs over 100k)
Net capital gain/loss: +$17,860 (reported on 37.5% of returns)
Here:
+$17,860
State:
+$16,110
(% of AGI for various income ranges: 0.0% for AGIs $10k-25k, 0.2% for AGIs $25k-50k, 0.8% for AGIs $50k-75k, 2.5% for AGIs $75k-100k, 8.9% for AGIs over 100k)
Profit/loss from business: +$22,530 (reported on 19.7% of returns)
Here:
+$22,530
State:
+$11,013
(% of AGI for various income ranges: 4.9% for AGIs $10k-25k, 3.7% for AGIs $25k-50k, 4.6% for AGIs $50k-75k, 4.5% for AGIs $75k-100k, 4.5% for AGIs over 100k)
IRA payment deduction: $3,681 (reported on 3.6% of returns)
77069:
$3,681
Texas:
$3,120
(% of AGI for various income ranges: 0.2% for AGIs $10k-25k, 0.2% for AGIs $25k-50k, 0.3% for AGIs $50k-75k, 0.2% for AGIs $75k-100k, 0.1% for AGIs over 100k)
Self-employed pension: $19,162 (reported on 1.9% of returns)
Here:
$19,162
Texas:
$16,401
(% of AGI for various income ranges: 0.1% for AGIs $25k-50k, 0.2% for AGIs $50k-75k, 0.4% for AGIs $75k-100k, 0.4% for AGIs over 100k)
Total itemized deductions: $22,314 (13% of AGI, reported on 42.8% of returns)
Here:
$22,314
State:
$19,631
Here:
13.2% of AGI
State:
18.9% of AGI
(% of AGI for various income ranges: 14.6% for AGIs $10k-25k, 13.5% for AGIs $25k-50k, 16.0% for AGIs $50k-75k, 15.8% for AGIs $75k-100k, 7.8% for AGIs over 100k)
Charity contributions deductions: $6,019 (3% of AGI, reported on 38.3% of returns)
Here:
$6,019
State:
$4,753
Here:
3.4% of AGI
State:
4.2% of AGI
(% of AGI for various income ranges: 1.5% for AGIs $10k-25k, 1.7% for AGIs $25k-50k, 2.5% for AGIs $50k-75k, 3.1% for AGIs $75k-100k, 2.4% for AGIs over 100k)
Total tax: $23,639 (reported on 81.2% of returns)
77069:
$23,639
State:
$9,058
(% of AGI for various income ranges: 4.6% for AGIs $10k-25k, 8.5% for AGIs $25k-50k, 11.2% for AGIs $50k-75k, 12.3% for AGIs $75k-100k, 23.0% for AGIs over 100k)
Earned income credit: $1,516 (reported on 8.1% of returns)
Here:
$1,516
State:
$2,024
Percentage of individuals using paid preparers for their 2004 taxes: 51.6%
Here:
52%
State:
57%
(% for various income ranges: 45.3% for AGIs below $10k, 53.4% for AGIs $10k-25k, 46.6% for AGIs $25k-50k, 52.4% for AGIs $50k-75k, 53.5% for AGIs $75k-100k, 58.4% for AGIs over 100k)
Likely homosexual households (counted as self-reported same-sex unmarried-partner households)
Lesbian couples: 0.6% of all households
Gay men: 0.3% of all households
Household received Food Stamps/SNAP in the past 12 months: 753 Household did not receive Food Stamps/SNAP in the past 12 months: 8,155
Women who had a birth in the past 12 months: 512 (261 now married, 246 unmarried) Women who did not have a birth in the past 12 months: 4,328 (1,531 now married, 2,808 unmarried)
Housing units in zip code 77069 with a mortgage: 3,093 (403 second mortgage, 228 both second mortgage and home equity loan) Houses without a mortgage: 25
Median monthly owner costs for units with a mortgage: $2,233 Median monthly owner costs for units without a mortgage: $802
Residents with income below the poverty level in 2022:
This zip code:
19.1%
Whole state:
14.0%
Residents with income below 50% of the poverty level in 2022:
This zip code:
7.8%
Whole state:
7.4%
Median number of rooms in houses and condos:
Here:
7.4
State:
6.3
Median number of rooms in apartments:
Here:
4.2
State:
4.0
Notable locations in this zip code not listed on our city pages
Shopping Centers: North Oaks Shopping Center (1), Champions Forest Plaza Shopping Center (2), Champions Village I Shopping Center (3), Old Champions Village Shopping Center (4), Popolo Village Shopping Center (5). Display/hide their locations on the map
Churches in zip code 77069 include: Champion Forest Baptist Church (A), Saint Dunstan Church (B), Saint Dunstans Episcopal Church (C), John Wesley United Methodist Church (D), Northwest United Pentecostal Church (E), Willowbrook Community Church (F). Display/hide their locations on the map
In group quarters: 17 (-1 institutionalized population)
Size of family households: 2,786 2-persons, 1,254 3-persons, 796 4-persons, 428 5-persons, 87 6-persons, 199 7-or-more-persons
Size of nonfamily households: 2,873 1-person, 454 2-persons, 92 3-persons
2,801 married couples with children.
2,045 single-parent households (155 men, 1,890 women).
78.9% of residents of 77069 zip code speak English at home.
13.7% of residents speak Spanish at home (64% very well, 29% well, 3% not well, 3% not at all).
5.7% of residents speak other Indo-European language at home (92% very well, 7% well, 1% not well).
1.8% of residents speak Asian or Pacific Island language at home (66% very well, 21% well, 9% not well, 4% not at all).
0.3% of residents speak other language at home (100% very well).
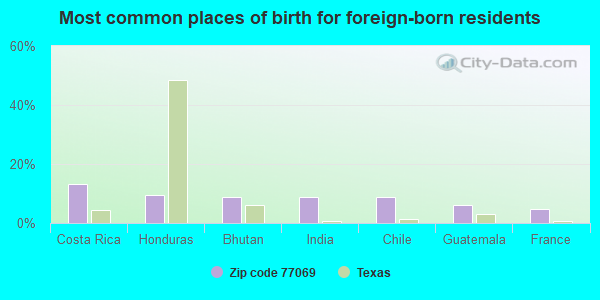
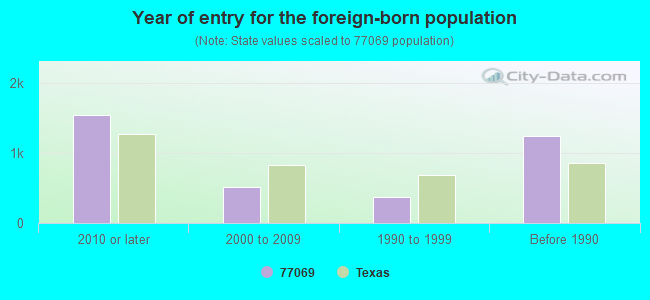
Foreign born population: 2,685 (12.7%) (73.7% of them are naturalized citizens)
Facilities with environmental interests located in this zip code:
1.25 DRY CLEAN SUPER CENTER (5050 W FM 1960 RD HUNTWICK STE 104A in HOUSTON, TX)
(Resource Conservation and Recovery Act (tracking hazardous waste)) Alternative names: 125 DRY CLEAN SUPER CENTER
APOLLO PAINT & BODY SHOP INC (6455 FM 1960 W in HOUSTON, TX)
(Resource Conservation and Recovery Act (tracking hazardous waste)) Business NAICS classification: AUTOMOTIVE BODY, PAINT, AND INTERIOR REPAIR AND MAINTENANCE. Alternative names: APOLLO PAINT AND BODY
AFCO NO 10503 (8770 TIDWELL in HOUSTON, TX)
Conditionally Exempt Small Quantity Generators, less than 100 kg/month of hazardous waste (Resource Conservation and Recovery Act (tracking hazardous waste)) - notification Organizations: MICRO ENERGY LLC DBA AFCO (CONTACT/OWNER)
Housing units lacking complete plumbing facilities: 1.6% Housing units lacking complete kitchen facilities: 2.7%
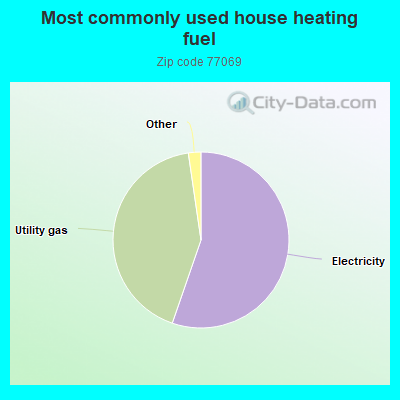
55.3%Electricity
42.4%Utility gas
0.9%No fuel used
0.5%Bottled, tank, or LP gas
0.5%Fuel oil, kerosene, etc.
Population in 1990: 11,617. Population change in the 1990s: +3,139 (+27.0%).
Place of birth for U.S.-born residents:
This state: 9,671
Northeast: 1,233
Midwest: 1,547
South: 3,735
West: 1,459
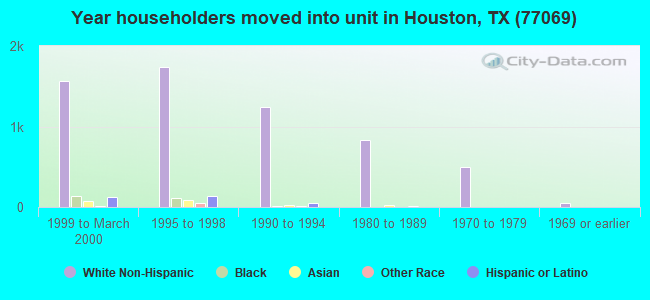
49% of the 77069 zip code residents lived in the same house 5 years ago. Out of people who lived in different houses, 66% lived in this county. Out of people who lived in different counties, 50% lived in Texas.
83% of the 77069 zip code residents lived in the same house 1 year ago. Out of people who lived in different houses, 61% moved from this county. Out of people who lived in different houses, 12% moved from different county within same state. Out of people who lived in different houses, 20% moved from different state. Out of people who lived in different houses, 4% moved from abroad.
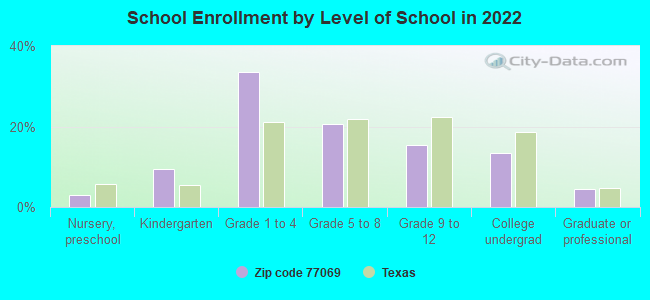
Private vs. public school enrollment:
Students in private schools in grades 1 to 8 (elementary and middle school): 418
Here:
12.9%
Texas:
8.8%
Students in private schools in grades 9 to 12 (high school): 48
Here:
5.3%
Texas:
8.0%
Students in private undergraduate colleges: 30
Here:
3.7%
Texas:
16.2%
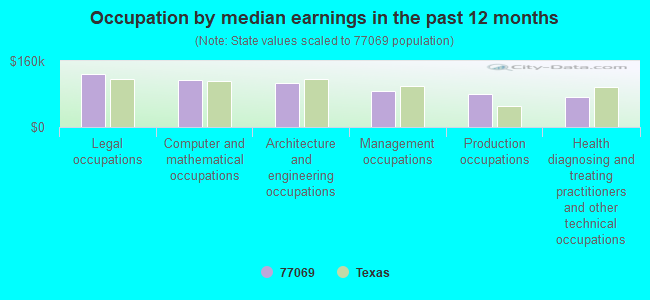
Occupation by median earnings in the past 12 months ($)
128,832Legal occupations
112,943Computer and mathematical occupations
107,281Architecture and engineering occupations
87,355Management occupations
79,381Production occupations
73,554Health diagnosing and treating practitioners and other technical occupations
Companies with federal contracts located in this zip code:
TEXAS-OHIO ENERGY, INC (4606 FM 1960 ROAD WEST, SU in HOUSTON, CA; small business) : $4,234,000 in 5 contractsfrom 2004 to 2005
Contracts for Gas Services by Army Signed by year:2000: $0; 2001: $0; 2002: $0; 2003: $0; 2004: $1,289,000; 2005: $2,945,000; 2006: $0.
Biggest contracts:
$2,810,000 with Army for Gas Services. Taking place in CA. Signed on 2005-09-27. Completion date: 2011-08-24.
$980,000, same as above.Signed on 2004-09-16. Completion date: 2011-08-24.
$309,000, same as above.Signed on 2004-11-29. Completion date: 2011-08-24.
$135,000, same as above.Signed on 2005-03-22. Completion date: 2011-08-24.
AMARCH CORPORATION (5629 FM 1960 RD WEST SUITE in HOUSTON, TX; small business) : $720,771 in 16 contractsfrom 1999 to 2004
Contracts for Radio and Television Communication Equipment, Except Airborne, Installation of Equipment -- Automatic Data Processing Equipment (Including Firmware), Software, Supplies and Support Equipment, Video Recording and Reproducing Equipment, Other ADP and Telecommunications Services (includes data storage on tapes, compact disks, etc.), and moreby Army, Air Force, Navy Signed by year:2000: $132,731; 2001: $139,948; 2002: $85,787; 2003: $271,275; 2004: $38,905; 2005: $0; 2006: $0.
Biggest contracts:
$138,037 with Army for Radio and Television Communication Equipment, Except Airborne. Signed on 2003-09-28. Completion date: 2003-12-19.
$85,787 with Army for Installation of Equipment -- Automatic Data Processing Equipment (Including Firmware), Software, Supplies and Support Equipment. Signed on 2002-08-20. Completion date: 2002-11-15.
$82,466 with Air Force for Video Recording and Reproducing Equipment. Signed on 2001-09-12. Completion date: 2001-10-31.
$80,841 with Army for Radio and Television Communication Equipment, Except Airborne. Signed on 2003-09-29. Completion date: 2003-12-19.
A TOUCH OF CHRISTMAS (14500 CUTTEN RD in HOUSTON, TX; small business)
$8,925 with Army for Miscellaneous Items. Signed on 2003-09-29. Completion date: 2003-11-14.
Top industries in this zip code by the number of employees in 2005:
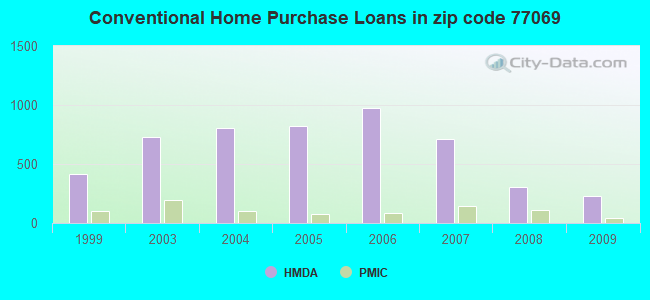
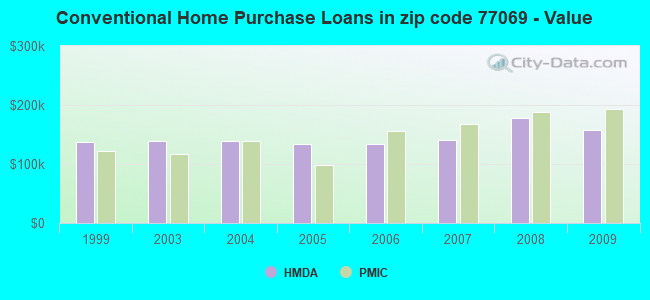
Detailed PMIC statistics for the following Tracts:5528.00
, 5529.00
2003 - 2018 National Fire Incident Reporting System (NFIRS) incidents
Based on the data from the years 2003 - 2018 the average number of fire incidents per year is 42. The highest number of reported fires - 72 took place in 2016, and the least - 6 in 2003. The data has an increasing trend.
When looking into fire subcategories, the most reports belonged to: Structure Fires (57.1%), and Outside Fires (26.2%).
Fire incident types reported to NFIRS in Zip Code 77069


 Nearest zip codes: 77066, 77070, 77068, 77379, 77014, 77064.
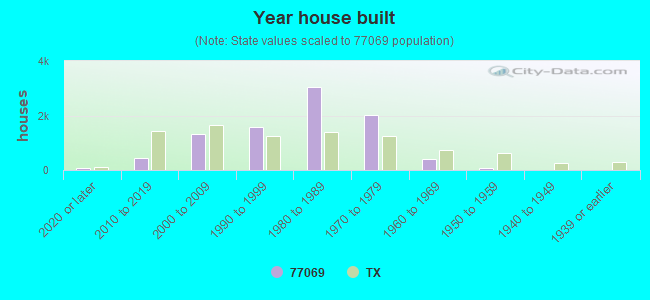


 Based on the data from the years 2003 - 2018 the average number of fire incidents per year is 42. The highest number of reported fires - 72 took place in 2016, and the least - 6 in 2003. The data has an increasing trend.
 When looking into fire subcategories, the most reports belonged to: Structure Fires (57.1%), and Outside Fires (26.2%).