Estimated zip code population in 2022: 11,758 Zip code population in 2010: 10,064 Zip code population in 2000: 9,505
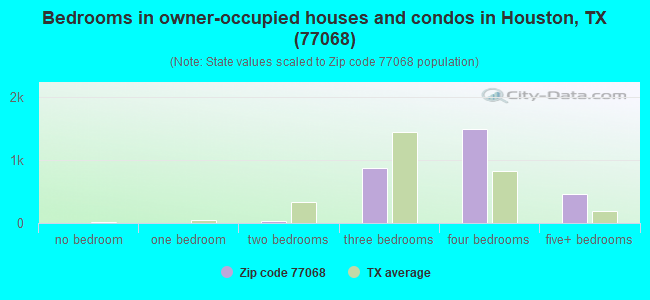
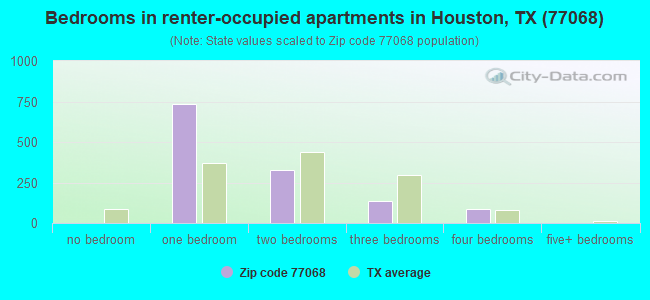
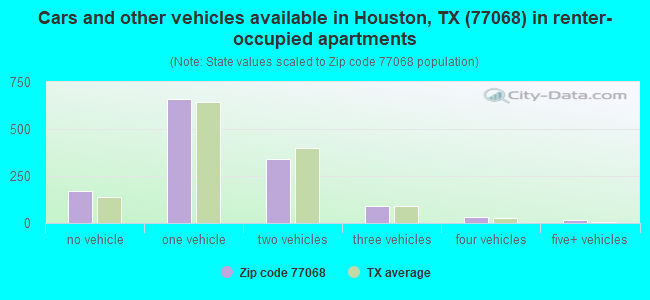
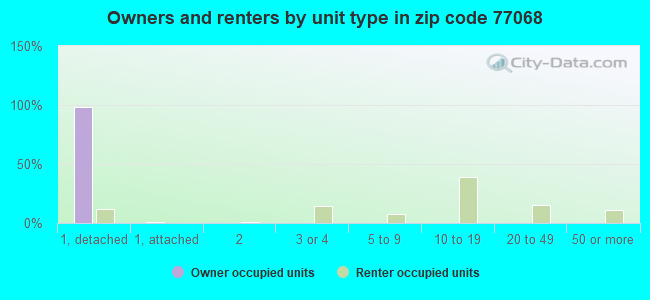
Houses and condos: 4,538 Renter-occupied apartments: 1,300
% of renters here:
31%
State:
38%
March 2022 cost of living index in zip code 77068: 96.5 (near average, U.S. average is 100)
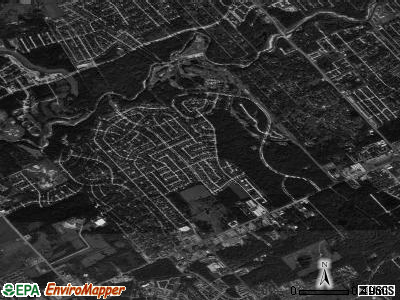
Land area: 3.8 sq. mi. Water area: 0.1 sq. mi.
Population density: 3,091 people per square mile
(average).
OSM Map
General Map
Google Map
MSN Map
OSM Map
General Map
Google Map
MSN Map
OSM Map
General Map
Google Map
MSN Map
OSM Map
General Map
Google Map
MSN Map
Please wait while loading the map...
Real estate property taxes paid for housing units in 2022:
This zip code:
1.5% ($4,922)
Texas:
1.5% ($4,050)
Median real estate property taxes paid for housing units with mortgages in 2022: $4,949 (1.5%) Median real estate property taxes paid for housing units with no mortgage in 2022: $5,010 (1.6%)
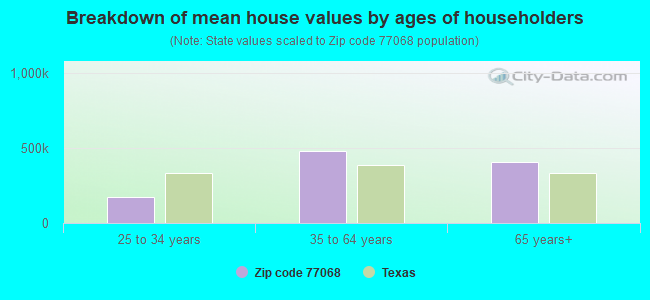
Estimated median house/condo value in 2022: $318,909
77068:
$318,909
Texas:
$275,400
According to our research of Texas and other state lists, there were 32 registered sex offenders living in 77068 zip code as of May 17, 2024. The ratio of all residents to sex offenders in zip code 77068 is 362 to 1. The ratio of registered sex offenders to all residents in this zip code is near the state average.
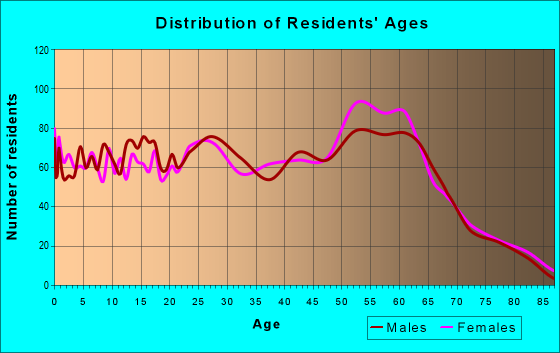
Median resident age:
This zip code:
35.6 years
Texas median age:
35.6 years
Average household size:
This zip code:
2.8 people
Texas:
2.6 people
Averages for the 2020 tax year for zip code 77068, filed in 2021:
Average Adjusted Gross Income (AGI) in 2020: $66,306 (Individual Income Tax Returns)
Here:
$66,306
State:
$77,054
Salary/wage: $53,607 (reported on 79.0% of returns)
Here:
$53,607
State:
$62,766
(% of AGI for various income ranges: 1175.7% for AGIs below $25k, 3609.3% for AGIs $25k-50k, 6500.2% for AGIs $50k-75k, 9910.0% for AGIs $75k-100k, 16646.1% for AGIs $100k-200k, 70436.2% for AGIs over 200k)
Taxable interest for individuals: $3,050 (reported on 19.8% of returns)
This zip code:
$3,050
Texas:
$2,665
(% of AGI for various income ranges: 8.2% for AGIs below $25k, 25.6% for AGIs $25k-50k, 56.6% for AGIs $50k-75k, 121.7% for AGIs $75k-100k, 188.7% for AGIs $100k-200k, 2131.2% for AGIs over 200k)
Ordinary dividends: $14,699 (reported on 14.5% of returns)
Here:
$14,699
State:
$10,044
(% of AGI for various income ranges: 15.3% for AGIs below $25k, 41.1% for AGIs $25k-50k, 76.4% for AGIs $50k-75k, 148.6% for AGIs $75k-100k, 568.7% for AGIs $100k-200k, 10906.2% for AGIs over 200k)
Net capital gain/loss in AGI: +$21,944 (reported on 15.4% of returns)
Here:
+$21,944
State:
+$39,590
(% of AGI for various income ranges: 2.5% for AGIs below $25k, 22.4% for AGIs $25k-50k, 85.0% for AGIs $50k-75k, 270.3% for AGIs $75k-100k, 690.0% for AGIs $100k-200k, 19436.2% for AGIs over 200k)
Profit/loss from business: +$8,616 (reported on 27.5% of returns)
Here:
+$8,616
State:
+$10,888
(% of AGI for various income ranges: 155.7% for AGIs below $25k, 100.3% for AGIs $25k-50k, 182.6% for AGIs $50k-75k, 384.8% for AGIs $75k-100k, 840.0% for AGIs $100k-200k, 5906.2% for AGIs over 200k)
Taxable individual retirement arrangement distribution: $32,553 (reported on 7.7% of returns)
77068:
$32,553
Texas:
$24,740
(% of AGI for various income ranges: 29.2% for AGIs below $25k, 68.6% for AGIs $25k-50k, 159.8% for AGIs $50k-75k, 506.2% for AGIs $75k-100k, 1394.5% for AGIs $100k-200k, 7086.2% for AGIs over 200k)
Total itemized deductions: $36,581 (reported on 9.2% of returns)
Here:
$36,581
State:
$40,428
(% of AGI for various income ranges: 43.5% for AGIs below $25k, 168.5% for AGIs $25k-50k, 474.5% for AGIs $50k-75k, 852.1% for AGIs $75k-100k, 1297.9% for AGIs $100k-200k, 8641.2% for AGIs over 200k)
Charity contributions: $13,131 (reported on 7.2% of returns)
Here:
$13,131
State:
$18,201
(% of AGI for various income ranges: 42.4% for AGIs $25k-50k, 77.1% for AGIs $50k-75k, 217.2% for AGIs $75k-100k, 387.6% for AGIs $100k-200k, 3091.2% for AGIs over 200k)
Taxes paid: $7,325 (reported on 8.7% of returns)
77068:
$7,325
State:
$7,821
(% of AGI for various income ranges: 11.1% for AGIs below $25k, 40.7% for AGIs $25k-50k, 114.3% for AGIs $50k-75k, 170.3% for AGIs $75k-100k, 274.7% for AGIs $100k-200k, 1095.0% for AGIs over 200k)
Earned income credit: $2,566 (reported on 23.2% of returns)
Here:
$2,566
State:
$2,584
(% of AGI for various income ranges: 146.2% for AGIs below $25k, 89.1% for AGIs $25k-50k)
Percentage of individuals using paid preparers for their 2020 taxes: 89.6%
Here:
90%
State:
92%
(% for various income ranges: 88.9% for AGIs below $25k, 91.0% for AGIs $25k-50k, 89.9% for AGIs $50k-75k, 89.1% for AGIs $75k-100k, 89.9% for AGIs $100k-200k, 86.7% for AGIs over 200k)
Averages for the 2012 tax year for zip code 77068, filed in 2013:
Average Adjusted Gross Income (AGI) in 2012: $75,287 (Individual Income Tax Returns)
Here:
$75,287
State:
$65,384
Salary/wage: $60,191 (reported on 83.3% of returns)
Here:
$60,191
State:
$52,524
(% of AGI for various income ranges: 77.6% for AGIs below $25k, 84.3% for AGIs $25k-50k, 77.2% for AGIs $50k-75k, 72.0% for AGIs $75k-100k, 74.2% for AGIs $100k-200k, 51.3% for AGIs over 200k)
Taxable interest for individuals: $3,141 (reported on 28.0% of returns)
This zip code:
$3,141
Texas:
$2,372
(% of AGI for various income ranges: 1.0% for AGIs below $25k, 0.7% for AGIs $25k-50k, 1.6% for AGIs $50k-75k, 0.9% for AGIs $75k-100k, 0.6% for AGIs $100k-200k, 1.7% for AGIs over 200k)
Ordinary dividends: $8,903 (reported on 20.0% of returns)
Here:
$8,903
State:
$9,721
(% of AGI for various income ranges: 1.9% for AGIs below $25k, 1.3% for AGIs $25k-50k, 1.6% for AGIs $50k-75k, 1.7% for AGIs $75k-100k, 2.1% for AGIs $100k-200k, 3.2% for AGIs over 200k)
Net capital gain/loss in AGI: +$27,958 (reported on 16.7% of returns)
Here:
+$27,958
State:
+$35,319
(% of AGI for various income ranges: 0.1% for AGIs $25k-50k, 0.4% for AGIs $50k-75k, 0.9% for AGIs $75k-100k, 0.8% for AGIs $100k-200k, 15.1% for AGIs over 200k)
Profit/loss from business: +$15,285 (reported on 22.3% of returns)
Here:
+$15,285
State:
+$13,732
(% of AGI for various income ranges: 12.1% for AGIs below $25k, 2.4% for AGIs $25k-50k, 3.4% for AGIs $50k-75k, 2.3% for AGIs $75k-100k, 3.8% for AGIs $100k-200k, 5.1% for AGIs over 200k)
Taxable individual retirement arrangement distribution: $29,662 (reported on 9.7% of returns)
77068:
$29,662
Texas:
$19,511
(% of AGI for various income ranges: 2.0% for AGIs below $25k, 2.8% for AGIs $25k-50k, 3.6% for AGIs $50k-75k, 3.5% for AGIs $75k-100k, 4.8% for AGIs $100k-200k, 3.9% for AGIs over 200k)
Self-employment retirement plans: $20,650 (reported on 0.8% of returns)
77068:
$20,650
Texas:
$23,938
(% of AGI for various income ranges: 0.8% for AGIs below $25k, 0.4% for AGIs over 200k)
Total itemized deductions: $26,098 (17% of AGI, reported on 32.4% of returns)
Here:
$26,098
State:
$24,724
Here:
17.2% of AGI
State:
15.9% of AGI
(% of AGI for various income ranges: 9.0% for AGIs below $25k, 9.9% for AGIs $25k-50k, 15.9% for AGIs $50k-75k, 14.9% for AGIs $75k-100k, 11.4% for AGIs $100k-200k, 9.8% for AGIs over 200k)
Charity contributions: $7,007 (reported on 26.2% of returns)
Here:
$7,007
State:
$6,808
(% of AGI for various income ranges: 0.8% for AGIs below $25k, 1.4% for AGIs $25k-50k, 2.6% for AGIs $50k-75k, 3.1% for AGIs $75k-100k, 2.5% for AGIs $100k-200k, 2.7% for AGIs over 200k)
Taxes paid: $7,329 (reported on 31.7% of returns)
77068:
$7,329
State:
$6,921
(% of AGI for various income ranges: 2.1% for AGIs below $25k, 2.3% for AGIs $25k-50k, 4.3% for AGIs $50k-75k, 3.8% for AGIs $75k-100k, 3.6% for AGIs $100k-200k, 2.7% for AGIs over 200k)
Earned income credit: $2,451 (reported on 20.0% of returns)
Here:
$2,451
State:
$2,570
(% of AGI for various income ranges: 8.2% for AGIs below $25k, 1.1% for AGIs $25k-50k)
Percentage of individuals using paid preparers for their 2012 taxes: 51.3%
Here:
51%
State:
51%
(% for various income ranges: 53.5% for AGIs below $25k, 48.6% for AGIs $25k-50k, 47.5% for AGIs $50k-75k, 48.8% for AGIs $75k-100k, 47.1% for AGIs $100k-200k, 65.6% for AGIs over 200k)
Averages for the 2004 tax year for zip code 77068, filed in 2005:
Average Adjusted Gross Income (AGI) in 2004: $73,702 (Individual Income Tax Returns)
Here:
$73,702
State:
$47,881
Salary/wage: $65,683 (reported on 83.3% of returns)
Here:
$65,683
State:
$41,947
(% of AGI for various income ranges: 149.5% for AGIs below $10k, 81.3% for AGIs $10k-25k, 83.1% for AGIs $25k-50k, 76.9% for AGIs $50k-75k, 75.7% for AGIs $75k-100k, 71.2% for AGIs over 100k)
Taxable interest for individuals: $3,601 (reported on 45.1% of returns)
This zip code:
$3,601
Texas:
$2,255
(% of AGI for various income ranges: 10.8% for AGIs below $10k, 2.4% for AGIs $10k-25k, 1.4% for AGIs $25k-50k, 1.7% for AGIs $50k-75k, 1.5% for AGIs $75k-100k, 2.4% for AGIs over 100k)
Taxable dividends: $4,464 (reported on 30.6% of returns)
Here:
$4,464
State:
$4,261
(% of AGI for various income ranges: 6.8% for AGIs below $10k, 1.2% for AGIs $10k-25k, 1.4% for AGIs $25k-50k, 1.3% for AGIs $50k-75k, 1.4% for AGIs $75k-100k, 2.1% for AGIs over 100k)
Net capital gain/loss: +$13,622 (reported on 27.2% of returns)
Here:
+$13,622
State:
+$16,110
(% of AGI for various income ranges: -1.1% for AGIs below $10k, -0.1% for AGIs $10k-25k, 0.8% for AGIs $25k-50k, 0.1% for AGIs $50k-75k, 1.9% for AGIs $75k-100k, 7.3% for AGIs over 100k)
Profit/loss from business: +$20,077 (reported on 23.2% of returns)
Here:
+$20,077
State:
+$11,013
(% of AGI for various income ranges: 14.9% for AGIs below $10k, 6.1% for AGIs $10k-25k, 5.3% for AGIs $25k-50k, 3.8% for AGIs $50k-75k, 6.0% for AGIs $75k-100k, 6.8% for AGIs over 100k)
IRA payment deduction: $3,692 (reported on 3.3% of returns)
77068:
$3,692
Texas:
$3,120
(% of AGI for various income ranges: 0.4% for AGIs $10k-25k, 0.2% for AGIs $25k-50k, 0.2% for AGIs $50k-75k, 0.3% for AGIs $75k-100k, 0.1% for AGIs over 100k)
Self-employed pension: $18,347 (reported on 1.7% of returns)
Here:
$18,347
Texas:
$16,401
Total itemized deductions: $22,594 (19% of AGI, reported on 41.2% of returns)
Here:
$22,594
State:
$19,631
Here:
19.3% of AGI
State:
18.9% of AGI
(% of AGI for various income ranges: 21.0% for AGIs below $10k, 15.4% for AGIs $10k-25k, 17.7% for AGIs $25k-50k, 18.5% for AGIs $50k-75k, 16.1% for AGIs $75k-100k, 10.2% for AGIs over 100k)
Charity contributions deductions: $5,759 (5% of AGI, reported on 35.0% of returns)
Here:
$5,759
State:
$4,753
Here:
4.6% of AGI
State:
4.2% of AGI
(% of AGI for various income ranges: 1.2% for AGIs below $10k, 1.4% for AGIs $10k-25k, 2.3% for AGIs $25k-50k, 2.7% for AGIs $50k-75k, 2.8% for AGIs $75k-100k, 2.9% for AGIs over 100k)
Total tax: $16,356 (reported on 76.6% of returns)
77068:
$16,356
State:
$9,058
(% of AGI for various income ranges: 7.4% for AGIs below $10k, 4.1% for AGIs $10k-25k, 6.9% for AGIs $25k-50k, 8.9% for AGIs $50k-75k, 11.1% for AGIs $75k-100k, 21.6% for AGIs over 100k)
Earned income credit: $1,847 (reported on 13.7% of returns)
Here:
$1,847
State:
$2,024
Percentage of individuals using paid preparers for their 2004 taxes: 54.3%
Here:
54%
State:
57%
(% for various income ranges: 48.1% for AGIs below $10k, 59.6% for AGIs $10k-25k, 57.7% for AGIs $25k-50k, 53.9% for AGIs $50k-75k, 49.6% for AGIs $75k-100k, 54.3% for AGIs over 100k)
Likely homosexual households (counted as self-reported same-sex unmarried-partner households)
Lesbian couples: 0.4% of all households
Gay men: 1.5% of all households
Household received Food Stamps/SNAP in the past 12 months: 346 Household did not receive Food Stamps/SNAP in the past 12 months: 3,789
Women who had a birth in the past 12 months: 126 (88 now married, 37 unmarried) Women who did not have a birth in the past 12 months: 2,945 (1,108 now married, 1,843 unmarried)
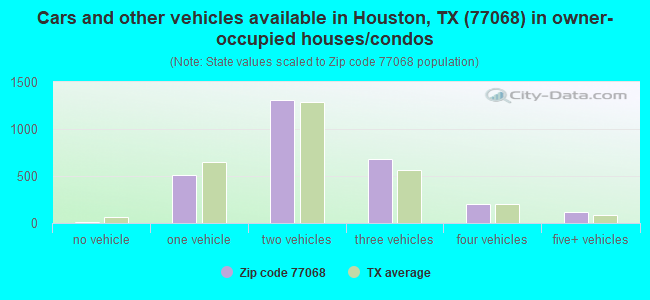
Housing units in zip code 77068 with a mortgage: 1,858 (52 second mortgage, 14 both second mortgage and home equity loan) Houses without a mortgage: 15
Median monthly owner costs for units with a mortgage: $2,049 Median monthly owner costs for units without a mortgage: $1,051
Residents with income below the poverty level in 2022:
This zip code:
8.7%
Whole state:
14.0%
Residents with income below 50% of the poverty level in 2022:
This zip code:
6.5%
Whole state:
7.4%
Median number of rooms in houses and condos:
Here:
7.9
State:
6.3
Median number of rooms in apartments:
Here:
3.6
State:
4.0
Notable locations in this zip code not listed on our city pages
Churches in zip code 77068 include: Houston District Church of the Nazarene (A), Bethesda Lutheran Home Church (B), Cornerstone Bible Fellowship Church (C), Bammel Road Church of Christ (D). Display/hide their locations on the map
In group quarters: 39 (-1 institutionalized population)
Size of family households: 1,257 2-persons, 672 3-persons, 483 4-persons, 310 5-persons, 101 6-persons, 143 7-or-more-persons
Size of nonfamily households: 902 1-person, 264 2-persons, 10 4-persons
1,244 married couples with children.
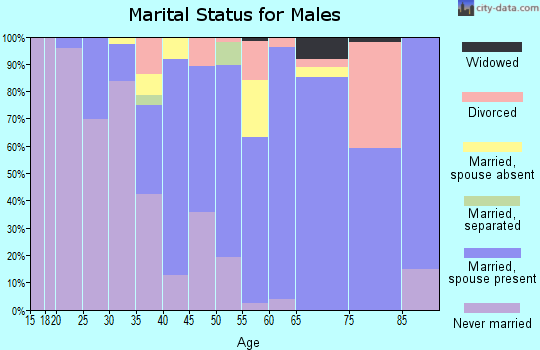
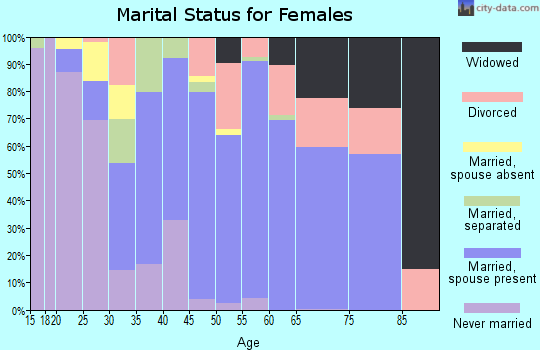
690 single-parent households (510 men, 180 women).
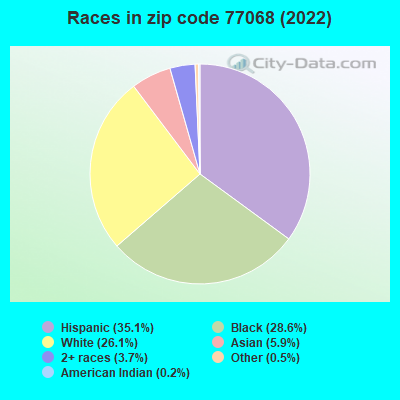
65.2% of residents of 77068 zip code speak English at home.
28.4% of residents speak Spanish at home (62% very well, 15% well, 5% not well, 19% not at all).
1.4% of residents speak other Indo-European language at home (78% very well, 22% well).
4.4% of residents speak Asian or Pacific Island language at home (43% very well, 31% well, 23% not well, 3% not at all).
1.1% of residents speak other language at home (14% very well, 80% well, 6% not well).
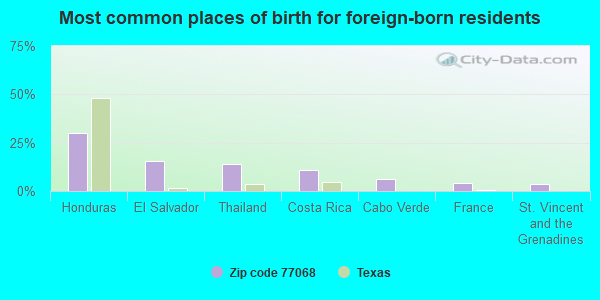
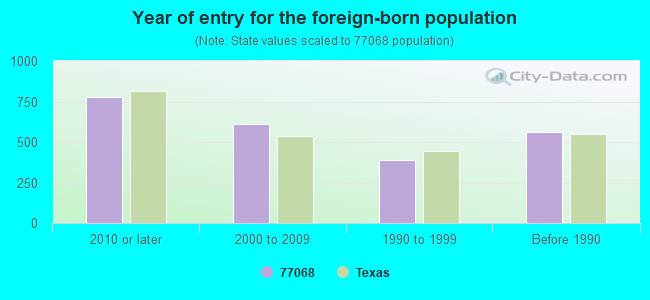
Foreign born population: 2,076 (17.7%) (40.0% of them are naturalized citizens)
Facilities with environmental interests located in this zip code:
AMERICAN TIRE & AUTOMOTIVE (16924 KUYKENDAHL in HOUSTON, TX)
AIR MINOR (AIRS/AFS) Business SIC classification: GENERAL AUTOMOTIVE REPAIR SHOPS
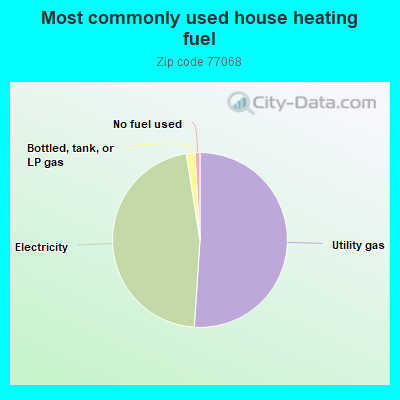
Housing units lacking complete plumbing facilities: 0.5% Housing units lacking complete kitchen facilities: 0.4%
51.1%Utility gas
46.5%Electricity
1.6%Bottled, tank, or LP gas
0.9%No fuel used
Population in 1990: 7,670. Population change in the 1990s: +1,835 (+23.9%).
Place of birth for U.S.-born residents:
This state: 6,062
Northeast: 624
Midwest: 915
South: 1,402
West: 405
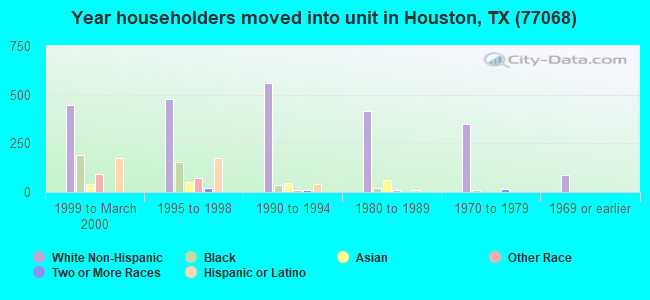
57% of the 77068 zip code residents lived in the same house 5 years ago. Out of people who lived in different houses, 68% lived in this county. Out of people who lived in different counties, 50% lived in Texas.
91% of the 77068 zip code residents lived in the same house 1 year ago. Out of people who lived in different houses, 67% moved from this county. Out of people who lived in different houses, 5% moved from different county within same state. Out of people who lived in different houses, 27% moved from different state.
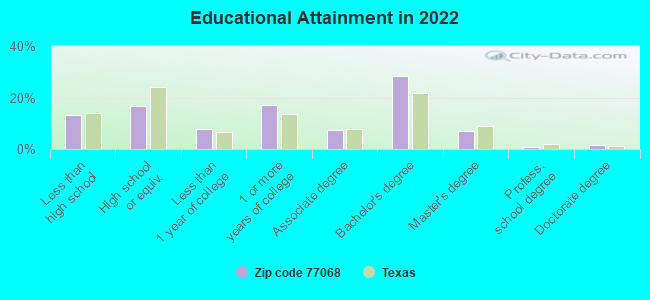
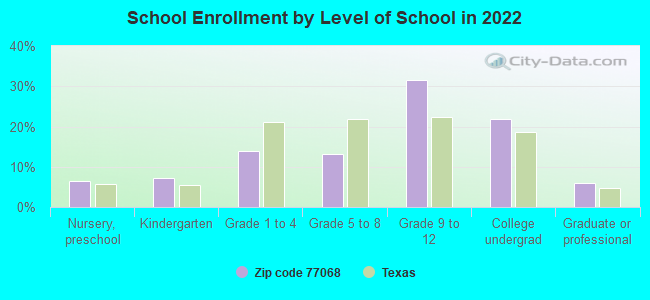
Private vs. public school enrollment:
Students in private schools in grades 1 to 8 (elementary and middle school): 34
Here:
5.6%
Texas:
8.8%
Students in private schools in grades 9 to 12 (high school): 39
Here:
5.4%
Texas:
8.0%
Students in private undergraduate colleges: 99
Here:
19.6%
Texas:
16.2%
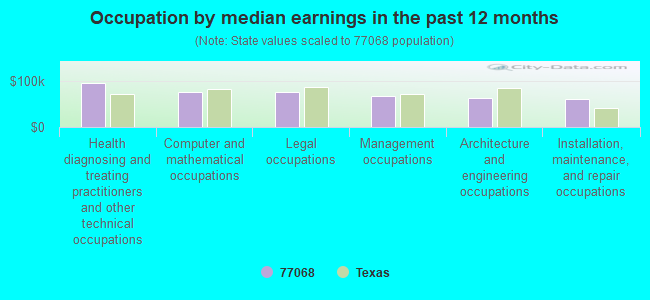
Occupation by median earnings in the past 12 months ($)
95,235Health diagnosing and treating practitioners and other technical occupations
75,474Computer and mathematical occupations
75,016Legal occupations
67,048Management occupations
62,620Architecture and engineering occupations
61,546Installation, maintenance, and repair occupations
Companies with federal contracts located in this zip code:
G&N ENTERPRISES, INC (3827 GLADERIDGE DRIVE in HOUSTON, TX; small business) : $887,339 in 8 contractsfrom 2000 to 2002
Contracts for Construction of Structures and Facilities -- Other Conservation and Development Facilities, Maintenance, Repair or Alteration of Real Property -- Dams, Maintenance, Repair or Alteration of Real Property -- Waste Treatment and Storage Facilities, Maintenance, Repair or Alteration of Real Property -- Miscellaneous Buildings, and moreby U.S. Army Corps of Engineers - civil program financing only, Army Signed by year:2000: $879,163; 2001: $0; 2002: $8,176; 2003: $0; 2004: $0; 2005: $0; 2006: $0.
Biggest contracts:
$493,740 with U.S. Army Corps of Engineers - civil program financing only for Construction of Structures and Facilities -- Other Conservation and Development Facilities. Signed on 2000-02-28. Completion date: 2000-08-23.
$140,940 with Army for Maintenance, Repair or Alteration of Real Property -- Dams. Signed on 2000-03-09. Completion date: 2000-04-28.
$120,708 with U.S. Army Corps of Engineers - civil program financing only for Construction of Structures and Facilities -- Other Conservation and Development Facilities. Signed on 2000-09-20. Completion date: 2000-08-23.
$59,000 with U.S. Army Corps of Engineers - civil program financing only for Maintenance, Repair or Alteration of Real Property -- Waste Treatment and Storage Facilities. Signed on 2000-06-13. Completion date: 2000-07-13.
TEMPORARY WAREHOUSE STRUCTURES (4202 CANTERWOOD DR in HOUSTON, TX; small business) : $549,500 in 2 contractsin 2003
$487,500 with Air Force for Prefabricated and Portable Buildings. Signed on 2003-09-02. Completion date: 2003-11-14.
$62,000 with Navy for Prefabricated and Portable Buildings. Signed on 2003-04-15. Completion date: 2003-05-09.
JOHNSON, ARTEKA (3850 GLADERIDGE DR in HOUSTON, TX; small business) : $428,694 in 36 contractsfrom 2002 to 2006
Contracts for Office Furniture, ADP Components, Miscellaneous Office Machines, Dental Instruments, Equipment, and Supplies, and moreby Air Force, Federal Technology Service, Army, Office of the Chief Financial Officer, and others Signed by year:2000: $0; 2001: $0; 2002: $52,987; 2003: $138,546; 2004: $102,888; 2005: $76,504; 2006: $57,769.
Biggest contracts:
$77,275 with Air Force for Office Furniture. Signed on 2003-09-30. Completion date: 2003-10-30.
$40,341 with Federal Technology Service for ADP Components. Signed on 2002-10-15. Completion date: 2002-12-15.
$35,400 with Army for Miscellaneous Office Machines. Signed on 2006-02-22. Completion date: 2006-03-23.
$31,712 with Army for Dental Instruments, Equipment, and Supplies. Signed on 2004-09-15. Completion date: 2004-10-29.
Top industries in this zip code by the number of employees in 2005:
Other Services (except Public Administration): Car Washes (100-249 employees: 1 establishment, 50-99 employees: 1 establishment, 20-49 employees: 2 establishments, 1-4 employees: 1 establishment)
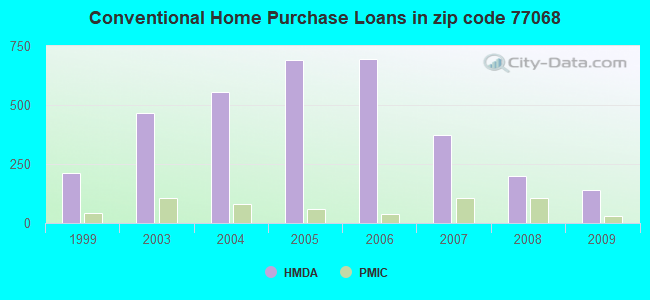
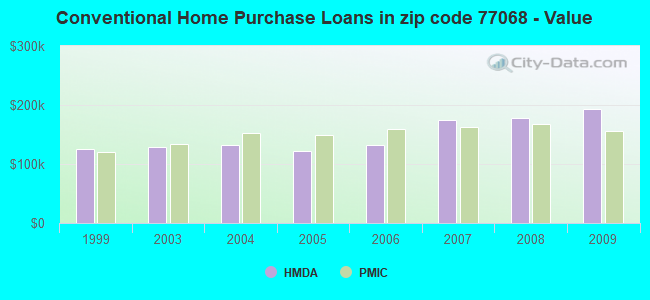
Detailed PMIC statistics for the following Tracts:5530.00
, 5531.00
2003 - 2018 National Fire Incident Reporting System (NFIRS) incidents
Based on the data from the years 2003 - 2018 the average number of fire incidents per year is 39. The highest number of reported fires - 79 took place in 2011, and the least - 4 in 2003. The data has an increasing trend.
When looking into fire subcategories, the most reports belonged to: Structure Fires (50.8%), and Outside Fires (32.3%).
Fire incident types reported to NFIRS in Zip Code 77068


 Nearest zip codes: 77014, 77069, 77090, 77066, 77379, 77388.


 Based on the data from the years 2003 - 2018 the average number of fire incidents per year is 39. The highest number of reported fires - 79 took place in 2011, and the least - 4 in 2003. The data has an increasing trend.
 When looking into fire subcategories, the most reports belonged to: Structure Fires (50.8%), and Outside Fires (32.3%).