Estimated zip code population in 2022: 68,612 Zip code population in 2010: 36,407 Zip code population in 2000: 13,706
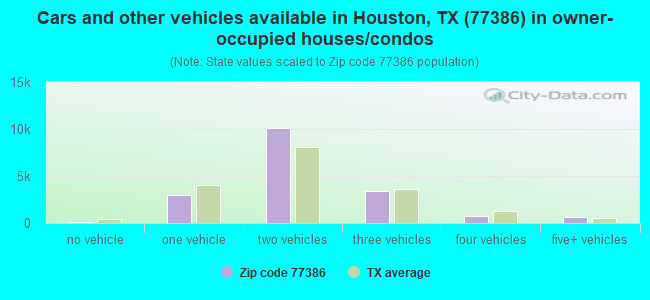
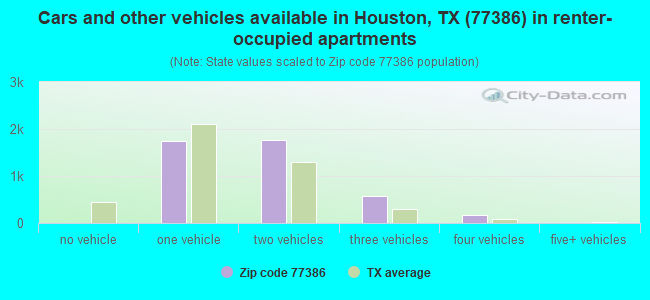
Houses and condos: 22,776 Renter-occupied apartments: 4,304
% of renters here:
19%
State:
38%
March 2022 cost of living index in zip code 77386: 97.1 (near average, U.S. average is 100)
Land area: 40.3 sq. mi. Water area: 0.8 sq. mi.
Population density: 1,704 people per square mile
(low).
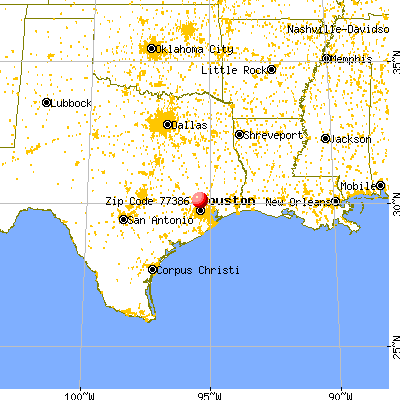
OSM Map
General Map
Google Map
MSN Map
OSM Map
General Map
Google Map
MSN Map
OSM Map
General Map
Google Map
MSN Map
OSM Map
General Map
Google Map
MSN Map
Please wait while loading the map...
Real estate property taxes paid for housing units in 2022:
This zip code:
1.9% ($6,760)
Texas:
1.5% ($4,050)
Median real estate property taxes paid for housing units with mortgages in 2022: $6,980 (1.9%) Median real estate property taxes paid for housing units with no mortgage in 2022: $6,284 (1.9%)
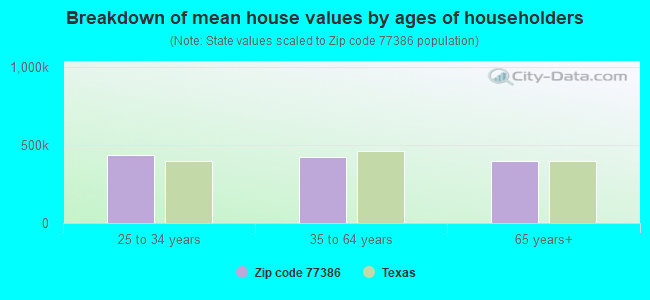
Estimated median house/condo value in 2022: $360,913
77386:
$360,913
Texas:
$275,400
According to our research of Texas and other state lists, there were 45 registered sex offenders living in 77386 zip code as of May 20, 2024. The ratio of all residents to sex offenders in zip code 77386 is 1,129 to 1. The ratio of registered sex offenders to all residents in this zip code is much lower than the state average.
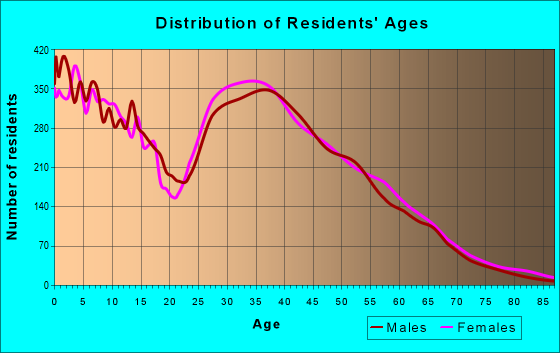
Median resident age:
This zip code:
34.2 years
Texas median age:
35.6 years
Average household size:
This zip code:
3.1 people
Texas:
2.6 people
Averages for the 2020 tax year for zip code 77386, filed in 2021:
Average Adjusted Gross Income (AGI) in 2020: $109,967 (Individual Income Tax Returns)
Here:
$109,967
State:
$77,054
Salary/wage: $99,651 (reported on 87.8% of returns)
Here:
$99,651
State:
$62,766
(% of AGI for various income ranges: 1159.0% for AGIs below $25k, 3549.8% for AGIs $25k-50k, 6535.8% for AGIs $50k-75k, 9677.9% for AGIs $75k-100k, 18307.4% for AGIs $100k-200k, 68704.8% for AGIs over 200k)
Taxable interest for individuals: $1,370 (reported on 27.8% of returns)
This zip code:
$1,370
Texas:
$2,665
(% of AGI for various income ranges: 11.6% for AGIs below $25k, 16.0% for AGIs $25k-50k, 23.2% for AGIs $50k-75k, 26.8% for AGIs $75k-100k, 65.7% for AGIs $100k-200k, 347.6% for AGIs over 200k)
Ordinary dividends: $5,397 (reported on 21.8% of returns)
Here:
$5,397
State:
$10,044
(% of AGI for various income ranges: 18.0% for AGIs below $25k, 30.3% for AGIs $25k-50k, 53.5% for AGIs $50k-75k, 80.9% for AGIs $75k-100k, 137.9% for AGIs $100k-200k, 1403.2% for AGIs over 200k)
Net capital gain/loss in AGI: +$19,554 (reported on 21.2% of returns)
Here:
+$19,554
State:
+$39,590
(% of AGI for various income ranges: 8.9% for AGIs below $25k, 24.0% for AGIs $25k-50k, 67.0% for AGIs $50k-75k, 93.2% for AGIs $75k-100k, 246.8% for AGIs $100k-200k, 6506.4% for AGIs over 200k)
Profit/loss from business: +$10,298 (reported on 21.7% of returns)
Here:
+$10,298
State:
+$10,888
(% of AGI for various income ranges: 98.3% for AGIs below $25k, 116.1% for AGIs $25k-50k, 225.7% for AGIs $50k-75k, 220.2% for AGIs $75k-100k, 405.5% for AGIs $100k-200k, 1581.2% for AGIs over 200k)
Taxable individual retirement arrangement distribution: $29,528 (reported on 7.0% of returns)
77386:
$29,528
Texas:
$24,740
(% of AGI for various income ranges: 40.5% for AGIs below $25k, 83.7% for AGIs $25k-50k, 114.3% for AGIs $50k-75k, 252.1% for AGIs $75k-100k, 460.7% for AGIs $100k-200k, 1525.6% for AGIs over 200k)
Self-employed (Keogh) retirement plans: $29,071 (reported on 0.6% of returns)
77386:
$29,071
Texas:
$29,298
(% of AGI for various income ranges: 18.0% for AGIs $100k-200k, 263.1% for AGIs over 200k)
Total itemized deductions: $35,013 (reported on 15.7% of returns)
Here:
$35,013
State:
$40,428
(% of AGI for various income ranges: 47.5% for AGIs below $25k, 181.2% for AGIs $25k-50k, 392.6% for AGIs $50k-75k, 623.5% for AGIs $75k-100k, 1044.9% for AGIs $100k-200k, 4792.9% for AGIs over 200k)
Charity contributions: $13,313 (reported on 13.0% of returns)
Here:
$13,313
State:
$18,201
(% of AGI for various income ranges: 4.6% for AGIs below $25k, 32.2% for AGIs $25k-50k, 82.5% for AGIs $50k-75k, 133.7% for AGIs $75k-100k, 295.7% for AGIs $100k-200k, 1876.8% for AGIs over 200k)
Taxes paid: $8,694 (reported on 15.4% of returns)
77386:
$8,694
State:
$7,821
(% of AGI for various income ranges: 12.6% for AGIs below $25k, 44.6% for AGIs $25k-50k, 106.1% for AGIs $50k-75k, 172.5% for AGIs $75k-100k, 288.0% for AGIs $100k-200k, 1027.1% for AGIs over 200k)
Earned income credit: $2,420 (reported on 11.4% of returns)
Here:
$2,420
State:
$2,584
(% of AGI for various income ranges: 93.7% for AGIs below $25k, 75.4% for AGIs $25k-50k, 1.1% for AGIs $50k-75k)
Percentage of individuals using paid preparers for their 2020 taxes: 93.1%
Here:
93%
State:
92%
(% for various income ranges: 91.3% for AGIs below $25k, 93.0% for AGIs $25k-50k, 93.5% for AGIs $50k-75k, 93.0% for AGIs $75k-100k, 94.1% for AGIs $100k-200k, 94.6% for AGIs over 200k)
Averages for the 2012 tax year for zip code 77386, filed in 2013:
Average Adjusted Gross Income (AGI) in 2012: $88,705 (Individual Income Tax Returns)
Here:
$88,705
State:
$65,384
Salary/wage: $79,107 (reported on 91.1% of returns)
Here:
$79,107
State:
$52,524
(% of AGI for various income ranges: 85.2% for AGIs below $25k, 87.8% for AGIs $25k-50k, 88.6% for AGIs $50k-75k, 88.4% for AGIs $75k-100k, 89.9% for AGIs $100k-200k, 66.7% for AGIs over 200k)
Taxable interest for individuals: $960 (reported on 30.1% of returns)
This zip code:
$960
Texas:
$2,372
(% of AGI for various income ranges: 0.6% for AGIs below $25k, 0.4% for AGIs $25k-50k, 0.3% for AGIs $50k-75k, 0.4% for AGIs $75k-100k, 0.3% for AGIs $100k-200k, 0.3% for AGIs over 200k)
Ordinary dividends: $3,903 (reported on 17.6% of returns)
Here:
$3,903
State:
$9,721
(% of AGI for various income ranges: 1.3% for AGIs below $25k, 0.7% for AGIs $25k-50k, 0.4% for AGIs $50k-75k, 0.4% for AGIs $75k-100k, 0.4% for AGIs $100k-200k, 1.3% for AGIs over 200k)
Net capital gain/loss in AGI: +$29,625 (reported on 14.6% of returns)
Here:
+$29,625
State:
+$35,319
(% of AGI for various income ranges: 0.1% for AGIs $25k-50k, 0.2% for AGIs $50k-75k, 0.2% for AGIs $75k-100k, 0.4% for AGIs $100k-200k, 13.5% for AGIs over 200k)
Profit/loss from business: +$13,645 (reported on 17.7% of returns)
Here:
+$13,645
State:
+$13,732
(% of AGI for various income ranges: 7.2% for AGIs below $25k, 2.9% for AGIs $25k-50k, 2.3% for AGIs $50k-75k, 2.4% for AGIs $75k-100k, 2.2% for AGIs $100k-200k, 2.9% for AGIs over 200k)
Taxable individual retirement arrangement distribution: $18,222 (reported on 6.7% of returns)
77386:
$18,222
Texas:
$19,511
(% of AGI for various income ranges: 2.2% for AGIs below $25k, 1.6% for AGIs $25k-50k, 1.6% for AGIs $50k-75k, 1.5% for AGIs $75k-100k, 1.5% for AGIs $100k-200k, 1.0% for AGIs over 200k)
Self-employment retirement plans: $21,140 (reported on 0.5% of returns)
77386:
$21,140
Texas:
$23,938
(% of AGI for various income ranges: 0.1% for AGIs $25k-50k, 0.2% for AGIs over 200k)
Total itemized deductions: $22,629 (16% of AGI, reported on 46.1% of returns)
Here:
$22,629
State:
$24,724
Here:
16.0% of AGI
State:
15.9% of AGI
(% of AGI for various income ranges: 10.7% for AGIs below $25k, 14.1% for AGIs $25k-50k, 14.5% for AGIs $50k-75k, 14.4% for AGIs $75k-100k, 13.7% for AGIs $100k-200k, 7.8% for AGIs over 200k)
Charity contributions: $4,641 (reported on 36.2% of returns)
Here:
$4,641
State:
$6,808
(% of AGI for various income ranges: 0.8% for AGIs below $25k, 1.5% for AGIs $25k-50k, 1.7% for AGIs $50k-75k, 1.9% for AGIs $75k-100k, 2.1% for AGIs $100k-200k, 1.9% for AGIs over 200k)
Taxes paid: $7,286 (reported on 45.5% of returns)
77386:
$7,286
State:
$6,921
(% of AGI for various income ranges: 2.5% for AGIs below $25k, 3.5% for AGIs $25k-50k, 4.0% for AGIs $50k-75k, 4.3% for AGIs $75k-100k, 4.7% for AGIs $100k-200k, 2.8% for AGIs over 200k)
Earned income credit: $2,229 (reported on 12.1% of returns)
Here:
$2,229
State:
$2,570
(% of AGI for various income ranges: 6.1% for AGIs below $25k, 1.1% for AGIs $25k-50k)
Percentage of individuals using paid preparers for their 2012 taxes: 41.6%
Here:
42%
State:
51%
(% for various income ranges: 39.3% for AGIs below $25k, 40.8% for AGIs $25k-50k, 38.6% for AGIs $50k-75k, 40.2% for AGIs $75k-100k, 41.8% for AGIs $100k-200k, 60.1% for AGIs over 200k)
Averages for the 2004 tax year for zip code 77386, filed in 2005:
Average Adjusted Gross Income (AGI) in 2004: $55,591 (Individual Income Tax Returns)
Here:
$55,591
State:
$47,881
Salary/wage: $53,494 (reported on 90.8% of returns)
Here:
$53,494
State:
$41,947
(% of AGI for various income ranges: 126.5% for AGIs below $10k, 80.3% for AGIs $10k-25k, 89.0% for AGIs $25k-50k, 89.4% for AGIs $50k-75k, 92.0% for AGIs $75k-100k, 83.0% for AGIs over 100k)
Taxable interest for individuals: $886 (reported on 38.4% of returns)
This zip code:
$886
Texas:
$2,255
(% of AGI for various income ranges: 3.3% for AGIs below $10k, 1.4% for AGIs $10k-25k, 0.7% for AGIs $25k-50k, 0.6% for AGIs $50k-75k, 0.4% for AGIs $75k-100k, 0.5% for AGIs over 100k)
Taxable dividends: $1,286 (reported on 18.8% of returns)
Here:
$1,286
State:
$4,261
(% of AGI for various income ranges: 2.5% for AGIs below $10k, 0.7% for AGIs $10k-25k, 0.6% for AGIs $25k-50k, 0.3% for AGIs $50k-75k, 0.3% for AGIs $75k-100k, 0.5% for AGIs over 100k)
Net capital gain/loss: +$4,985 (reported on 16.4% of returns)
Here:
+$4,985
State:
+$16,110
(% of AGI for various income ranges: -1.8% for AGIs below $10k, 0.2% for AGIs $10k-25k, 0.4% for AGIs $25k-50k, 0.5% for AGIs $50k-75k, 0.5% for AGIs $75k-100k, 3.2% for AGIs over 100k)
Profit/loss from business: +$9,504 (reported on 19.0% of returns)
Here:
+$9,504
State:
+$11,013
(% of AGI for various income ranges: 10.5% for AGIs below $10k, 8.8% for AGIs $10k-25k, 2.8% for AGIs $25k-50k, 2.8% for AGIs $50k-75k, 1.8% for AGIs $75k-100k, 3.5% for AGIs over 100k)
IRA payment deduction: $3,315 (reported on 2.3% of returns)
77386:
$3,315
Texas:
$3,120
(% of AGI for various income ranges: 0.3% for AGIs $10k-25k, 0.2% for AGIs $25k-50k, 0.2% for AGIs $50k-75k, 0.1% for AGIs $75k-100k, 0.1% for AGIs over 100k)
Self-employed pension: $11,972 (reported on 0.4% of returns)
Here:
$11,972
Texas:
$16,401
Total itemized deductions: $17,173 (21% of AGI, reported on 45.1% of returns)
Here:
$17,173
State:
$19,631
Here:
20.7% of AGI
State:
18.9% of AGI
(% of AGI for various income ranges: 13.2% for AGIs below $10k, 12.0% for AGIs $10k-25k, 14.5% for AGIs $25k-50k, 16.1% for AGIs $50k-75k, 15.3% for AGIs $75k-100k, 12.1% for AGIs over 100k)
Charity contributions deductions: $3,091 (4% of AGI, reported on 37.5% of returns)
Here:
$3,091
State:
$4,753
Here:
3.6% of AGI
State:
4.2% of AGI
(% of AGI for various income ranges: 0.5% for AGIs below $10k, 1.4% for AGIs $10k-25k, 1.8% for AGIs $25k-50k, 2.1% for AGIs $50k-75k, 2.3% for AGIs $75k-100k, 2.2% for AGIs over 100k)
Total tax: $7,935 (reported on 80.0% of returns)
77386:
$7,935
State:
$9,058
(% of AGI for various income ranges: 4.3% for AGIs below $10k, 4.5% for AGIs $10k-25k, 6.5% for AGIs $25k-50k, 8.7% for AGIs $50k-75k, 9.9% for AGIs $75k-100k, 16.8% for AGIs over 100k)
Earned income credit: $1,656 (reported on 10.7% of returns)
Here:
$1,656
State:
$2,024
Percentage of individuals using paid preparers for their 2004 taxes: 43.3%
Here:
43%
State:
57%
(% for various income ranges: 34.6% for AGIs below $10k, 49.2% for AGIs $10k-25k, 44.7% for AGIs $25k-50k, 41.1% for AGIs $50k-75k, 42.6% for AGIs $75k-100k, 47.5% for AGIs over 100k)
Likely homosexual households (counted as self-reported same-sex unmarried-partner households)
Lesbian couples: 0.4% of all households
Gay men: 0.2% of all households
Household received Food Stamps/SNAP in the past 12 months: 709 Household did not receive Food Stamps/SNAP in the past 12 months: 21,454
Women who had a birth in the past 12 months: 1,367 (1,192 now married, 189 unmarried) Women who did not have a birth in the past 12 months: 16,565 (10,039 now married, 6,439 unmarried)
Housing units in zip code 77386 with a mortgage: 14,802 (752 second mortgage, 279 both second mortgage and home equity loan) Median monthly owner costs for units with a mortgage: $2,204 Median monthly owner costs for units without a mortgage: $846
Residents with income below the poverty level in 2022:
This zip code:
6.2%
Whole state:
14.0%
Residents with income below 50% of the poverty level in 2022:
This zip code:
3.2%
Whole state:
7.4%
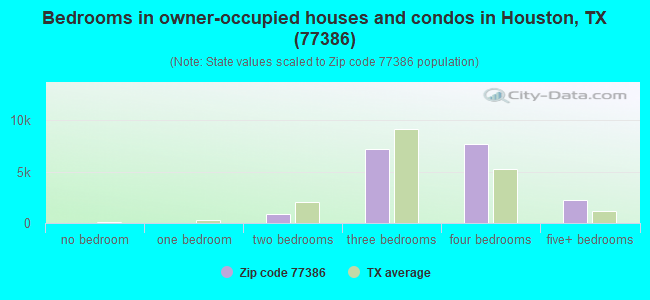
Median number of rooms in houses and condos:
Here:
7.5
State:
6.3
Median number of rooms in apartments:
Here:
4.7
State:
4.0
Notable locations in this zip code not listed on our city pages
Notable location: South Montgomery County Volunteer Fire Department and Emergency Medical Services - Station 11 - 2 (A). Display/hide its location on the map
Churches in zip code 77386 include: Alana Lane Baptist Church (A), Gateway Baptist Church (B), Woodland Heights Baptist Church (C), Spring Creek Baptist Church (D), Faith Bible Fellowship Church (E). Display/hide their locations on the map
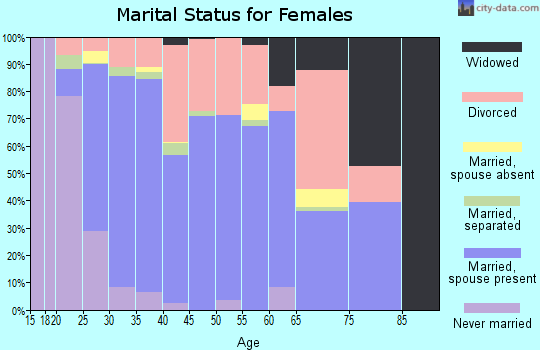
18,405 married couples with children.
2,265 single-parent households (820 men, 1,445 women).
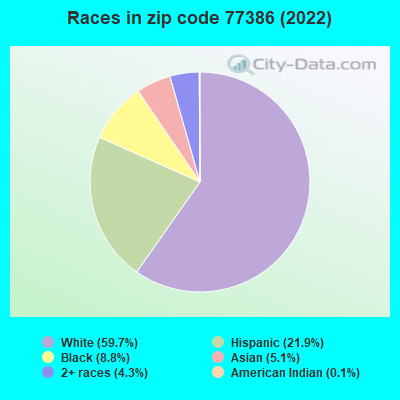
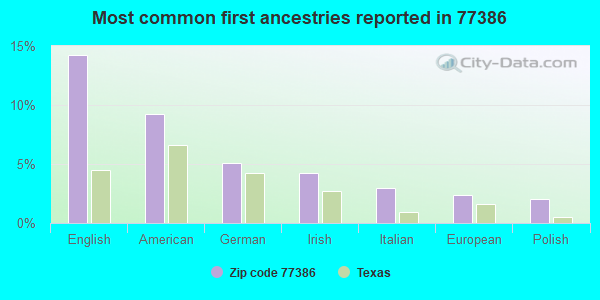
78.1% of residents of 77386 zip code speak English at home.
13.8% of residents speak Spanish at home (68% very well, 12% well, 15% not well, 5% not at all).
3.5% of residents speak other Indo-European language at home (97% very well, 2% well).
3.3% of residents speak Asian or Pacific Island language at home (71% very well, 27% well, 1% not well, 1% not at all).
1.3% of residents speak other language at home (92% very well, 6% well, 3% not at all).
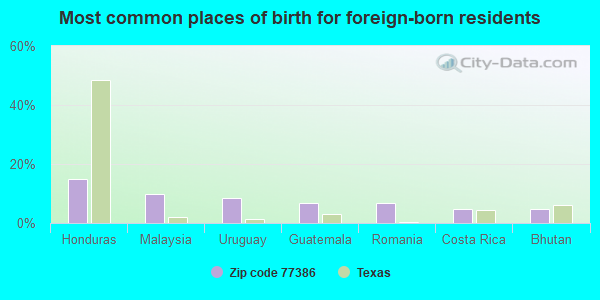
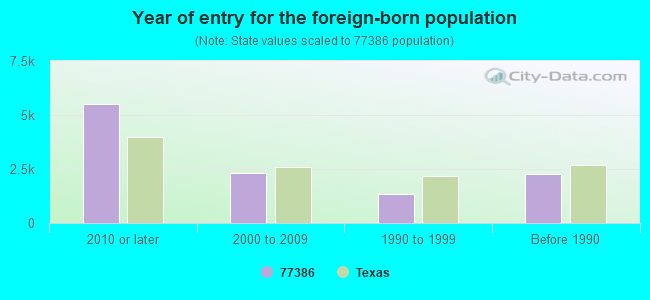
Foreign born population: 9,284 (13.5%) (57.7% of them are naturalized citizens)
Facilities with environmental interests located in this zip code:
A D FORD EL (25460 RICHARD RD in SPRING, TX)
(National Center for Education Statistics) - STATE ID-170902112 Organizations: CONROE ISD (SCHOOL DISTRICT)
Housing units lacking complete plumbing facilities: 0.5% Housing units lacking complete kitchen facilities: 1.4%
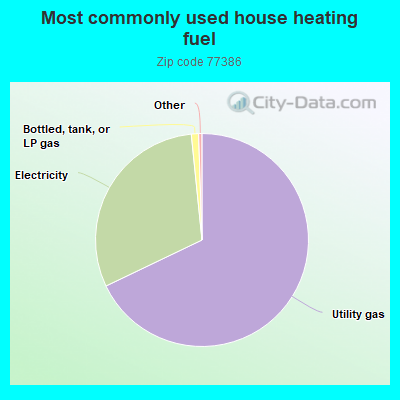
67.9%Utility gas
30.5%Electricity
1.1%Bottled, tank, or LP gas
Population in 1990: 8,379. Population change in the 1990s: +5,327 (+63.6%).
Place of birth for U.S.-born residents:
This state: 34,635
Northeast: 3,532
Midwest: 5,348
South: 8,040
West: 6,215
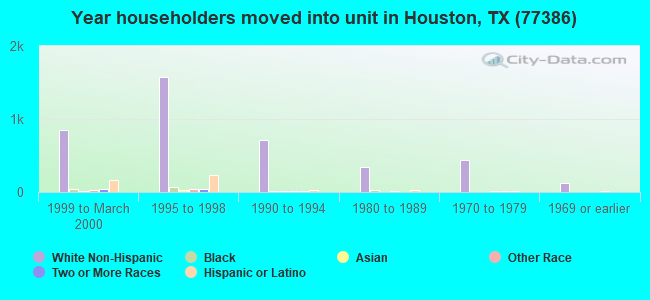
44% of the 77386 zip code residents lived in the same house 5 years ago. Out of people who lived in different houses, 37% lived in this county. Out of people who lived in different counties, 50% lived in Texas.
85% of the 77386 zip code residents lived in the same house 1 year ago. Out of people who lived in different houses, 35% moved from this county. Out of people who lived in different houses, 49% moved from different county within same state. Out of people who lived in different houses, 15% moved from different state. Out of people who lived in different houses, 2% moved from abroad.
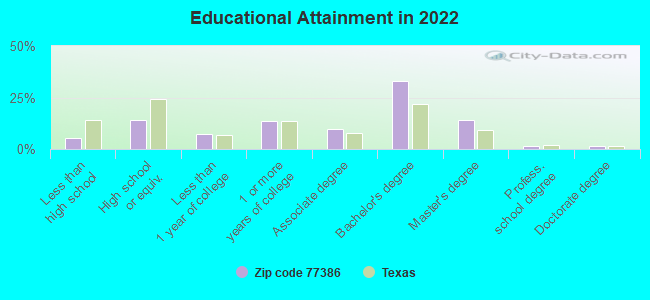
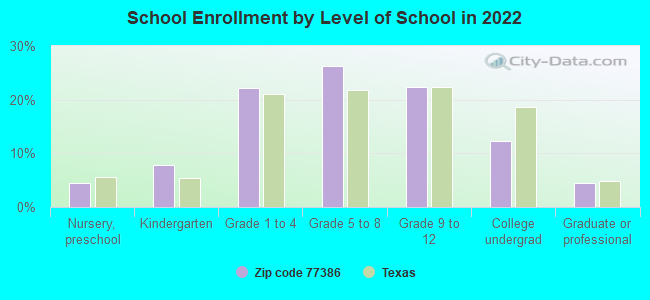
Private vs. public school enrollment:
Students in private schools in grades 1 to 8 (elementary and middle school): 1,372
Here:
13.5%
Texas:
8.8%
Students in private schools in grades 9 to 12 (high school): 596
Here:
12.7%
Texas:
8.0%
Students in private undergraduate colleges: 500
Here:
19.3%
Texas:
16.2%
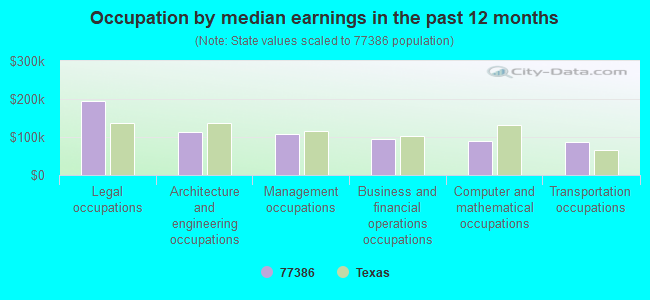
Occupation by median earnings in the past 12 months ($)
195,632Legal occupations
113,748Architecture and engineering occupations
109,092Management occupations
94,815Business and financial operations occupations
89,641Computer and mathematical occupations
85,937Transportation occupations
Companies with federal contracts located in this zip code:
AIRDALE EXPRESS, LLC (502 STARKSTONE CT in SPRING, TX; small business) : $6,253,537 in 187 contractsfrom 2002 to 2006
Contracts for Miscellaneous Battery Retaining Fixtures and Liners, Vehicular Furniture and Accessories, Airframe Structural Components, Vehicular Brake, Steering, Axle, Wheel, and Track Components, and moreby Defense Logistics Agency, Army, Navy Signed by year:2000: $0; 2001: $0; 2002: $170,170; 2003: $293,391; 2004: $800,445; 2005: $4,654,758; 2006: $334,773.
Biggest contracts:
$677,880 with Defense Logistics Agency for Miscellaneous Battery Retaining Fixtures and Liners. Signed on 2005-09-28. Completion date: 2005-12-12.
$267,422 with Defense Logistics Agency for Vehicular Furniture and Accessories. Signed on 2005-04-12. Completion date: 2005-06-14.
$229,416, same as above.Signed on 2005-06-30. Completion date: 2005-10-28.
$221,724 with Defense Logistics Agency for Airframe Structural Components. Signed on 2005-11-09. Completion date: 2006-04-10.
COLONIAL HARDWARE CORPORATION (25700 I-45 NORTH in SPRING, TX; small business) : $70,955 in 8 contractsfrom 2002 to 2006
Contracts for Hand Tools, Power Driven, Hand Tools, Nonedged, Nonpowered, Taps, Dies, and Collets; Hand and Machine, Hand Tools, Edged, Nonpowered, and moreby Army, Federal Supply Service Signed by year:2000: $0; 2001: $0; 2002: $13,878; 2003: $30,206; 2004: $3,952; 2005: $18,841; 2006: $4,078.
Biggest contracts:
$26,400 with Army for Hand Tools, Power Driven. Signed on 2003-09-04. Completion date: 2003-09-18.
$18,841 with Army for Hand Tools, Nonedged, Nonpowered. Signed on 2005-04-21. Completion date: 2005-06-10.
$13,878, same as above.Signed on 2002-03-27. Completion date: 2002-05-31.
$4,074 with Federal Supply Service for Taps, Dies, and Collets; Hand and Machine. Signed on 2006-08-11. Completion date: 2006-09-13.
DUNN'S VALVE TESTERS INC (1827 RILEY FUZZELL RD # 2 in SPRING, TX; small business)
$5,400 with Navy for Miscellaneous Maintenance and Repair Shop Specialized Equipment. Signed on 2004-11-10. Completion date: 2005-01-09.
Top industries in this zip code by the number of employees in 2005:
2002 - 2018 National Fire Incident Reporting System (NFIRS) incidents
According to the data from the years 2002 - 2018 the average number of fire incidents per year is 62. The highest number of fires - 100 took place in 2018, and the least - 24 in 2010. The data has an increasing trend.
When looking into fire subcategories, the most incidents belonged to: Outside Fires (43.5%), and Structure Fires (39.2%).
Fire incident types reported to NFIRS in Zip Code 77386


 Nearest zip codes: 77373, 77365, 77385, 77338, 77073, 77032.
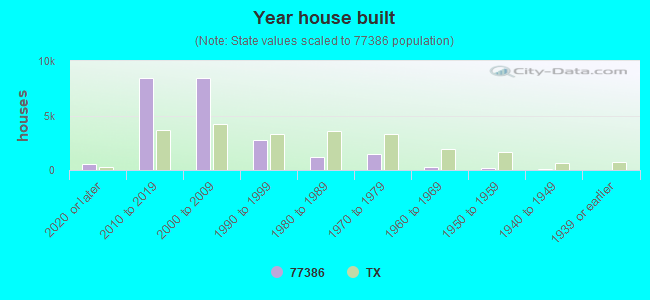


 According to the data from the years 2002 - 2018 the average number of fire incidents per year is 62. The highest number of fires - 100 took place in 2018, and the least - 24 in 2010. The data has an increasing trend.
 When looking into fire subcategories, the most incidents belonged to: Outside Fires (43.5%), and Structure Fires (39.2%).