Estimated zip code population in 2022: 66,570 Zip code population in 2010: 54,609 Zip code population in 2000: 36,388
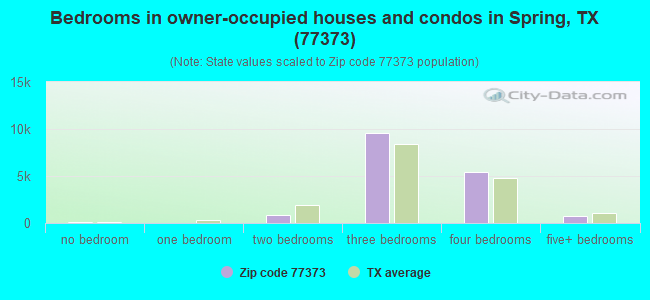
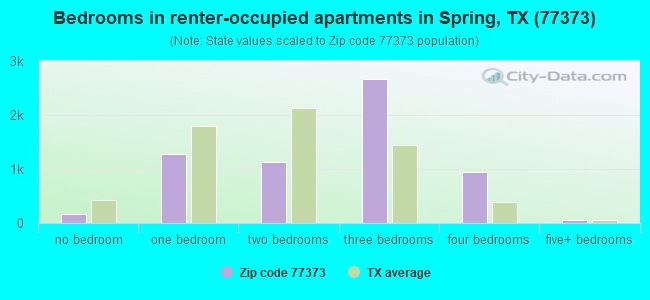
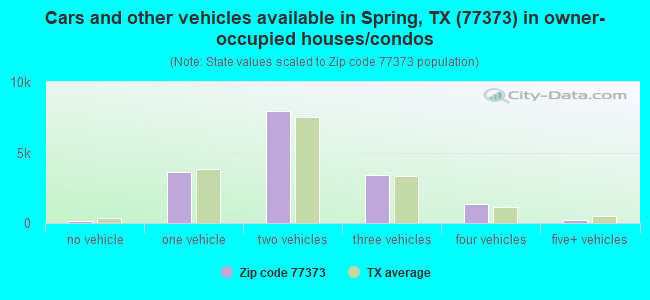
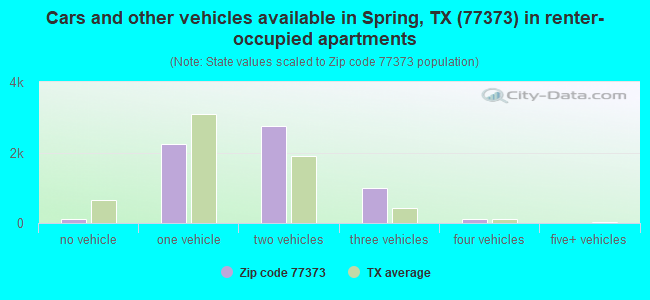
Houses and condos: 23,734 Renter-occupied apartments: 6,301
% of renters here:
27%
State:
38%
March 2022 cost of living index in zip code 77373: 96.5 (near average, U.S. average is 100)
Land area: 23.7 sq. mi. Water area: 0.4 sq. mi.
Population density: 2,804 people per square mile
(average).
OSM Map
General Map
Google Map
MSN Map
OSM Map
General Map
Google Map
MSN Map
OSM Map
General Map
Google Map
MSN Map
OSM Map
General Map
Google Map
MSN Map
Please wait while loading the map...
Real estate property taxes paid for housing units in 2022:
This zip code:
1.7% ($3,937)
Texas:
1.5% ($4,050)
Median real estate property taxes paid for housing units with mortgages in 2022: $4,200 (1.7%) Median real estate property taxes paid for housing units with no mortgage in 2022: $3,562 (1.7%)
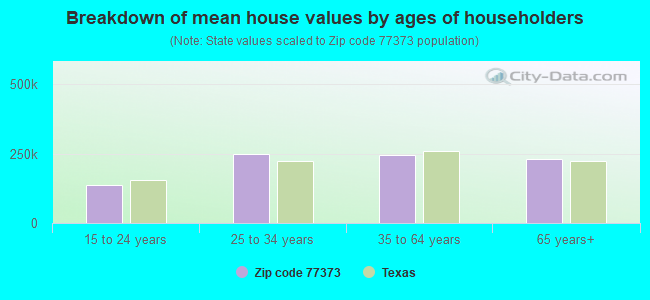
Estimated median house/condo value in 2022: $229,461
77373:
$229,461
Texas:
$275,400
According to our research of Texas and other state lists, there were 163 registered sex offenders living in 77373 zip code as of May 17, 2024. The ratio of all residents to sex offenders in zip code 77373 is 369 to 1. The ratio of registered sex offenders to all residents in this zip code is near the state average.
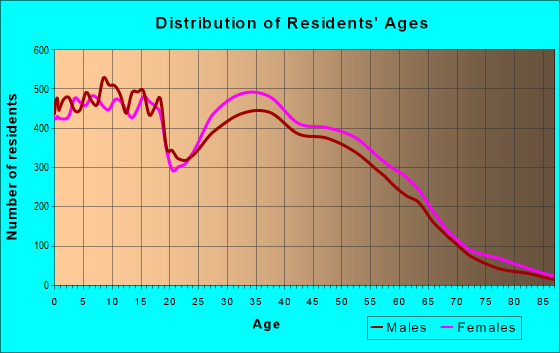
Median resident age:
This zip code:
33.4 years
Texas median age:
35.6 years
Average household size:
This zip code:
2.9 people
Texas:
2.6 people
Averages for the 2020 tax year for zip code 77373, filed in 2021:
Average Adjusted Gross Income (AGI) in 2020: $51,456 (Individual Income Tax Returns)
Here:
$51,456
State:
$77,054
Salary/wage: $48,001 (reported on 85.7% of returns)
Here:
$48,001
State:
$62,766
(% of AGI for various income ranges: 1218.3% for AGIs below $25k, 3618.1% for AGIs $25k-50k, 6635.5% for AGIs $50k-75k, 9536.3% for AGIs $75k-100k, 16384.7% for AGIs $100k-200k, 52563.5% for AGIs over 200k)
Taxable interest for individuals: $1,077 (reported on 12.4% of returns)
This zip code:
$1,077
Texas:
$2,665
(% of AGI for various income ranges: 3.8% for AGIs below $25k, 5.5% for AGIs $25k-50k, 10.9% for AGIs $50k-75k, 26.7% for AGIs $75k-100k, 51.1% for AGIs $100k-200k, 782.9% for AGIs over 200k)
Ordinary dividends: $2,966 (reported on 7.4% of returns)
Here:
$2,966
State:
$10,044
(% of AGI for various income ranges: 6.0% for AGIs below $25k, 7.8% for AGIs $25k-50k, 17.5% for AGIs $50k-75k, 34.1% for AGIs $75k-100k, 96.8% for AGIs $100k-200k, 1319.4% for AGIs over 200k)
Net capital gain/loss in AGI: +$12,588 (reported on 7.0% of returns)
Here:
+$12,588
State:
+$39,590
(% of AGI for various income ranges: 4.0% for AGIs below $25k, 8.4% for AGIs $25k-50k, 22.9% for AGIs $50k-75k, 68.8% for AGIs $75k-100k, 174.4% for AGIs $100k-200k, 11981.8% for AGIs over 200k)
Profit/loss from business: +$2,951 (reported on 23.9% of returns)
Here:
+$2,951
State:
+$10,888
(% of AGI for various income ranges: 73.8% for AGIs below $25k, 21.2% for AGIs $25k-50k, 53.9% for AGIs $50k-75k, 105.6% for AGIs $75k-100k, 224.9% for AGIs $100k-200k, 2790.0% for AGIs over 200k)
Taxable individual retirement arrangement distribution: $18,621 (reported on 4.6% of returns)
77373:
$18,621
Texas:
$24,740
(% of AGI for various income ranges: 25.7% for AGIs below $25k, 40.9% for AGIs $25k-50k, 93.5% for AGIs $50k-75k, 197.9% for AGIs $75k-100k, 504.3% for AGIs $100k-200k, 1856.5% for AGIs over 200k)
Self-employed (Keogh) retirement plans: $28,950 (reported on 0.1% of returns)
77373:
$28,950
Texas:
$29,298
(% of AGI for various income ranges: 29.1% for AGIs $100k-200k)
Total itemized deductions: $28,700 (reported on 6.9% of returns)
Here:
$28,700
State:
$40,428
(% of AGI for various income ranges: 36.5% for AGIs below $25k, 154.2% for AGIs $25k-50k, 383.7% for AGIs $50k-75k, 537.2% for AGIs $75k-100k, 715.1% for AGIs $100k-200k, 3097.1% for AGIs over 200k)
Charity contributions: $10,148 (reported on 5.4% of returns)
Here:
$10,148
State:
$18,201
(% of AGI for various income ranges: 4.8% for AGIs below $25k, 36.4% for AGIs $25k-50k, 91.2% for AGIs $50k-75k, 137.9% for AGIs $75k-100k, 225.7% for AGIs $100k-200k, 1591.2% for AGIs over 200k)
Taxes paid: $6,869 (reported on 6.5% of returns)
77373:
$6,869
State:
$7,821
(% of AGI for various income ranges: 7.7% for AGIs below $25k, 34.6% for AGIs $25k-50k, 86.2% for AGIs $50k-75k, 130.3% for AGIs $75k-100k, 167.2% for AGIs $100k-200k, 490.6% for AGIs over 200k)
Earned income credit: $2,600 (reported on 23.1% of returns)
Here:
$2,600
State:
$2,584
(% of AGI for various income ranges: 135.8% for AGIs below $25k, 89.7% for AGIs $25k-50k, 1.4% for AGIs $50k-75k)
Percentage of individuals using paid preparers for their 2020 taxes: 92.6%
Here:
93%
State:
92%
(% for various income ranges: 91.5% for AGIs below $25k, 93.7% for AGIs $25k-50k, 93.2% for AGIs $50k-75k, 92.8% for AGIs $75k-100k, 92.4% for AGIs $100k-200k, 90.9% for AGIs over 200k)
Averages for the 2012 tax year for zip code 77373, filed in 2013:
Average Adjusted Gross Income (AGI) in 2012: $51,326 (Individual Income Tax Returns)
Here:
$51,326
State:
$65,384
Salary/wage: $48,775 (reported on 89.7% of returns)
Here:
$48,775
State:
$52,524
(% of AGI for various income ranges: 81.6% for AGIs below $25k, 89.7% for AGIs $25k-50k, 89.3% for AGIs $50k-75k, 88.2% for AGIs $75k-100k, 87.4% for AGIs $100k-200k, 61.4% for AGIs over 200k)
Taxable interest for individuals: $983 (reported on 17.9% of returns)
This zip code:
$983
Texas:
$2,372
(% of AGI for various income ranges: 0.4% for AGIs below $25k, 0.2% for AGIs $25k-50k, 0.2% for AGIs $50k-75k, 0.2% for AGIs $75k-100k, 0.3% for AGIs $100k-200k, 1.2% for AGIs over 200k)
Ordinary dividends: $3,235 (reported on 8.8% of returns)
Here:
$3,235
State:
$9,721
(% of AGI for various income ranges: 0.6% for AGIs below $25k, 0.4% for AGIs $25k-50k, 0.3% for AGIs $50k-75k, 0.2% for AGIs $75k-100k, 0.3% for AGIs $100k-200k, 2.5% for AGIs over 200k)
Net capital gain/loss in AGI: +$6,011 (reported on 6.7% of returns)
Here:
+$6,011
State:
+$35,319
(% of AGI for various income ranges: 0.2% for AGIs $50k-75k, 0.2% for AGIs $75k-100k, 0.3% for AGIs $100k-200k, 6.2% for AGIs over 200k)
Profit/loss from business: +$8,152 (reported on 18.1% of returns)
Here:
+$8,152
State:
+$13,732
(% of AGI for various income ranges: 9.6% for AGIs below $25k, 2.3% for AGIs $25k-50k, 1.8% for AGIs $50k-75k, 1.3% for AGIs $75k-100k, 1.6% for AGIs $100k-200k, 6.2% for AGIs over 200k)
Taxable individual retirement arrangement distribution: $15,601 (reported on 5.3% of returns)
77373:
$15,601
Texas:
$19,511
(% of AGI for various income ranges: 1.6% for AGIs below $25k, 1.2% for AGIs $25k-50k, 1.4% for AGIs $50k-75k, 1.7% for AGIs $75k-100k, 1.9% for AGIs $100k-200k, 1.7% for AGIs over 200k)
Self-employment retirement plans: $12,550 (reported on 0.2% of returns)
77373:
$12,550
Texas:
$23,938
Total itemized deductions: $18,711 (22% of AGI, reported on 28.4% of returns)
Here:
$18,711
State:
$24,724
Here:
22.2% of AGI
State:
15.9% of AGI
(% of AGI for various income ranges: 7.1% for AGIs below $25k, 10.8% for AGIs $25k-50k, 12.2% for AGIs $50k-75k, 11.3% for AGIs $75k-100k, 10.4% for AGIs $100k-200k, 7.0% for AGIs over 200k)
Charity contributions: $4,452 (reported on 21.3% of returns)
Here:
$4,452
State:
$6,808
(% of AGI for various income ranges: 0.6% for AGIs below $25k, 1.4% for AGIs $25k-50k, 1.8% for AGIs $50k-75k, 1.9% for AGIs $75k-100k, 2.2% for AGIs $100k-200k, 2.9% for AGIs over 200k)
Taxes paid: $4,799 (reported on 27.6% of returns)
77373:
$4,799
State:
$6,921
(% of AGI for various income ranges: 1.5% for AGIs below $25k, 2.4% for AGIs $25k-50k, 3.0% for AGIs $50k-75k, 2.9% for AGIs $75k-100k, 2.8% for AGIs $100k-200k, 1.9% for AGIs over 200k)
Earned income credit: $2,501 (reported on 22.4% of returns)
Here:
$2,501
State:
$2,570
(% of AGI for various income ranges: 9.3% for AGIs below $25k, 1.5% for AGIs $25k-50k)
Percentage of individuals using paid preparers for their 2012 taxes: 44.6%
Here:
45%
State:
51%
(% for various income ranges: 45.4% for AGIs below $25k, 43.5% for AGIs $25k-50k, 43.5% for AGIs $50k-75k, 44.0% for AGIs $75k-100k, 44.9% for AGIs $100k-200k, 62.9% for AGIs over 200k)
Averages for the 2004 tax year for zip code 77373, filed in 2005:
Average Adjusted Gross Income (AGI) in 2004: $44,946 (Individual Income Tax Returns)
Here:
$44,946
State:
$47,881
Salary/wage: $43,643 (reported on 91.8% of returns)
Here:
$43,643
State:
$41,947
(% of AGI for various income ranges: 100.8% for AGIs below $10k, 84.7% for AGIs $10k-25k, 92.5% for AGIs $25k-50k, 91.7% for AGIs $50k-75k, 92.0% for AGIs $75k-100k, 82.0% for AGIs over 100k)
Taxable interest for individuals: $934 (reported on 27.6% of returns)
This zip code:
$934
Texas:
$2,255
(% of AGI for various income ranges: 1.9% for AGIs below $10k, 0.8% for AGIs $10k-25k, 0.5% for AGIs $25k-50k, 0.4% for AGIs $50k-75k, 0.5% for AGIs $75k-100k, 0.7% for AGIs over 100k)
Taxable dividends: $1,343 (reported on 12.6% of returns)
Here:
$1,343
State:
$4,261
(% of AGI for various income ranges: 1.2% for AGIs below $10k, 0.5% for AGIs $10k-25k, 0.3% for AGIs $25k-50k, 0.2% for AGIs $50k-75k, 0.2% for AGIs $75k-100k, 0.6% for AGIs over 100k)
Net capital gain/loss: +$3,784 (reported on 10.3% of returns)
Here:
+$3,784
State:
+$16,110
(% of AGI for various income ranges: -0.8% for AGIs below $10k, 0.1% for AGIs $10k-25k, 0.1% for AGIs $25k-50k, 0.2% for AGIs $50k-75k, 0.5% for AGIs $75k-100k, 2.8% for AGIs over 100k)
Profit/loss from business: +$7,435 (reported on 16.2% of returns)
Here:
+$7,435
State:
+$11,013
(% of AGI for various income ranges: 9.4% for AGIs below $10k, 7.4% for AGIs $10k-25k, 1.6% for AGIs $25k-50k, 1.6% for AGIs $50k-75k, 2.2% for AGIs $75k-100k, 3.1% for AGIs over 100k)
IRA payment deduction: $2,869 (reported on 1.7% of returns)
77373:
$2,869
Texas:
$3,120
(% of AGI for various income ranges: 0.1% for AGIs $10k-25k, 0.1% for AGIs $25k-50k, 0.1% for AGIs $50k-75k, 0.1% for AGIs $75k-100k, 0.1% for AGIs over 100k)
Self-employed pension: $10,543 (reported on 0.4% of returns)
Here:
$10,543
Texas:
$16,401
(% of AGI for various income ranges: 0.0% for AGIs $25k-50k, 0.0% for AGIs $50k-75k, 0.1% for AGIs $75k-100k, 0.3% for AGIs over 100k)
Total itemized deductions: $16,388 (23% of AGI, reported on 34.3% of returns)
Here:
$16,388
State:
$19,631
Here:
23.4% of AGI
State:
18.9% of AGI
(% of AGI for various income ranges: 9.2% for AGIs below $10k, 8.3% for AGIs $10k-25k, 14.4% for AGIs $25k-50k, 13.5% for AGIs $50k-75k, 12.5% for AGIs $75k-100k, 11.3% for AGIs over 100k)
Charity contributions deductions: $3,101 (4% of AGI, reported on 27.2% of returns)
Here:
$3,101
State:
$4,753
Here:
4.2% of AGI
State:
4.2% of AGI
(% of AGI for various income ranges: 0.4% for AGIs below $10k, 0.8% for AGIs $10k-25k, 1.5% for AGIs $25k-50k, 1.8% for AGIs $50k-75k, 2.0% for AGIs $75k-100k, 2.6% for AGIs over 100k)
Total tax: $5,910 (reported on 76.2% of returns)
77373:
$5,910
State:
$9,058
(% of AGI for various income ranges: 3.3% for AGIs below $10k, 4.2% for AGIs $10k-25k, 6.2% for AGIs $25k-50k, 8.6% for AGIs $50k-75k, 10.5% for AGIs $75k-100k, 16.8% for AGIs over 100k)
Earned income credit: $1,909 (reported on 16.8% of returns)
Here:
$1,909
State:
$2,024
Percentage of individuals using paid preparers for their 2004 taxes: 46.5%
Here:
46%
State:
57%
(% for various income ranges: 39.4% for AGIs below $10k, 53.2% for AGIs $10k-25k, 47.2% for AGIs $25k-50k, 45.5% for AGIs $50k-75k, 44.3% for AGIs $75k-100k, 45.6% for AGIs over 100k)
Likely homosexual households (counted as self-reported same-sex unmarried-partner households)
Lesbian couples: 0.2% of all households
Gay men: 0.0% of all households
Household received Food Stamps/SNAP in the past 12 months: 2,923 Household did not receive Food Stamps/SNAP in the past 12 months: 20,075
Women who had a birth in the past 12 months: 835 (574 now married, 260 unmarried) Women who did not have a birth in the past 12 months: 16,509 (8,134 now married, 8,347 unmarried)
Housing units in zip code 77373 with a mortgage: 11,754 (530 second mortgage, 156 both second mortgage and home equity loan) Houses without a mortgage: 166
Median monthly owner costs for units with a mortgage: $1,698 Median monthly owner costs for units without a mortgage: $680
Residents with income below the poverty level in 2022:
This zip code:
9.4%
Whole state:
14.0%
Residents with income below 50% of the poverty level in 2022:
This zip code:
6.1%
Whole state:
7.4%
Median number of rooms in houses and condos:
Here:
6.4
State:
6.3
Median number of rooms in apartments:
Here:
5.1
State:
4.0
Notable locations in this zip code not listed on our city pages
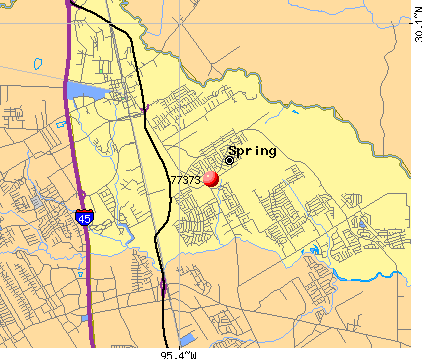
Notable locations in zip code 77373: Spring Volunteer Fire Department Station 71 (A), Spring Volunteer Fire Department Station 73 (B), Spring Volunteer Fire Department Station 74 (C), Wunsche Brothers Saloon and Hotel (D). Display/hide their locations on the map
Churches in zip code 77373 include: Candlestick Baptist Church (A), Cypress Trails United Methodist Church (B), Spring Antioch Baptist Church (C), Holy Comforter Episcopal Church (D), Lexington Woods Church of Christ (E), Tamina Church of Christ (F), Spring Creek Seventh Day Adventist Church (G), North Woods Baptist Church (H), Spring Memorial Baptist Church (I). Display/hide their locations on the map
11,689 married couples with children.
3,065 single-parent households (725 men, 2,340 women).
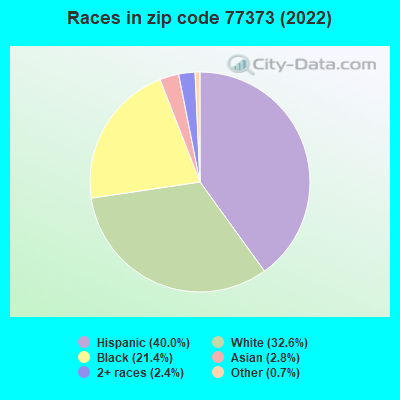
64.1% of residents of 77373 zip code speak English at home.
31.0% of residents speak Spanish at home (67% very well, 19% well, 9% not well, 5% not at all).
1.2% of residents speak other Indo-European language at home (86% very well, 6% well, 5% not well, 3% not at all).
2.2% of residents speak Asian or Pacific Island language at home (67% very well, 20% well, 12% not well).
1.0% of residents speak other language at home (84% very well, 16% well).
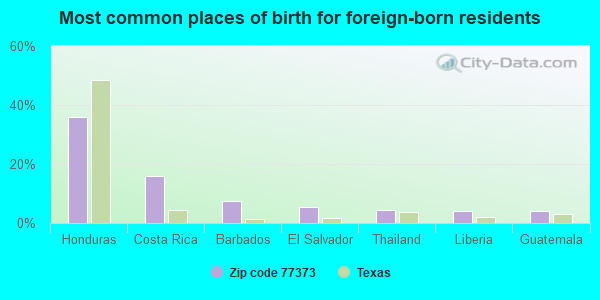
Foreign born population: 10,926 (16.4%) (44.2% of them are naturalized citizens)
Facilities with environmental interests located in this zip code:
ANDERSON EL (6218 LYNNGATE in SPRING, TX)
(National Center for Education Statistics) - STATE ID-101919109 Organizations: SPRING ISD (SCHOOL DISTRICT)
AMERICAN TELEPHONE AND TELEGRAPH COMPANY (19505 N HIGHWAY 75 in SPRING, TX)
(Resource Conservation and Recovery Act (tracking hazardous waste)) Organizations: AMERICAN TELEPHONE AND TELEGRAPH LONG DI (CONTACT/OPERATOR)
Alternative names: AMERICAN TEL & TEL CO LONG LINES
AMISTAD ENVIRONMENTAL (621 SPRING STEUBNER ROAD in SPRING, TX)
National Pollutant Discharge Elimination System NON-MAJOR (Tracking pollutant discharge elimination systems) - permit Business SIC classification: READY-MIXED CONCRETE Organizations: CAMPBELL CONCRETE (CONTACT/OWNER)
, CAMPBELL CONCRETE & (CONTACT/OWNER)
Alternative names: CAMPBELL CONCRETE & MATERIALS,
ALDINE OAKS MHC WWTP (1.25MI W HARDY TOLL RD in SPRING, TX)
National Pollutant Discharge Elimination System NON-MAJOR (Tracking pollutant discharge elimination systems) - permit Business SIC classification: OPERATORS OF RESIDENTIAL MOBILE HOME SITES Organizations: ALI MOHAMMAD SOLHJOU (CONTACT/OWNER)
Alternative names: ALDINE OAKS MOBILE HOME COMM., JOSE JESUS SAMPOGNA, SAMPOGNA, JOSE JESUS
Housing units lacking complete plumbing facilities: 1.1% Housing units lacking complete kitchen facilities: 0.6%
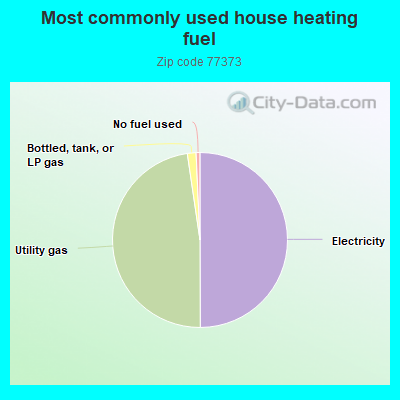
49.8%Electricity
47.6%Utility gas
1.6%Bottled, tank, or LP gas
0.7%No fuel used
Population in 1990: 33,118. Population change in the 1990s: +3,270 (+9.9%).
Place of birth for U.S.-born residents:
This state: 37,555
Northeast: 1,919
Midwest: 4,054
South: 5,796
West: 4,871
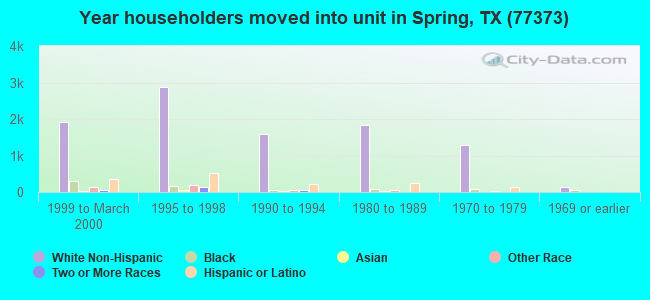
54% of the 77373 zip code residents lived in the same house 5 years ago. Out of people who lived in different houses, 68% lived in this county. Out of people who lived in different counties, 50% lived in Texas.
88% of the 77373 zip code residents lived in the same house 1 year ago. Out of people who lived in different houses, 63% moved from this county. Out of people who lived in different houses, 16% moved from different county within same state. Out of people who lived in different houses, 16% moved from different state. Out of people who lived in different houses, 3% moved from abroad.
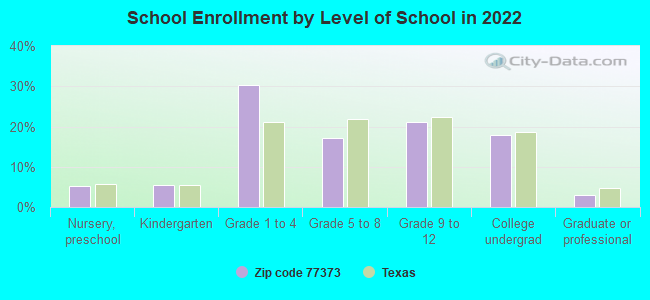
Private vs. public school enrollment:
Students in private schools in grades 1 to 8 (elementary and middle school): 455
Here:
5.8%
Texas:
8.8%
Students in private schools in grades 9 to 12 (high school): 267
Here:
7.5%
Texas:
8.0%
Students in private undergraduate colleges: 617
Here:
20.6%
Texas:
16.2%
Occupation by median earnings in the past 12 months ($)
127,956Legal occupations
77,054Architecture and engineering occupations
72,247Health diagnosing and treating practitioners and other technical occupations
71,247Computer and mathematical occupations
66,072Community and social service occupations
65,088Law enforcement workers including supervisors
Companies with federal contracts located in this zip code (SPRING, TX):
CHAMPIONS MACHINE TOOL SALES I (1151 E CYPRESSWOOD; small business) : $14,887 in 2 contractsfrom 2004 to 2005
$9,800 with Army for Milling Machines. Signed on 2005-11-17. Completion date: 2005-11-28.
$5,087 with Army for Maintenance, Repair and Rebuilding of Equipment -- Maintenance and Repair Shop Equipment. Signed on 2004-10-27. Completion date: 2004-11-30.
INDUSTRIAL INFRA RED INC (23126 BRIARCREEK; small business)
$10,300 with Army for Space and Water Heating Equipment. Signed on 2003-10-24. Completion date: 2003-11-14.
PATRIOT CRANE, INC (22820 INTERSTATE 45 STE 5D; small business) : $7,760 in 2 contractsin 2003
$3,880 with Army for Structural Shapes. Signed on 2003-12-06. Completion date: 2004-01-08.
$3,880 with U.S. Army Corps of Engineers - civil program financing only for Structural Shapes. Signed on 2003-12-06. Completion date: 2004-01-08.
WELDMART-ONLINE (322 POWELL, SUITE 1; small business)
$5,299 with Army for Miscellaneous Machine Tools. Signed on 2003-09-16. Completion date: 2003-09-22.
BLAIR, JACK O CORPORATION (25411 COTTAGE HILL LN; small business)
$4,100 with Air Force for Chain and Wire Rope. Signed on 2005-02-15. Completion date: 2005-02-22.
Top industries in this zip code by the number of employees in 2005:
2002 - 2018 National Fire Incident Reporting System (NFIRS) incidents
According to the data from the years 2002 - 2018 the average number of fire incidents per year is 175. The highest number of fires - 264 took place in 2011, and the least - 117 in 2007. The data has a decreasing trend.
When looking into fire subcategories, the most incidents belonged to: Outside Fires (42.9%), and Structure Fires (37.3%).
Fire incident types reported to NFIRS in Zip Code 77373
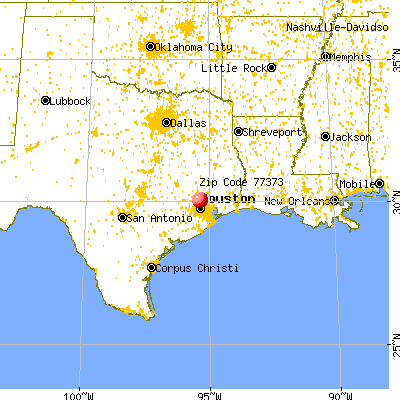


 Nearest zip codes: 77386, 77073, 77090, 77032, 77388, 77365.
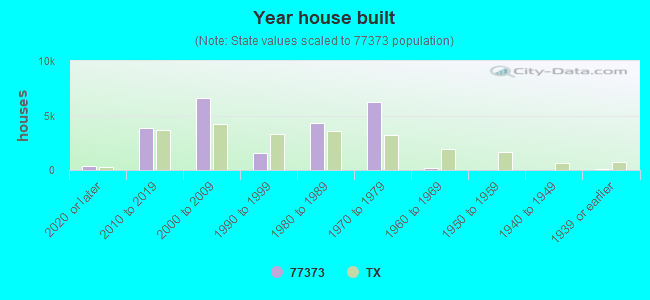


 According to the data from the years 2002 - 2018 the average number of fire incidents per year is 175. The highest number of fires - 264 took place in 2011, and the least - 117 in 2007. The data has a decreasing trend.
 When looking into fire subcategories, the most incidents belonged to: Outside Fires (42.9%), and Structure Fires (37.3%).