Estimated zip code population in 2022: 53,528
Zip code population in 2010: 40,384
Zip code population in 2000: 26,623
Houses and condos: 19,232
Renter-occupied apartments: 5,426
% of renters here:
29%State:
38%
March 2022 cost of living index in zip code 77388: 97.1
(near average, U.S. average is 100)
Land area: 13.9
sq. mi.
Water area: 0.1
sq. mi.
Population density: 3,851 people per square mile (average).
OSM Map
General Map
Google Map
MSN Map
OSM Map
General Map
Google Map
MSN Map
OSM Map
General Map
Google Map
MSN Map
OSM Map
General Map
Google Map
MSN Map
Please wait while loading the map...
Real estate property taxes paid for housing units in 2022:
This zip code:
1.6% ($4,675)Texas:
1.5% ($4,050)
Median real estate property taxes paid for housing units with mortgages in 2022: $4,943 (1.7%)
Median real estate property taxes paid for housing units with no mortgage in 2022: $4,089 (1.4%)
Profiles of local businesses
Business Search - 14 Million verified businesses
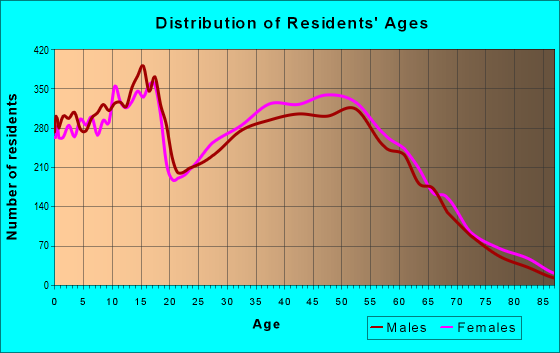
Males: 25,798 Females: 27,729
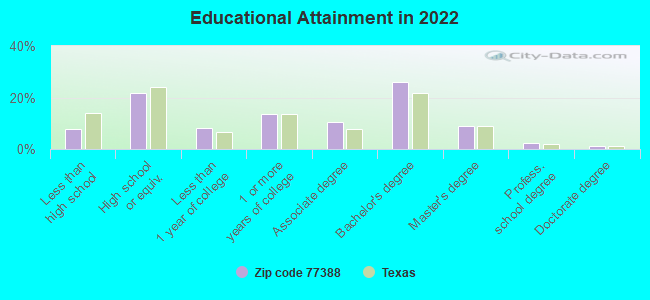
For population 25 years and over in 77388:
High school or higher: 93.2%Bachelor's degree or higher: 38.6%Graduate or professional degree: 12.2%Unemployed: 4.9%Mean travel time to work (commute): 29.4 minutes
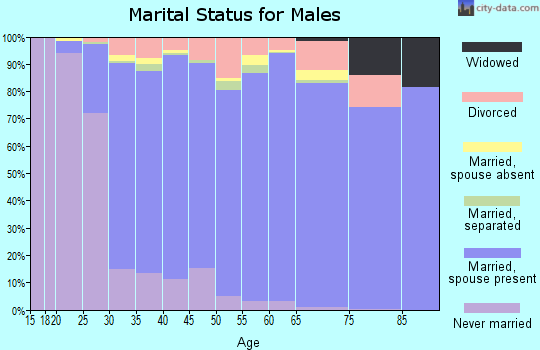
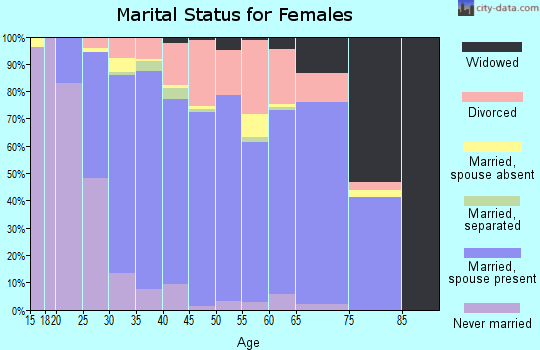
For population 15 years and over in 77388:
Never married: 31.9%Now married: 49.8%Separated: 1.4%Widowed: 4.2%Divorced: 12.7%
Zip code 77388 compared to state average:
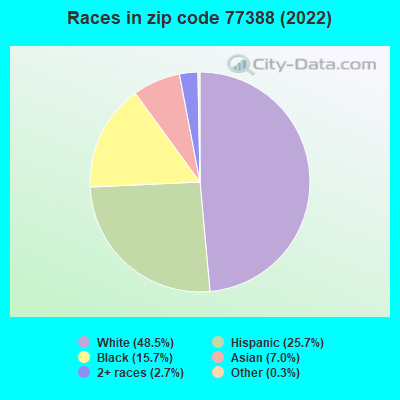
Length of stay since moving in significantly above state average. Number of rooms per house above state average. House age below state average. 25,950 48.5% White 13,756 25.7% Hispanic or Latino 8,425 15.7% Black 3,725 7.0% Asian 1,464 2.7% Two or more races 169 0.3% Some other race 22 0.04% Native Hawaiian and Other 14 0.03% American Indian
Data:
Median household income ($)
Median household income (% change since 2000)
Household income diversity
Ratio of average income to average house value (%)
Ratio of average income to average rent
Median household income ($) - White
Median household income ($) - Black or African American
Median household income ($) - Asian
Median household income ($) - Hispanic or Latino
Median household income ($) - American Indian and Alaska Native
Median household income ($) - Multirace
Median household income ($) - Other Race
Median household income for houses/condos with a mortgage ($)
Median household income for apartments without a mortgage ($)
Races - White alone (%)
Races - White alone (% change since 2000)
Races - Black alone (%)
Races - Black alone (% change since 2000)
Races - American Indian alone (%)
Races - American Indian alone (% change since 2000)
Races - Asian alone (%)
Races - Asian alone (% change since 2000)
Races - Hispanic (%)
Races - Hispanic (% change since 2000)
Races - Native Hawaiian and Other Pacific Islander alone (%)
Races - Native Hawaiian and Other Pacific Islander alone (% change since 2000)
Races - Two or more races (%)
Races - Two or more races (% change since 2000)
Races - Other race alone (%)
Races - Other race alone (% change since 2000)
Racial diversity
Unemployment (%)
Unemployment (% change since 2000)
Unemployment (%) - White
Unemployment (%) - Black or African American
Unemployment (%) - Asian
Unemployment (%) - Hispanic or Latino
Unemployment (%) - American Indian and Alaska Native
Unemployment (%) - Multirace
Unemployment (%) - Other Race
Population density (people per square mile)
Population - Males (%)
Population - Females (%)
Population - Males (%) - White
Population - Males (%) - Black or African American
Population - Males (%) - Asian
Population - Males (%) - Hispanic or Latino
Population - Males (%) - American Indian and Alaska Native
Population - Males (%) - Multirace
Population - Males (%) - Other Race
Population - Females (%) - White
Population - Females (%) - Black or African American
Population - Females (%) - Asian
Population - Females (%) - Hispanic or Latino
Population - Females (%) - American Indian and Alaska Native
Population - Females (%) - Multirace
Population - Females (%) - Other Race
Coronavirus confirmed cases (May 17, 2024)
Deaths caused by coronavirus (May 17, 2024)
Coronavirus confirmed cases (per 100k population) (May 17, 2024)
Deaths caused by coronavirus (per 100k population) (May 17, 2024)
Daily increase in number of cases (May 17, 2024)
Weekly increase in number of cases (May 17, 2024)
Cases doubled (in days) (May 17, 2024)
Hospitalized patients (Apr 18, 2022)
Negative test results (Apr 18, 2022)
Total test results (Apr 18, 2022)
COVID Vaccine doses distributed (per 100k population) (Sep 19, 2023)
COVID Vaccine doses administered (per 100k population) (Sep 19, 2023)
COVID Vaccine doses distributed (Sep 19, 2023)
COVID Vaccine doses administered (Sep 19, 2023)
Likely homosexual households (%)
Likely homosexual households (% change since 2000)
Likely homosexual households - Lesbian couples (%)
Likely homosexual households - Lesbian couples (% change since 2000)
Likely homosexual households - Gay men (%)
Likely homosexual households - Gay men (% change since 2000)
Cost of living index
Median gross rent ($)
Median contract rent ($)
Median monthly housing costs ($)
Median house or condo value ($)
Median house or condo value ($ change since 2000)
Mean house or condo value by units in structure - 1, detached ($)
Mean house or condo value by units in structure - 1, attached ($)
Mean house or condo value by units in structure - 2 ($)
Mean house or condo value by units in structure by units in structure - 3 or 4 ($)
Mean house or condo value by units in structure - 5 or more ($)
Mean house or condo value by units in structure - Boat, RV, van, etc. ($)
Mean house or condo value by units in structure - Mobile home ($)
Median house or condo value ($) - White
Median house or condo value ($) - Black or African American
Median house or condo value ($) - Asian
Median house or condo value ($) - Hispanic or Latino
Median house or condo value ($) - American Indian and Alaska Native
Median house or condo value ($) - Multirace
Median house or condo value ($) - Other Race
Median resident age
Resident age diversity
Median resident age - Males
Median resident age - Females
Median resident age - White
Median resident age - Black or African American
Median resident age - Asian
Median resident age - Hispanic or Latino
Median resident age - American Indian and Alaska Native
Median resident age - Multirace
Median resident age - Other Race
Median resident age - Males - White
Median resident age - Males - Black or African American
Median resident age - Males - Asian
Median resident age - Males - Hispanic or Latino
Median resident age - Males - American Indian and Alaska Native
Median resident age - Males - Multirace
Median resident age - Males - Other Race
Median resident age - Females - White
Median resident age - Females - Black or African American
Median resident age - Females - Asian
Median resident age - Females - Hispanic or Latino
Median resident age - Females - American Indian and Alaska Native
Median resident age - Females - Multirace
Median resident age - Females - Other Race
Commute - mean travel time to work (minutes)
Travel time to work - Less than 5 minutes (%)
Travel time to work - Less than 5 minutes (% change since 2000)
Travel time to work - 5 to 9 minutes (%)
Travel time to work - 5 to 9 minutes (% change since 2000)
Travel time to work - 10 to 19 minutes (%)
Travel time to work - 10 to 19 minutes (% change since 2000)
Travel time to work - 20 to 29 minutes (%)
Travel time to work - 20 to 29 minutes (% change since 2000)
Travel time to work - 30 to 39 minutes (%)
Travel time to work - 30 to 39 minutes (% change since 2000)
Travel time to work - 40 to 59 minutes (%)
Travel time to work - 40 to 59 minutes (% change since 2000)
Travel time to work - 60 to 89 minutes (%)
Travel time to work - 60 to 89 minutes (% change since 2000)
Travel time to work - 90 or more minutes (%)
Travel time to work - 90 or more minutes (% change since 2000)
Marital status - Never married (%)
Marital status - Now married (%)
Marital status - Separated (%)
Marital status - Widowed (%)
Marital status - Divorced (%)
Median family income ($)
Median family income (% change since 2000)
Median non-family income ($)
Median non-family income (% change since 2000)
Median per capita income ($)
Median per capita income (% change since 2000)
Median family income ($) - White
Median family income ($) - Black or African American
Median family income ($) - Asian
Median family income ($) - Hispanic or Latino
Median family income ($) - American Indian and Alaska Native
Median family income ($) - Multirace
Median family income ($) - Other Race
Median year house/condo built
Median year apartment built
Year house built - Built 2005 or later (%)
Year house built - Built 2000 to 2004 (%)
Year house built - Built 1990 to 1999 (%)
Year house built - Built 1980 to 1989 (%)
Year house built - Built 1970 to 1979 (%)
Year house built - Built 1960 to 1969 (%)
Year house built - Built 1950 to 1959 (%)
Year house built - Built 1940 to 1949 (%)
Year house built - Built 1939 or earlier (%)
Average household size
Household density (households per square mile)
Average household size - White
Average household size - Black or African American
Average household size - Asian
Average household size - Hispanic or Latino
Average household size - American Indian and Alaska Native
Average household size - Multirace
Average household size - Other Race
Occupied housing units (%)
Vacant housing units (%)
Owner occupied housing units (%)
Renter occupied housing units (%)
Vacancy status - For rent (%)
Vacancy status - For sale only (%)
Vacancy status - Rented or sold, not occupied (%)
Vacancy status - For seasonal, recreational, or occasional use (%)
Vacancy status - For migrant workers (%)
Vacancy status - Other vacant (%)
Residents with income below the poverty level (%)
Residents with income below 50% of the poverty level (%)
Children below poverty level (%)
Poor families by family type - Married-couple family (%)
Poor families by family type - Male, no wife present (%)
Poor families by family type - Female, no husband present (%)
Poverty status for native-born residents (%)
Poverty status for foreign-born residents (%)
Poverty among high school graduates not in families (%)
Poverty among people who did not graduate high school not in families (%)
Residents with income below the poverty level (%) - White
Residents with income below the poverty level (%) - Black or African American
Residents with income below the poverty level (%) - Asian
Residents with income below the poverty level (%) - Hispanic or Latino
Residents with income below the poverty level (%) - American Indian and Alaska Native
Residents with income below the poverty level (%) - Multirace
Residents with income below the poverty level (%) - Other Race
Air pollution - Air Quality Index (AQI)
Air pollution - CO
Air pollution - NO2
Air pollution - SO2
Air pollution - Ozone
Air pollution - PM10
Air pollution - PM25
Air pollution - Pb
Crime - Murders per 100,000 population
Crime - Rapes per 100,000 population
Crime - Robberies per 100,000 population
Crime - Assaults per 100,000 population
Crime - Burglaries per 100,000 population
Crime - Thefts per 100,000 population
Crime - Auto thefts per 100,000 population
Crime - Arson per 100,000 population
Crime - City-data.com crime index
Crime - Violent crime index
Crime - Property crime index
Crime - Murders per 100,000 population (5 year average)
Crime - Rapes per 100,000 population (5 year average)
Crime - Robberies per 100,000 population (5 year average)
Crime - Assaults per 100,000 population (5 year average)
Crime - Burglaries per 100,000 population (5 year average)
Crime - Thefts per 100,000 population (5 year average)
Crime - Auto thefts per 100,000 population (5 year average)
Crime - Arson per 100,000 population (5 year average)
Crime - City-data.com crime index (5 year average)
Crime - Violent crime index (5 year average)
Crime - Property crime index (5 year average)
1996 Presidential Elections Results (%) - Democratic Party (Clinton)
1996 Presidential Elections Results (%) - Republican Party (Dole)
1996 Presidential Elections Results (%) - Other
2000 Presidential Elections Results (%) - Democratic Party (Gore)
2000 Presidential Elections Results (%) - Republican Party (Bush)
2000 Presidential Elections Results (%) - Other
2004 Presidential Elections Results (%) - Democratic Party (Kerry)
2004 Presidential Elections Results (%) - Republican Party (Bush)
2004 Presidential Elections Results (%) - Other
2008 Presidential Elections Results (%) - Democratic Party (Obama)
2008 Presidential Elections Results (%) - Republican Party (McCain)
2008 Presidential Elections Results (%) - Other
2012 Presidential Elections Results (%) - Democratic Party (Obama)
2012 Presidential Elections Results (%) - Republican Party (Romney)
2012 Presidential Elections Results (%) - Other
2016 Presidential Elections Results (%) - Democratic Party (Clinton)
2016 Presidential Elections Results (%) - Republican Party (Trump)
2016 Presidential Elections Results (%) - Other
2020 Presidential Elections Results (%) - Democratic Party (Biden)
2020 Presidential Elections Results (%) - Republican Party (Trump)
2020 Presidential Elections Results (%) - Other
Ancestries Reported - Arab (%)
Ancestries Reported - Czech (%)
Ancestries Reported - Danish (%)
Ancestries Reported - Dutch (%)
Ancestries Reported - English (%)
Ancestries Reported - French (%)
Ancestries Reported - French Canadian (%)
Ancestries Reported - German (%)
Ancestries Reported - Greek (%)
Ancestries Reported - Hungarian (%)
Ancestries Reported - Irish (%)
Ancestries Reported - Italian (%)
Ancestries Reported - Lithuanian (%)
Ancestries Reported - Norwegian (%)
Ancestries Reported - Polish (%)
Ancestries Reported - Portuguese (%)
Ancestries Reported - Russian (%)
Ancestries Reported - Scotch-Irish (%)
Ancestries Reported - Scottish (%)
Ancestries Reported - Slovak (%)
Ancestries Reported - Subsaharan African (%)
Ancestries Reported - Swedish (%)
Ancestries Reported - Swiss (%)
Ancestries Reported - Ukrainian (%)
Ancestries Reported - United States (%)
Ancestries Reported - Welsh (%)
Ancestries Reported - West Indian (%)
Ancestries Reported - Other (%)
Educational Attainment - No schooling completed (%)
Educational Attainment - Less than high school (%)
Educational Attainment - High school or equivalent (%)
Educational Attainment - Less than 1 year of college (%)
Educational Attainment - 1 or more years of college (%)
Educational Attainment - Associate degree (%)
Educational Attainment - Bachelor's degree (%)
Educational Attainment - Master's degree (%)
Educational Attainment - Professional school degree (%)
Educational Attainment - Doctorate degree (%)
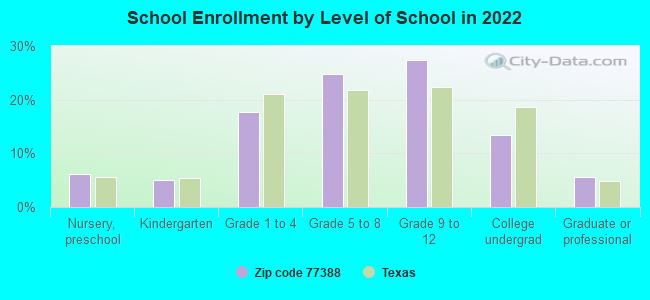
School Enrollment - Nursery, preschool (%)
School Enrollment - Kindergarten (%)
School Enrollment - Grade 1 to 4 (%)
School Enrollment - Grade 5 to 8 (%)
School Enrollment - Grade 9 to 12 (%)
School Enrollment - College undergrad (%)
School Enrollment - Graduate or professional (%)
School Enrollment - Not enrolled in school (%)
School enrollment - Public schools (%)
School enrollment - Private schools (%)
School enrollment - Not enrolled (%)
Median number of rooms in houses and condos
Median number of rooms in apartments
Housing units lacking complete plumbing facilities (%)
Housing units lacking complete kitchen facilities (%)
Density of houses
Urban houses (%)
Rural houses (%)
Households with people 60 years and over (%)
Households with people 65 years and over (%)
Households with people 75 years and over (%)
Households with one or more nonrelatives (%)
Households with no nonrelatives (%)
Population in households (%)
Family households (%)
Nonfamily households (%)
Population in families (%)
Family households with own children (%)
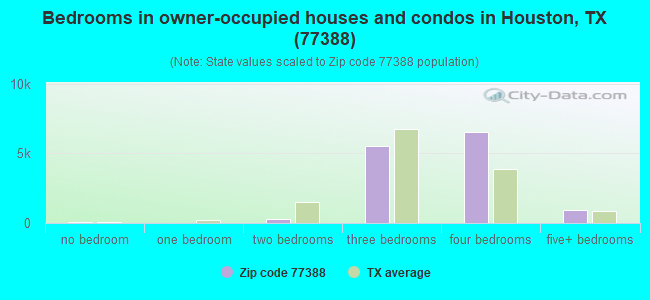
Median number of bedrooms in owner occupied houses
Mean number of bedrooms in owner occupied houses
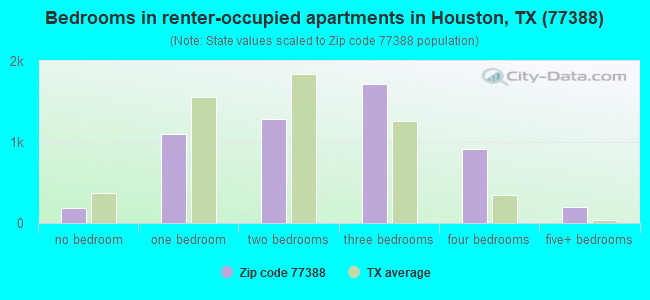
Median number of bedrooms in renter occupied houses
Mean number of bedrooms in renter occupied houses
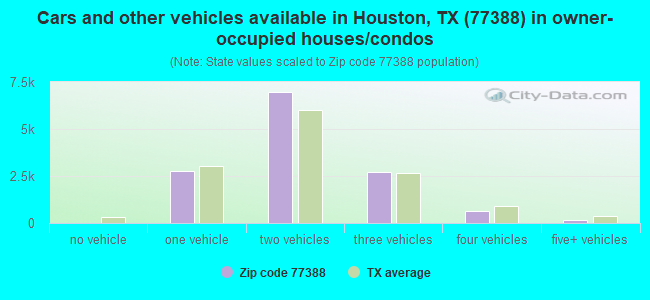
Median number of vehichles in owner occupied houses
Mean number of vehichles in owner occupied houses
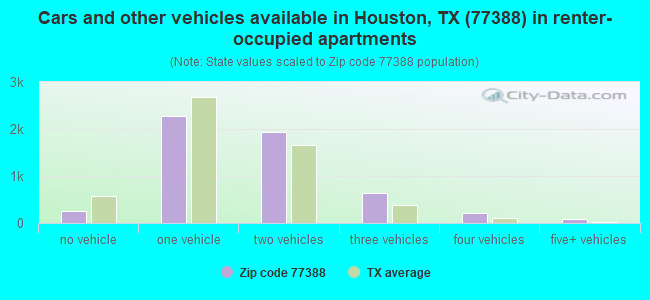
Median number of vehichles in renter occupied houses
Mean number of vehichles in renter occupied houses
Mortgage status - with mortgage (%)
Mortgage status - with second mortgage (%)
Mortgage status - with home equity loan (%)
Mortgage status - with both second mortgage and home equity loan (%)
Mortgage status - without a mortgage (%)
Average family size
Average family size - White
Average family size - Black or African American
Average family size - Asian
Average family size - Hispanic or Latino
Average family size - American Indian and Alaska Native
Average family size - Multirace
Average family size - Other Race
Geographical mobility - Same house 1 year ago (%)
Geographical mobility - Moved within same county (%)
Geographical mobility - Moved from different county within same state (%)
Geographical mobility - Moved from different state (%)
Geographical mobility - Moved from abroad (%)
Place of birth - Born in state of residence (%)
Place of birth - Born in other state (%)
Place of birth - Native, outside of US (%)
Place of birth - Foreign born (%)
Housing units in structures - 1, detached (%)
Housing units in structures - 1, attached (%)
Housing units in structures - 2 (%)
Housing units in structures - 3 or 4 (%)
Housing units in structures - 5 to 9 (%)
Housing units in structures - 10 to 19 (%)
Housing units in structures - 20 to 49 (%)
Housing units in structures - 50 or more (%)
Housing units in structures - Mobile home (%)
Housing units in structures - Boat, RV, van, etc. (%)
House/condo owner moved in on average (years ago)
Renter moved in on average (years ago)
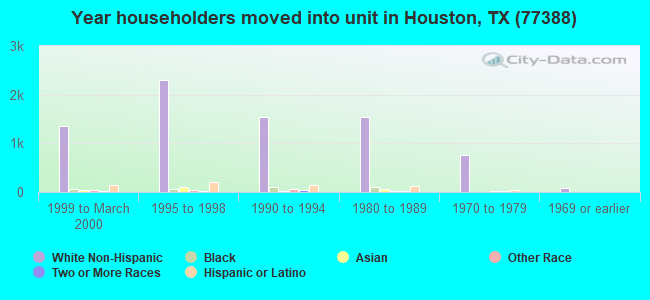
Year householder moved into unit - Moved in 1999 to March 2000 (%)
Year householder moved into unit - Moved in 1995 to 1998 (%)
Year householder moved into unit - Moved in 1990 to 1994 (%)
Year householder moved into unit - Moved in 1980 to 1989 (%)
Year householder moved into unit - Moved in 1970 to 1979 (%)
Year householder moved into unit - Moved in 1969 or earlier (%)
Means of transportation to work - Drove car alone (%)
Means of transportation to work - Carpooled (%)
Means of transportation to work - Public transportation (%)
Means of transportation to work - Bus or trolley bus (%)
Means of transportation to work - Streetcar or trolley car (%)
Means of transportation to work - Subway or elevated (%)
Means of transportation to work - Railroad (%)
Means of transportation to work - Ferryboat (%)
Means of transportation to work - Taxicab (%)
Means of transportation to work - Motorcycle (%)
Means of transportation to work - Bicycle (%)
Means of transportation to work - Walked (%)
Means of transportation to work - Other means (%)
Working at home (%)
Industry diversity
Most Common Industries - Agriculture, forestry, fishing and hunting, and mining (%)
Most Common Industries - Agriculture, forestry, fishing and hunting (%)
Most Common Industries - Mining, quarrying, and oil and gas extraction (%)
Most Common Industries - Construction (%)
Most Common Industries - Manufacturing (%)
Most Common Industries - Wholesale trade (%)
Most Common Industries - Retail trade (%)
Most Common Industries - Transportation and warehousing, and utilities (%)
Most Common Industries - Transportation and warehousing (%)
Most Common Industries - Utilities (%)
Most Common Industries - Information (%)
Most Common Industries - Finance and insurance, and real estate and rental and leasing (%)
Most Common Industries - Finance and insurance (%)
Most Common Industries - Real estate and rental and leasing (%)
Most Common Industries - Professional, scientific, and management, and administrative and waste management services (%)
Most Common Industries - Professional, scientific, and technical services (%)
Most Common Industries - Management of companies and enterprises (%)
Most Common Industries - Administrative and support and waste management services (%)
Most Common Industries - Educational services, and health care and social assistance (%)
Most Common Industries - Educational services (%)
Most Common Industries - Health care and social assistance (%)
Most Common Industries - Arts, entertainment, and recreation, and accommodation and food services (%)
Most Common Industries - Arts, entertainment, and recreation (%)
Most Common Industries - Accommodation and food services (%)
Most Common Industries - Other services, except public administration (%)
Most Common Industries - Public administration (%)
Occupation diversity
Most Common Occupations - Management, business, science, and arts occupations (%)
Most Common Occupations - Management, business, and financial occupations (%)
Most Common Occupations - Management occupations (%)
Most Common Occupations - Business and financial operations occupations (%)
Most Common Occupations - Computer, engineering, and science occupations (%)
Most Common Occupations - Computer and mathematical occupations (%)
Most Common Occupations - Architecture and engineering occupations (%)
Most Common Occupations - Life, physical, and social science occupations (%)
Most Common Occupations - Education, legal, community service, arts, and media occupations (%)
Most Common Occupations - Community and social service occupations (%)
Most Common Occupations - Legal occupations (%)
Most Common Occupations - Education, training, and library occupations (%)
Most Common Occupations - Arts, design, entertainment, sports, and media occupations (%)
Most Common Occupations - Healthcare practitioners and technical occupations (%)
Most Common Occupations - Health diagnosing and treating practitioners and other technical occupations (%)
Most Common Occupations - Health technologists and technicians (%)
Most Common Occupations - Service occupations (%)
Most Common Occupations - Healthcare support occupations (%)
Most Common Occupations - Protective service occupations (%)
Most Common Occupations - Fire fighting and prevention, and other protective service workers including supervisors (%)
Most Common Occupations - Law enforcement workers including supervisors (%)
Most Common Occupations - Food preparation and serving related occupations (%)
Most Common Occupations - Building and grounds cleaning and maintenance occupations (%)
Most Common Occupations - Personal care and service occupations (%)
Most Common Occupations - Sales and office occupations (%)
Most Common Occupations - Sales and related occupations (%)
Most Common Occupations - Office and administrative support occupations (%)
Most Common Occupations - Natural resources, construction, and maintenance occupations (%)
Most Common Occupations - Farming, fishing, and forestry occupations (%)
Most Common Occupations - Construction and extraction occupations (%)
Most Common Occupations - Installation, maintenance, and repair occupations (%)
Most Common Occupations - Production, transportation, and material moving occupations (%)
Most Common Occupations - Production occupations (%)
Most Common Occupations - Transportation occupations (%)
Most Common Occupations - Material moving occupations (%)
People in Group quarters - Institutionalized population (%)
People in Group quarters - Correctional institutions (%)
People in Group quarters - Federal prisons and detention centers (%)
People in Group quarters - Halfway houses (%)
People in Group quarters - Local jails and other confinement facilities (including police lockups) (%)
People in Group quarters - Military disciplinary barracks (%)
People in Group quarters - State prisons (%)
People in Group quarters - Other types of correctional institutions (%)
People in Group quarters - Nursing homes (%)
People in Group quarters - Hospitals/wards, hospices, and schools for the handicapped (%)
People in Group quarters - Hospitals/wards and hospices for chronically ill (%)
People in Group quarters - Hospices or homes for chronically ill (%)
People in Group quarters - Military hospitals or wards for chronically ill (%)
People in Group quarters - Other hospitals or wards for chronically ill (%)
People in Group quarters - Hospitals or wards for drug/alcohol abuse (%)
People in Group quarters - Mental (Psychiatric) hospitals or wards (%)
People in Group quarters - Schools, hospitals, or wards for the mentally retarded (%)
People in Group quarters - Schools, hospitals, or wards for the physically handicapped (%)
People in Group quarters - Institutions for the deaf (%)
People in Group quarters - Institutions for the blind (%)
People in Group quarters - Orthopedic wards and institutions for the physically handicapped (%)
People in Group quarters - Wards in general hospitals for patients who have no usual home elsewhere (%)
People in Group quarters - Wards in military hospitals for patients who have no usual home elsewhere (%)
People in Group quarters - Juvenile institutions (%)
People in Group quarters - Long-term care (%)
People in Group quarters - Homes for abused, dependent, and neglected children (%)
People in Group quarters - Residential treatment centers for emotionally disturbed children (%)
People in Group quarters - Training schools for juvenile delinquents (%)
People in Group quarters - Short-term care, detention or diagnostic centers for delinquent children (%)
People in Group quarters - Type of juvenile institution unknown (%)
People in Group quarters - Noninstitutionalized population (%)
People in Group quarters - College dormitories (includes college quarters off campus) (%)
People in Group quarters - Military quarters (%)
People in Group quarters - On base (%)
People in Group quarters - Barracks, unaccompanied personnel housing (UPH), (Enlisted/Officer), ;and similar group living quarters for military personnel (%)
People in Group quarters - Transient quarters for temporary residents (%)
People in Group quarters - Military ships (%)
People in Group quarters - Group homes (%)
People in Group quarters - Homes or halfway houses for drug/alcohol abuse (%)
People in Group quarters - Homes for the mentally ill (%)
People in Group quarters - Homes for the mentally retarded (%)
People in Group quarters - Homes for the physically handicapped (%)
People in Group quarters - Other group homes (%)
People in Group quarters - Religious group quarters (%)
People in Group quarters - Dormitories (%)
People in Group quarters - Agriculture workers' dormitories on farms (%)
People in Group quarters - Job Corps and vocational training facilities (%)
People in Group quarters - Other workers' dormitories (%)
People in Group quarters - Crews of maritime vessels (%)
People in Group quarters - Other nonhousehold living situations (%)
People in Group quarters - Other noninstitutional group quarters (%)
Residents speaking English at home (%)
Residents speaking English at home - Born in the United States (%)
Residents speaking English at home - Native, born elsewhere (%)
Residents speaking English at home - Foreign born (%)
Residents speaking Spanish at home (%)
Residents speaking Spanish at home - Born in the United States (%)
Residents speaking Spanish at home - Native, born elsewhere (%)
Residents speaking Spanish at home - Foreign born (%)
Residents speaking other language at home (%)
Residents speaking other language at home - Born in the United States (%)
Residents speaking other language at home - Native, born elsewhere (%)
Residents speaking other language at home - Foreign born (%)
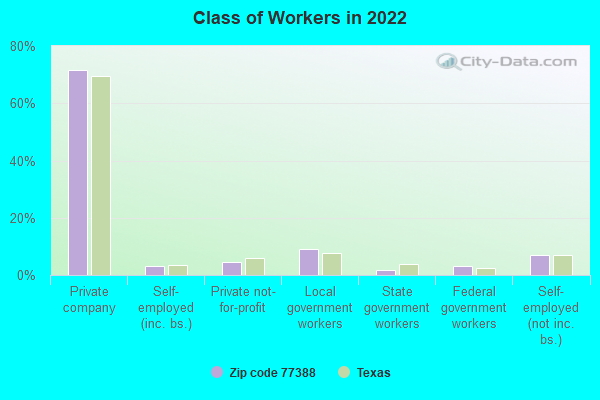
Class of Workers - Employee of private company (%)
Class of Workers - Self-employed in own incorporated business (%)
Class of Workers - Private not-for-profit wage and salary workers (%)
Class of Workers - Local government workers (%)
Class of Workers - State government workers (%)
Class of Workers - Federal government workers (%)
Class of Workers - Self-employed workers in own not incorporated business and Unpaid family workers (%)
House heating fuel used in houses and condos - Utility gas (%)
House heating fuel used in houses and condos - Bottled, tank, or LP gas (%)
House heating fuel used in houses and condos - Electricity (%)
House heating fuel used in houses and condos - Fuel oil, kerosene, etc. (%)
House heating fuel used in houses and condos - Coal or coke (%)
House heating fuel used in houses and condos - Wood (%)
House heating fuel used in houses and condos - Solar energy (%)
House heating fuel used in houses and condos - Other fuel (%)
House heating fuel used in houses and condos - No fuel used (%)
House heating fuel used in apartments - Utility gas (%)
House heating fuel used in apartments - Bottled, tank, or LP gas (%)
House heating fuel used in apartments - Electricity (%)
House heating fuel used in apartments - Fuel oil, kerosene, etc. (%)
House heating fuel used in apartments - Coal or coke (%)
House heating fuel used in apartments - Wood (%)
House heating fuel used in apartments - Solar energy (%)
House heating fuel used in apartments - Other fuel (%)
House heating fuel used in apartments - No fuel used (%)
Armed forces status - In Armed Forces (%)
Armed forces status - Civilian (%)
Armed forces status - Civilian - Veteran (%)
Armed forces status - Civilian - Nonveteran (%)
Fatal accidents locations in years 2005-2021
Fatal accidents locations in 2005
Fatal accidents locations in 2006
Fatal accidents locations in 2007
Fatal accidents locations in 2008
Fatal accidents locations in 2009
Fatal accidents locations in 2010
Fatal accidents locations in 2011
Fatal accidents locations in 2012
Fatal accidents locations in 2013
Fatal accidents locations in 2014
Fatal accidents locations in 2015
Fatal accidents locations in 2016
Fatal accidents locations in 2017
Fatal accidents locations in 2018
Fatal accidents locations in 2019
Fatal accidents locations in 2020
Fatal accidents locations in 2021
Alcohol use - People drinking some alcohol every month (%)
Alcohol use - People not drinking at all (%)
Alcohol use - Average days/month drinking alcohol
Alcohol use - Average drinks/week
Alcohol use - Average days/year people drink much
Audiometry - Average condition of hearing (%)
Audiometry - People that can hear a whisper from across a quiet room (%)
Audiometry - People that can hear normal voice from across a quiet room (%)
Audiometry - Ears ringing, roaring, buzzing (%)
Audiometry - Had a job exposure to loud noise (%)
Audiometry - Had off-work exposure to loud noise (%)
Blood Pressure & Cholesterol - Has high blood pressure (%)
Blood Pressure & Cholesterol - Checking blood pressure at home (%)
Blood Pressure & Cholesterol - Frequently checking blood cholesterol (%)
Blood Pressure & Cholesterol - Has high cholesterol level (%)
Consumer Behavior - Money monthly spent on food at supermarket/grocery store
Consumer Behavior - Money monthly spent on food at other stores
Consumer Behavior - Money monthly spent on eating out
Consumer Behavior - Money monthly spent on carryout/delivered foods
Consumer Behavior - Income spent on food at supermarket/grocery store (%)
Consumer Behavior - Income spent on food at other stores (%)
Consumer Behavior - Income spent on eating out (%)
Consumer Behavior - Income spent on carryout/delivered foods (%)
Current Health Status - General health condition (%)
Current Health Status - Blood donors (%)
Current Health Status - Has blood ever tested for HIV virus (%)
Current Health Status - Left-handed people (%)
Dermatology - People using sunscreen (%)
Diabetes - Diabetics (%)
Diabetes - Had a blood test for high blood sugar (%)
Diabetes - People taking insulin (%)
Diet Behavior & Nutrition - Diet health (%)
Diet Behavior & Nutrition - Milk product consumption (# of products/month)
Diet Behavior & Nutrition - Meals not home prepared (#/week)
Diet Behavior & Nutrition - Meals from fast food or pizza place (#/week)
Diet Behavior & Nutrition - Ready-to-eat foods (#/month)
Diet Behavior & Nutrition - Frozen meals/pizza (#/month)
Drug Use - People that ever used marijuana or hashish (%)
Drug Use - Ever used hard drugs (%)
Drug Use - Ever used any form of cocaine (%)
Drug Use - Ever used heroin (%)
Drug Use - Ever used methamphetamine (%)
Health Insurance - People covered by health insurance (%)
Kidney Conditions-Urology - Avg. # of times urinating at night
Medical Conditions - People with asthma (%)
Medical Conditions - People with anemia (%)
Medical Conditions - People with psoriasis (%)
Medical Conditions - People with overweight (%)
Medical Conditions - Elderly people having difficulties in thinking or remembering (%)
Medical Conditions - People who ever received blood transfusion (%)
Medical Conditions - People having trouble seeing even with glass/contacts (%)
Medical Conditions - People with arthritis (%)
Medical Conditions - People with gout (%)
Medical Conditions - People with congestive heart failure (%)
Medical Conditions - People with coronary heart disease (%)
Medical Conditions - People with angina pectoris (%)
Medical Conditions - People who ever had heart attack (%)
Medical Conditions - People who ever had stroke (%)
Medical Conditions - People with emphysema (%)
Medical Conditions - People with thyroid problem (%)
Medical Conditions - People with chronic bronchitis (%)
Medical Conditions - People with any liver condition (%)
Medical Conditions - People who ever had cancer or malignancy (%)
Mental Health - People who have little interest in doing things (%)
Mental Health - People feeling down, depressed, or hopeless (%)
Mental Health - People who have trouble sleeping or sleeping too much (%)
Mental Health - People feeling tired or having little energy (%)
Mental Health - People with poor appetite or overeating (%)
Mental Health - People feeling bad about themself (%)
Mental Health - People who have trouble concentrating on things (%)
Mental Health - People moving or speaking slowly or too fast (%)
Mental Health - People having thoughts they would be better off dead (%)
Oral Health - Average years since last visit a dentist
Oral Health - People embarrassed because of mouth (%)
Oral Health - People with gum disease (%)
Oral Health - General health of teeth and gums (%)
Oral Health - Average days a week using dental floss/device
Oral Health - Average days a week using mouthwash for dental problem
Oral Health - Average number of teeth
Pesticide Use - Households using pesticides to control insects (%)
Pesticide Use - Households using pesticides to kill weeds (%)
Physical Activity - People doing vigorous-intensity work activities (%)
Physical Activity - People doing moderate-intensity work activities (%)
Physical Activity - People walking or bicycling (%)
Physical Activity - People doing vigorous-intensity recreational activities (%)
Physical Activity - People doing moderate-intensity recreational activities (%)
Physical Activity - Average hours a day doing sedentary activities
Physical Activity - Average hours a day watching TV or videos
Physical Activity - Average hours a day using computer
Physical Functioning - People having limitations keeping them from working (%)
Physical Functioning - People limited in amount of work they can do (%)
Physical Functioning - People that need special equipment to walk (%)
Physical Functioning - People experiencing confusion/memory problems (%)
Physical Functioning - People requiring special healthcare equipment (%)
Prescription Medications - Average number of prescription medicines taking
Preventive Aspirin Use - Adults 40+ taking low-dose aspirin (%)
Reproductive Health - Vaginal deliveries (%)
Reproductive Health - Cesarean deliveries (%)
Reproductive Health - Deliveries resulted in a live birth (%)
Reproductive Health - Pregnancies resulted in a delivery (%)
Reproductive Health - Women breastfeeding newborns (%)
Reproductive Health - Women that had a hysterectomy (%)
Reproductive Health - Women that had both ovaries removed (%)
Reproductive Health - Women that have ever taken birth control pills (%)
Reproductive Health - Women taking birth control pills (%)
Reproductive Health - Women that have ever used Depo-Provera or injectables (%)
Reproductive Health - Women that have ever used female hormones (%)
Sexual Behavior - People 18+ that ever had sex (vaginal, anal, or oral) (%)
Sexual Behavior - Males 18+ that ever had vaginal sex with a woman (%)
Sexual Behavior - Males 18+ that ever performed oral sex on a woman (%)
Sexual Behavior - Males 18+ that ever had anal sex with a woman (%)
Sexual Behavior - Males 18+ that ever had any sex with a man (%)
Sexual Behavior - Females 18+ that ever had vaginal sex with a man (%)
Sexual Behavior - Females 18+ that ever performed oral sex on a man (%)
Sexual Behavior - Females 18+ that ever had anal sex with a man (%)
Sexual Behavior - Females 18+ that ever had any kind of sex with a woman (%)
Sexual Behavior - Average age people first had sex
Sexual Behavior - Average number of female sex partners in lifetime (males 18+)
Sexual Behavior - Average number of female vaginal sex partners in lifetime (males 18+)
Sexual Behavior - Average age people first performed oral sex on a woman (18+)
Sexual Behavior - Average number of woman performed oral sex on in lifetime (18+)
Sexual Behavior - Average number of male sex partners in lifetime (males 18+)
Sexual Behavior - Average number of male anal sex partners in lifetime (males 18+)
Sexual Behavior - Average age people first performed oral sex on a man (18+)
Sexual Behavior - Average number of male oral sex partners in lifetime (18+)
Sexual Behavior - People using protection when performing oral sex (%)
Sexual Behavior - Average number of times people have vaginal or anal sex a year
Sexual Behavior - People having sex without condom (%)
Sexual Behavior - Average number of male sex partners in lifetime (females 18+)
Sexual Behavior - Average number of male vaginal sex partners in lifetime (females 18+)
Sexual Behavior - Average number of female sex partners in lifetime (females 18+)
Sexual Behavior - Circumcised males 18+ (%)
Sleep Disorders - Average hours sleeping at night
Sleep Disorders - People that has trouble sleeping (%)
Smoking-Cigarette Use - People smoking cigarettes (%)
Taste & Smell - People 40+ having problems with smell (%)
Taste & Smell - People 40+ having problems with taste (%)
Taste & Smell - People 40+ that ever had wisdom teeth removed (%)
Taste & Smell - People 40+ that ever had tonsils teeth removed (%)
Taste & Smell - People 40+ that ever had a loss of consciousness because of a head injury (%)
Taste & Smell - People 40+ that ever had a broken nose or other serious injury to face or skull (%)
Taste & Smell - People 40+ that ever had two or more sinus infections (%)
Weight - Average height (inches)
Weight - Average weight (pounds)
Weight - Average BMI
Weight - People that are obese (%)
Weight - People that ever were obese (%)
Weight - People trying to lose weight (%)
Urban population: 53,489
Rural population: 38
Estimated median house/condo value in 2022: $284,657
77388:
$284,657Texas:
$275,400
According to our research of Texas and other state lists, there were 59 registered sex offenders living in 77388 zip code as of May 17, 2024 . The ratio of all residents to sex offenders in zip code 77388 is 762 to 1.The ratio of registered sex offenders to all residents in this zip code is lower than the state average.
Median resident age: This zip code:
35.5 yearsTexas median age:
35.6 years
Average household size: This zip code:
2.9 peopleTexas:
2.6 people
Averages for the 2020 tax year for zip code 77388, filed in 2021:
Average Adjusted Gross Income (AGI) in 2020: $69,577 (Individual Income Tax Returns) Here:
$69,577State:
$77,054
Salary/wage: $64,431 (reported on 83.9% of returns )Here:
$64,431State:
$62,766
(% of AGI for various income ranges: 1154.9% for AGIs below $25k , 3561.3% for AGIs $25k-50k , 6522.5% for AGIs $50k-75k , 9587.4% for AGIs $75k-100k , 17817.9% for AGIs $100k-200k , 63388.4% for AGIs over 200k ) Taxable interest for individuals: $1,302 (reported on 21.7% of returns )This zip code:
$1,302Texas:
$2,665
(% of AGI for various income ranges: 11.3% for AGIs below $25k , 13.8% for AGIs $25k-50k , 23.8% for AGIs $50k-75k , 45.1% for AGIs $75k-100k , 73.0% for AGIs $100k-200k , 518.4% for AGIs over 200k ) Ordinary dividends: $4,390 (reported on 16.1% of returns )(% of AGI for various income ranges: 14.9% for AGIs below $25k , 21.8% for AGIs $25k-50k , 54.1% for AGIs $50k-75k , 91.8% for AGIs $75k-100k , 197.4% for AGIs $100k-200k , 1636.7% for AGIs over 200k ) Net capital gain/loss in AGI: +$9,482 (reported on 14.9% of returns )Here:
+$9,482State:
+$39,590
(% of AGI for various income ranges: 3.9% for AGIs below $25k , 24.7% for AGIs $25k-50k , 53.9% for AGIs $50k-75k , 115.7% for AGIs $75k-100k , 331.2% for AGIs $100k-200k , 4834.7% for AGIs over 200k ) Profit/loss from business: +$8,370 (reported on 23.2% of returns )Here:
+$8,370State:
+$10,888
(% of AGI for various income ranges: 119.7% for AGIs below $25k , 135.4% for AGIs $25k-50k , 171.3% for AGIs $50k-75k , 225.8% for AGIs $75k-100k , 476.7% for AGIs $100k-200k , 3030.9% for AGIs over 200k ) Taxable individual retirement arrangement distribution: $25,602 (reported on 7.3% of returns )77388:
$25,602Texas:
$24,740
(% of AGI for various income ranges: 42.9% for AGIs below $25k , 87.3% for AGIs $25k-50k , 167.5% for AGIs $50k-75k , 352.1% for AGIs $75k-100k , 672.4% for AGIs $100k-200k , 2452.6% for AGIs over 200k ) Self-employed (Keogh) retirement plans: $19,320 (reported on 0.2% of returns )77388:
$19,320Texas:
$29,298
(% of AGI for various income ranges: 18.6% for AGIs $75k-100k , 148.8% for AGIs over 200k ) Total itemized deductions: $34,168 (reported on 8.4% of returns )Here:
$34,168State:
$40,428
(% of AGI for various income ranges: 45.5% for AGIs below $25k , 177.6% for AGIs $25k-50k , 379.9% for AGIs $50k-75k , 522.1% for AGIs $75k-100k , 821.6% for AGIs $100k-200k , 4194.2% for AGIs over 200k ) Charity contributions: $12,516 (reported on 7.0% of returns )Here:
$12,516State:
$18,201
(% of AGI for various income ranges: 3.8% for AGIs below $25k , 33.1% for AGIs $25k-50k , 81.3% for AGIs $50k-75k , 128.9% for AGIs $75k-100k , 267.0% for AGIs $100k-200k , 1859.1% for AGIs over 200k ) Taxes paid: $7,337 (reported on 8.1% of returns )(% of AGI for various income ranges: 6.8% for AGIs below $25k , 34.3% for AGIs $25k-50k , 80.6% for AGIs $50k-75k , 120.3% for AGIs $75k-100k , 194.2% for AGIs $100k-200k , 711.6% for AGIs over 200k ) Earned income credit: $2,371 (reported on 15.6% of returns )(% of AGI for various income ranges: 99.5% for AGIs below $25k , 73.5% for AGIs $25k-50k , 1.1% for AGIs $50k-75k ) Percentage of individuals using paid preparers for their 2020 taxes: 91.3%(% for various income ranges: 90.0% for AGIs below $25k , 92.4% for AGIs $25k-50k , 92.0% for AGIs $50k-75k , 92.2% for AGIs $75k-100k , 91.7% for AGIs $100k-200k , 89.4% for AGIs over 200k )
Averages for the 2012 tax year for zip code 77388, filed in 2013:
Average Adjusted Gross Income (AGI) in 2012: $74,325 (Individual Income Tax Returns) Here:
$74,325State:
$65,384
Salary/wage: $68,042 (reported on 87.8% of returns )Here:
$68,042State:
$52,524
(% of AGI for various income ranges: 77.6% for AGIs below $25k , 84.0% for AGIs $25k-50k , 83.3% for AGIs $50k-75k , 84.7% for AGIs $75k-100k , 85.4% for AGIs $100k-200k , 69.4% for AGIs over 200k ) Taxable interest for individuals: $1,066 (reported on 31.0% of returns )This zip code:
$1,066Texas:
$2,372
(% of AGI for various income ranges: 0.7% for AGIs below $25k , 0.4% for AGIs $25k-50k , 0.5% for AGIs $50k-75k , 0.3% for AGIs $75k-100k , 0.4% for AGIs $100k-200k , 0.5% for AGIs over 200k ) Ordinary dividends: $4,903 (reported on 18.4% of returns )(% of AGI for various income ranges: 1.2% for AGIs below $25k , 0.8% for AGIs $25k-50k , 0.7% for AGIs $50k-75k , 0.7% for AGIs $75k-100k , 0.7% for AGIs $100k-200k , 2.6% for AGIs over 200k ) Net capital gain/loss in AGI: +$15,887 (reported on 14.8% of returns )Here:
+$15,887State:
+$35,319
(% of AGI for various income ranges: 0.2% for AGIs $25k-50k , 0.2% for AGIs $50k-75k , 0.4% for AGIs $75k-100k , 0.6% for AGIs $100k-200k , 11.1% for AGIs over 200k ) Profit/loss from business: +$12,644 (reported on 19.6% of returns )Here:
+$12,644State:
+$13,732
(% of AGI for various income ranges: 11.1% for AGIs below $25k , 4.5% for AGIs $25k-50k , 3.6% for AGIs $50k-75k , 2.2% for AGIs $75k-100k , 2.8% for AGIs $100k-200k , 2.6% for AGIs over 200k ) Taxable individual retirement arrangement distribution: $19,705 (reported on 8.5% of returns )77388:
$19,705Texas:
$19,511
(% of AGI for various income ranges: 2.8% for AGIs below $25k , 2.1% for AGIs $25k-50k , 2.3% for AGIs $50k-75k , 2.7% for AGIs $75k-100k , 2.3% for AGIs $100k-200k , 1.8% for AGIs over 200k ) Self-employment retirement plans: $18,009 (reported on 0.6% of returns )77388:
$18,009Texas:
$23,938
(% of AGI for various income ranges: 0.2% for AGIs $50k-75k , 0.1% for AGIs $100k-200k , 0.3% for AGIs over 200k ) Total itemized deductions: $21,476 (18% of AGI, reported on 38.5% of returns )Here:
$21,476State:
$24,724
Here:
18.1% of AGIState:
15.9% of AGI
(% of AGI for various income ranges: 11.5% for AGIs below $25k , 12.6% for AGIs $25k-50k , 13.7% for AGIs $50k-75k , 16.4% for AGIs $75k-100k , 11.1% for AGIs $100k-200k , 6.6% for AGIs over 200k ) Charity contributions: $4,896 (reported on 30.8% of returns )(% of AGI for various income ranges: 0.9% for AGIs below $25k , 1.4% for AGIs $25k-50k , 2.1% for AGIs $50k-75k , 2.1% for AGIs $75k-100k , 2.3% for AGIs $100k-200k , 2.1% for AGIs over 200k ) Taxes paid: $6,011 (reported on 37.9% of returns )(% of AGI for various income ranges: 2.3% for AGIs below $25k , 3.0% for AGIs $25k-50k , 3.7% for AGIs $50k-75k , 3.7% for AGIs $75k-100k , 3.4% for AGIs $100k-200k , 2.2% for AGIs over 200k ) Earned income credit: $2,289 (reported on 13.1% of returns )(% of AGI for various income ranges: 6.1% for AGIs below $25k , 1.2% for AGIs $25k-50k ) Percentage of individuals using paid preparers for their 2012 taxes: 42.7%(% for various income ranges: 41.3% for AGIs below $25k , 43.7% for AGIs $25k-50k , 41.7% for AGIs $50k-75k , 40.6% for AGIs $75k-100k , 42.1% for AGIs $100k-200k , 58.2% for AGIs over 200k )
Averages for the 2004 tax year for zip code 77388, filed in 2005:
Average Adjusted Gross Income (AGI) in 2004: $60,155 (Individual Income Tax Returns) Here:
$60,155State:
$47,881
Salary/wage: $57,107 (reported on 89.0% of returns )Here:
$57,107State:
$41,947
(% of AGI for various income ranges: 125.9% for AGIs below $10k , 79.9% for AGIs $10k-25k , 85.2% for AGIs $25k-50k , 87.4% for AGIs $50k-75k , 88.2% for AGIs $75k-100k , 81.3% for AGIs over 100k ) Taxable interest for individuals: $1,244 (reported on 43.2% of returns )This zip code:
$1,244Texas:
$2,255
(% of AGI for various income ranges: 4.2% for AGIs below $10k , 2.2% for AGIs $10k-25k , 1.0% for AGIs $25k-50k , 0.8% for AGIs $50k-75k , 0.6% for AGIs $75k-100k , 0.8% for AGIs over 100k ) Taxable dividends: $1,891 (reported on 24.5% of returns )(% of AGI for various income ranges: 3.6% for AGIs below $10k , 1.2% for AGIs $10k-25k , 0.7% for AGIs $25k-50k , 0.7% for AGIs $50k-75k , 0.5% for AGIs $75k-100k , 0.8% for AGIs over 100k ) Net capital gain/loss: +$5,137 (reported on 20.6% of returns )Here:
+$5,137State:
+$16,110
(% of AGI for various income ranges: -2.6% for AGIs below $10k , -0.0% for AGIs $10k-25k , 0.1% for AGIs $25k-50k , 0.5% for AGIs $50k-75k , 0.5% for AGIs $75k-100k , 3.4% for AGIs over 100k ) Profit/loss from business: +$10,712 (reported on 20.3% of returns )Here:
+$10,712State:
+$11,013
(% of AGI for various income ranges: 5.7% for AGIs below $10k , 8.1% for AGIs $10k-25k , 3.7% for AGIs $25k-50k , 2.6% for AGIs $50k-75k , 2.4% for AGIs $75k-100k , 4.0% for AGIs over 100k ) IRA payment deduction: $3,363 (reported on 2.9% of returns )(% of AGI for various income ranges: 0.3% for AGIs below $10k , 0.2% for AGIs $10k-25k , 0.2% for AGIs $25k-50k , 0.2% for AGIs $50k-75k , 0.2% for AGIs $75k-100k , 0.1% for AGIs over 100k ) Self-employed pension: $13,389 (reported on 1.0% of returns )Here:
$13,389Texas:
$16,401
(% of AGI for various income ranges: 0.1% for AGIs $25k-50k , 0.1% for AGIs $50k-75k , 0.2% for AGIs $75k-100k , 0.4% for AGIs over 100k ) Total itemized deductions: $17,694 (20% of AGI, reported on 46.4% of returns )Here:
$17,694State:
$19,631
Here:
20.0% of AGIState:
18.9% of AGI
(% of AGI for various income ranges: 16.2% for AGIs below $10k , 13.5% for AGIs $10k-25k , 15.6% for AGIs $25k-50k , 16.5% for AGIs $50k-75k , 15.5% for AGIs $75k-100k , 11.3% for AGIs over 100k ) Charity contributions deductions: $3,558 (4% of AGI, reported on 39.3% of returns )Here:
3.8% of AGIState:
4.2% of AGI
(% of AGI for various income ranges: 0.9% for AGIs below $10k , 1.2% for AGIs $10k-25k , 1.8% for AGIs $25k-50k , 2.3% for AGIs $50k-75k , 2.5% for AGIs $75k-100k , 2.6% for AGIs over 100k ) Total tax: $9,388 (reported on 80.5% of returns )(% of AGI for various income ranges: 3.7% for AGIs below $10k , 4.7% for AGIs $10k-25k , 6.9% for AGIs $25k-50k , 8.6% for AGIs $50k-75k , 10.2% for AGIs $75k-100k , 17.5% for AGIs over 100k ) Earned income credit: $1,741 (reported on 9.4% of returns )Percentage of individuals using paid preparers for their 2004 taxes: 44.6%(% for various income ranges: 35.7% for AGIs below $10k , 50.1% for AGIs $10k-25k , 47.1% for AGIs $25k-50k , 45.5% for AGIs $50k-75k , 42.8% for AGIs $75k-100k , 46.1% for AGIs over 100k )
Estimated median household income in 2022: This zip code:
$98,567Texas:
$72,284
Nearest zip codes: 77068 ,
77090 ,
77379 ,
77380 ,
77014 ,
77389 .
Houston Zip Code Map
Percentage of family households: This zip code:
58.4%Texas:
50.5%
Percentage of households with unmarried partners: This zip code:
4.2%Texas:
48.7%
Likely homosexual households (counted as self-reported same-sex unmarried-partner households)
Lesbian couples: 0.1% of all households Gay men: 0.0% of all households
Household received Food Stamps/SNAP in the past 12 months: 1,229Household did not receive Food Stamps/SNAP in the past 12 months: 17,440
Women who had a birth in the past 12 months: 642 (631 now married , 21 unmarried) Women who did not have a birth in the past 12 months: 13,776 (5,733 now married , 8,053 unmarried)
Housing units in zip code 77388 with a mortgage: 9,047 (506
second mortgage , 344
both second mortgage and home equity loan )
Houses without a mortgage: 216
Median monthly owner costs for units with a mortgage: $1,889
Median monthly owner costs for units without a mortgage: $810
Residents with income below the poverty level in 2022:
This zip code:
9.7%Whole state:
14.0%
Residents with income below 50% of the poverty level in 2022:
This zip code:
3.8%Whole state:
7.4%
Median number of rooms in houses and condos: Median number of rooms in apartments: Notable locations in this zip code not listed on our city pages
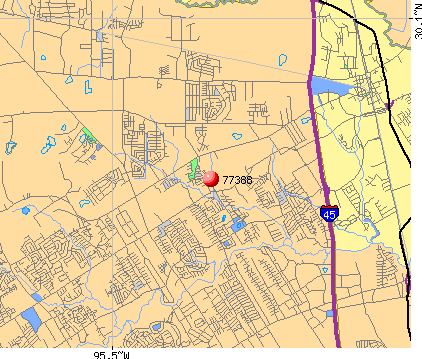
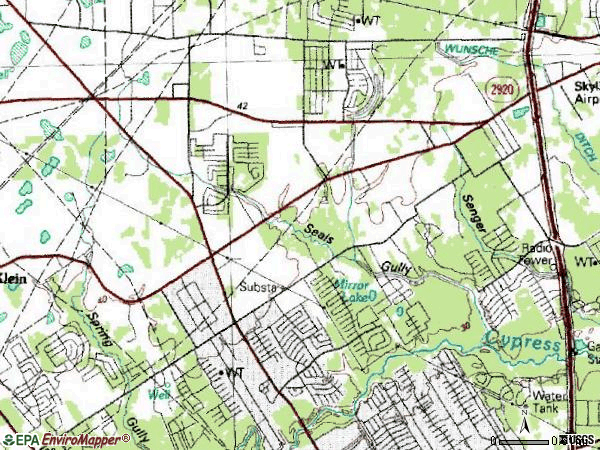
Click to draw/clear zip code borders Notable locations in zip code 77388: (A) , Spring Volunteer Fire Department Station 77 (B) , Ponderosa Volunteer Fire Department Station 2 (C) . Display/hide their locations on the map
Shopping Centers: (1) , Village Green Plaza Shopping Center (2) . Display/hide their locations on the map
Churches in zip code 77388 include: (A) , Bridgestone Baptist Church (B) , Saint Edwards Catholic Church (C) , Spring First Assembly of God Church (D) , Spring Forest Baptist Church (E) , Bethel Evangelical Lutheran Church (F) , Free Methodist Church (G) , First Assembly of God Church (H) , Assembly of God Churches (I) . Display/hide their locations on the map
Cemetery: (1) . Display/hide its location on the map
Lakes: (A) , Mirror Lake (B) . Display/hide their locations on the map
Parks in zip code 77388 include: (1) , Goodyear Blimp Park (2) , Enchanted Oaks Park (3) . Display/hide their locations on the map
Year house built (houses)
316 2020 or later4,424 2010 to 20195,497 2000 to 20091,942 1990 to 19993,037 1980 to 19893,220 1970 to 1979413 1960 to 1969197 1950 to 19590 1940 to 194954 1939 or earlier
Zip code 77388 household income distribution in 2022 730 Less than $10,000185 $10,000 to $14,999369 $15,000 to $19,999230 $20,000 to $24,999387 $25,000 to $29,999671 $30,000 to $34,999506 $35,000 to $39,999537 $40,000 to $44,999293 $45,000 to $49,9991,383 $50,000 to $59,9991,853 $60,000 to $74,9992,391 $75,000 to $99,9992,593 $100,000 to $124,9991,941 $125,000 to $149,9992,252 $150,000 to $199,9992,357 $200,000 or moreEstimate of home value of owner-occupied houses/condos in 2022 in zip code 77388 97 Less than $10,0008 $10,000 to $14,99971 $15,000 to $19,99948 $20,000 to $24,99925 $25,000 to $29,9999 $30,000 to $34,99935 $35,000 to $39,9996 $50,000 to $59,99930 $90,000 to $99,999172 $100,000 to $124,999149 $125,000 to $149,999818 $150,000 to $174,9991,284 $175,000 to $199,9993,213 $200,000 to $249,9993,425 $250,000 to $299,9992,222 $300,000 to $399,999707 $400,000 to $499,999548 $500,000 to $749,99960 $750,000 to $999,99960 $2,000,000 or moreRent paid by renters in 2022 in zip code 77388 16 $500 to $54954 $550 to $59946 $800 to $899102 $900 to $999907 $1,000 to $1,2491,080 $1,250 to $1,4992,458 $1,500 to $1,999794 $2,000 to $2,49957 $2,500 to $2,999107 $3,000 to $3,499156 No cash rent
Median gross rent in 2022: $1,804.
Median price asked for vacant for-sale houses and condos in 2022: $518,579.
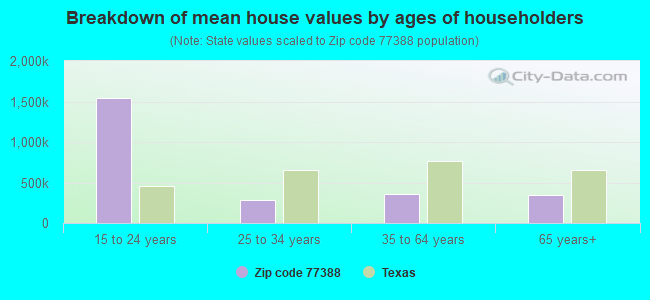
Estimated median house (or condo) value in 2022 for: White Non-Hispanic householders: $290,418Black or African American householders: $260,564American Indian or Alaska Native householders: $294,608Asian householders: $291,465Some other race householders: $220,759Two or more races householders: $266,587Hispanic or Latino householders: $246,161Estimated median house or condo value in 2022: $284,657
77388:
$284,657Texas:
$275,400
Lower value quartile - upper value quartile: $235,547 - $336,478
Mean price in 2022: Detached houses: $358,881Here:
$358,881State:
$369,058
Mobile homes: $20,129Here:
$20,129State:
$124,413
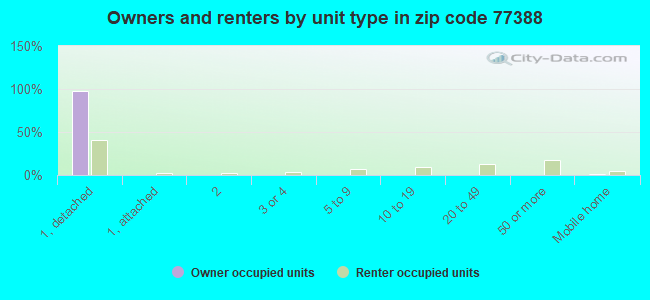
Housing units in structures:
One, detached: 15,627One, attached: 162Two: 1173 or 4: 2365 to 9: 35910 to 19: 58520 to 49: 66750 or more: 1,077Mobile homes: 392Boats, RVs, vans, etc.: 21Unemployment : 4.9%
Means of transportation to work in zip code 77388 74.0% 19,988 Drove a car alone8.3% 2,248 Carpooled0.5% 127 Bus or trolley bus0.0% 10 Subway or elevated0.3% 69 Taxi0.4% 97 Motorcycle1.1% 291 Walked0.8% 218 Other means14.5% 3,929 Worked at homeTravel time to work (commute) in zip code 77388 264 Less than 5 minutes1,472 5 to 9 minutes2,473 10 to 14 minutes2,617 15 to 19 minutes3,325 20 to 24 minutes1,275 25 to 29 minutes3,707 30 to 34 minutes1,260 35 to 39 minutes1,392 40 to 44 minutes3,159 45 to 59 minutes1,839 60 to 89 minutes302 90 or more minutes
Percentage of zip code residents living and working in this county: 86.5%
Household type by relationship:
Households: 53,528
Male householders: 9,666 (1,391 living alone ), Female householders: 9,049 (2,263 living alone )9,843 spouses (9,795 opposite-sex spouses ), 1,470 unmarried partners , (1,448 opposite-sex unmarried partners ), 18,376 children (17,356 natural , 345 adopted , 673 stepchildren ), 715 grandchildren , 926 brothers or sisters , 957 parents , 38 foster children , 772 other relatives , 1,520 non-relatives In group quarters: 61 (-1 institutionalized population )
Size of family households: 4,479 2-persons , 3,421 3-persons , 3,620 4-persons , 1,389 5-persons , 688 6-persons , 166 7-or-more-persons
Size of nonfamily households: 3,653 1-person , 1,096 2-persons , 30 3-persons , 61 4-persons , 7 5-persons , 19 6-persons
9,863 married couples with children. single-parent households (1,480 men , 2,158 women ).
73.4% of residents of 77388 zip code speak English at home. of residents speak Spanish at home (73% very well, 16% well, 6% not well, 5% not at all ).of residents speak other Indo-European language at home (86% very well, 4% well, 9% not well, 1% not at all ).of residents speak Asian or Pacific Island language at home (53% very well, 30% well, 16% not well, 1% not at all ).of residents speak other language at home (100% very well ).
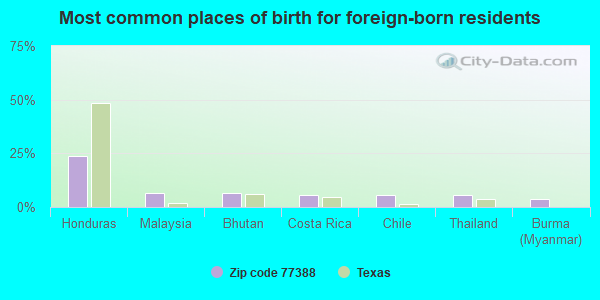
Foreign born population: 8,274 (15.5%)
(62.2%
of them are naturalized citizens )
This zip code:
15.5%Whole state:
17.2%
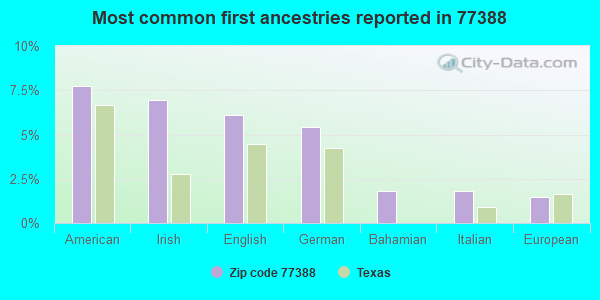
24% Honduras 7% Malaysia 6% Bhutan 6% Costa Rica 6% Chile 5% Thailand 4% Burma (Myanmar) 8% American 7% Irish 6% English 5% German 2% Bahamian 2% Italian 1% European
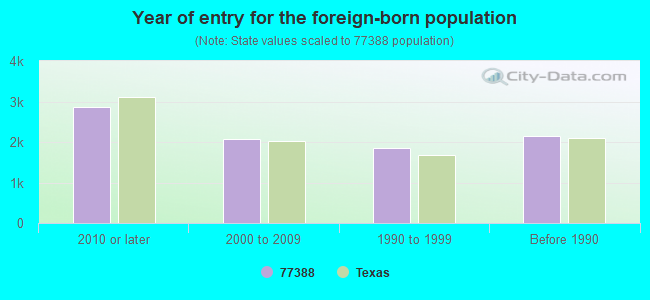
Year of entry for the foreign-born population
2,867 2010 or later 2,063 2000 to 2009 1,847 1990 to 1999 2,154 Before 1990
There are
66 Medical Specialists in Zip Code 77388 .
Facilities with environmental interests located in this zip code:
AUTOTAINMENT PARTNER LP DBA PLANET FORD (20403 INTERSTATE 45 N in SPRING, TX)
(Resource Conservation and Recovery Act (tracking hazardous waste)) Alternative names: CONAWAY FLOECK FORD
ATLAS TRANSMISSION INC (1816 SPRING CYPRESS RD in SPRING, TX)
(Resource Conservation and Recovery Act (tracking hazardous waste)) Business NAICS classification: AUTOMOTIVE TRANSMISSION REPAIR.
Housing units lacking complete plumbing facilities: 0.5%
Housing units lacking complete kitchen facilities: 1.2%
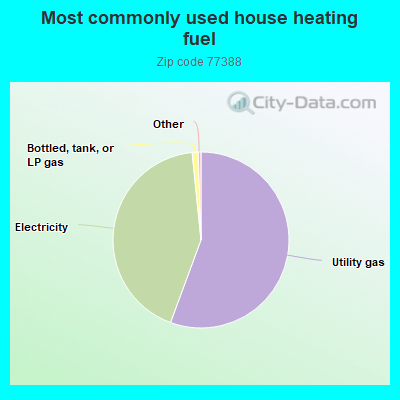
55.7% Utility gas 42.8% Electricity 1.1% Bottled, tank, or LP gas
Population in 1990: 21,805. Population change in the 1990s: +4,818 (+22.1%).
Place of birth for U.S.-born residents:
This state: 27,744Northeast: 2,528Midwest: 5,443South: 5,889West: 3,014
57% of the 77388 zip code residents lived in the same house 5 years ago.
Out of people who lived in different houses, 66% lived in this county.
Out of people who lived in different counties, 50% lived in Texas.
88% of the 77388 zip code residents lived in the same house 1 year ago.
Out of people who lived in different houses, 57% moved from this county.
Out of people who lived in different houses, 17% moved from different county within same state.
Out of people who lived in different houses, 18% moved from different state.
Out of people who lived in different houses, 8% moved from abroad.
Private vs. public school enrollment:
Students in private schools in grades 1 to 8 (elementary and middle school): 484
Students in private schools in grades 9 to 12 (high school): 325
Students in private undergraduate colleges: 192
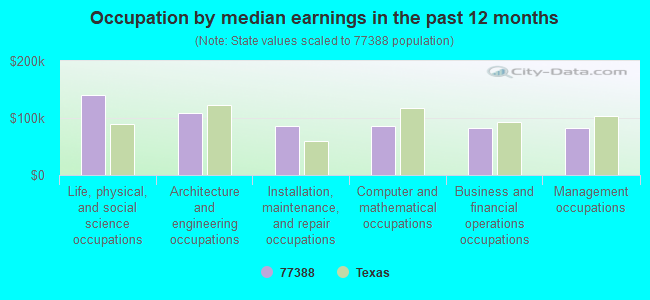
Occupation by median earnings in the past 12 months ($)
139,830 Life, physical, and social science occupations 108,644 Architecture and engineering occupations 85,756 Installation, maintenance, and repair occupations 85,288 Computer and mathematical occupations 83,107 Business and financial operations occupations 82,527 Management occupations
Companies with federal contracts located in this zip code:
BRANDAMAR INC (2530 OLD LOUETTA LOOP # 12 in SPRING, TX; small business) in 252 contracts from 1999 to 2006
Contracts for Cable, Cord, and Wire Assemblies: Communications Equipment, Hardware, Commercial, Engine Fuel System Components, Nonaircraft, Electric Lamps, and more by Navy, Defense Logistics Agency, U.S. Coast Guard, Army, and others Signed by year: 2000: $114,600; 2001: $130,536; 2002: $173,129; 2003: $120,096; 2004: $1,264,738; 2005: $1,058,477; 2006: $1,012,776.
Biggest contracts: with Navy for Cable, Cord, and Wire Assemblies: Communications Equipment. Signed on 2006-03-02. Completion date: 2006-10-12.
with Defense Logistics Agency for Hardware, Commercial. Signed on 2006-02-10. Completion date: 2006-05-30.
with Defense Logistics Agency for Engine Fuel System Components, Nonaircraft. Signed on 2004-03-19. Completion date: 2004-06-17.
, same as above. Signed on 2004-05-11. Completion date: 2004-08-05.
Top industries in this zip code by the number of employees in 2005:
Construction: Poured Concrete Foundation and Structure Contractors (500-999 employees: 1 establishment, 5-9 employees: 1 establishment, 1-4 employees: 2 establishments)Health Care and Social Assistance: Ambulance Services (500-999: 1)Construction: Electrical Contractors (100-249: 1, 20-49: 2, 5-9: 1, 1-4: 2)Other Services (except Public Administration): Religious Organizations (50-99: 1, 20-49: 3, 10-19: 1, 5-9: 4, 1-4: 2)Accommodation and Food Services: Limited-Service Restaurants (20-49: 4, 10-19: 3, 5-9: 2, 1-4: 4)Accommodation and Food Services: Full-Service Restaurants (50-99: 1, 20-49: 2, 10-19: 2, 5-9: 1, 1-4: 3)Construction: Commercial and Institutional Building Construction (20-49: 2, 10-19: 2, 5-9: 2, 1-4: 5)Health Care and Social Assistance: Child Day Care Services (20-49: 1, 10-19: 4, 5-9: 1, 1-4: 3)
People in group quarters in 2010:
34 people in other noninstitutional facilities
6 people in nursing facilities/skilled-nursing facilities
People in group quarters in 2000:
12 people in homes or halfway houses for drug/alcohol abuse
4 people in nursing homes
3 people in other group homes
Fatal accident statistics in 2014:
Fatal accident count: 3Vehicles involved in fatal accidents: 5Fatal accidents caused by drunken drivers: 3Fatalities: 3Persons involved in fatal accidents: 7Pedestrians involved in fatal accidents: 0
Fatal accident statistics in 2013:
Fatal accident count: 2Vehicles involved in fatal accidents: 3Fatal accidents caused by drunken drivers: 0Fatalities: 2Persons involved in fatal accidents: 8Pedestrians involved in fatal accidents: 0
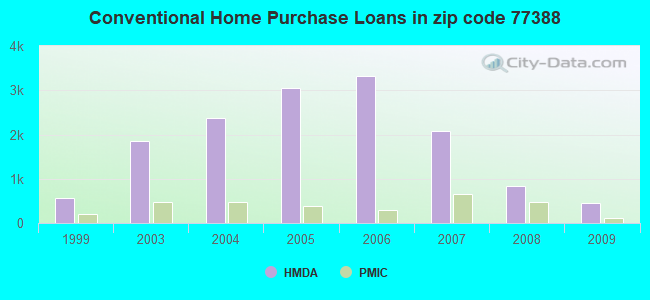
Home Mortgage Disclosure Act Aggregated Statistics For Year 2009(Based on 8 full tracts) A) FHA, FSA/RHS & VA B) Conventional C) Refinancings D) Home Improvement Loans E) Loans on Dwellings For 5+ Families F) Non-occupant Loans on G) Loans On Manufactured Number Average Value Number Average Value Number Average Value Number Average Value Number Average Value Number Average Value Number Average Value
LOANS ORIGINATED 629 $140,297 452 $136,152 1,025 $139,325 66 $34,060 2 $5,584,070 68 $105,576 2 $29,880 APPLICATIONS APPROVED, NOT ACCEPTED 28 $139,414 24 $178,974 117 $146,073 14 $27,792 0 $0 6 $57,423 0 $0 APPLICATIONS DENIED 80 $149,725 86 $128,027 478 $136,761 125 $34,878 0 $0 30 $80,355 0 $0 APPLICATIONS WITHDRAWN 68 $202,704 64 $158,443 335 $145,137 32 $72,051 0 $0 12 $106,742 2 $49,800 FILES CLOSED FOR INCOMPLETENESS 8 $212,755 6 $91,695 104 $137,114 16 $48,393 0 $0 4 $107,758 0 $0
Aggregated Statistics For Year 2008(Based on 8 full tracts) A) FHA, FSA/RHS & VA B) Conventional C) Refinancings D) Home Improvement Loans F) Non-occupant Loans on G) Loans On Manufactured Number Average Value Number Average Value Number Average Value Number Average Value Number Average Value Number Average Value
LOANS ORIGINATED 499 $145,289 828 $144,754 530 $132,892 114 $37,169 149 $105,678 2 $8,965 APPLICATIONS APPROVED, NOT ACCEPTED 38 $168,321 119 $147,995 127 $119,919 38 $21,221 22 $112,401 0 $0 APPLICATIONS DENIED 88 $144,369 163 $121,372 647 $130,729 225 $34,121 64 $110,703 4 $36,355 APPLICATIONS WITHDRAWN 86 $150,647 123 $153,244 253 $133,725 32 $41,981 16 $90,146 2 $19,920 FILES CLOSED FOR INCOMPLETENESS 12 $167,459 30 $159,369 62 $122,011 4 $117,030 8 $142,594 0 $0
Aggregated Statistics For Year 2007(Based on 8 full tracts) A) FHA, FSA/RHS & VA B) Conventional C) Refinancings D) Home Improvement Loans F) Non-occupant Loans on G) Loans On Manufactured Number Average Value Number Average Value Number Average Value Number Average Value Number Average Value Number Average Value
LOANS ORIGINATED 227 $146,818 2,090 $125,846 669 $121,419 211 $41,786 253 $97,216 14 $56,454 APPLICATIONS APPROVED, NOT ACCEPTED 12 $155,082 334 $111,879 175 $119,788 78 $40,678 56 $96,208 20 $48,982 APPLICATIONS DENIED 50 $143,743 533 $129,395 940 $132,147 327 $45,760 102 $98,489 14 $53,492 APPLICATIONS WITHDRAWN 42 $125,880 312 $124,918 368 $123,767 38 $62,279 48 $111,348 4 $63,170 FILES CLOSED FOR INCOMPLETENESS 2 $130,475 110 $157,540 121 $147,173 8 $56,075 8 $112,445 0 $0
Aggregated Statistics For Year 2006(Based on 8 full tracts) A) FHA, FSA/RHS & VA B) Conventional C) Refinancings D) Home Improvement Loans F) Non-occupant Loans on G) Loans On Manufactured Number Average Value Number Average Value Number Average Value Number Average Value Number Average Value Number Average Value
LOANS ORIGINATED 167 $148,018 3,312 $103,606 715 $108,367 231 $33,959 496 $89,226 14 $32,816 APPLICATIONS APPROVED, NOT ACCEPTED 18 $130,613 645 $107,498 149 $106,303 54 $27,963 80 $117,076 24 $65,274 APPLICATIONS DENIED 30 $131,395 745 $107,852 818 $116,348 315 $37,009 151 $81,988 20 $38,366 APPLICATIONS WITHDRAWN 54 $144,408 490 $110,084 490 $125,329 54 $50,312 100 $104,279 0 $0 FILES CLOSED FOR INCOMPLETENESS 12 $152,620 153 $126,097 199 $127,860 4 $22,495 32 $104,076 0 $0
Aggregated Statistics For Year 2005(Based on 8 full tracts) A) FHA, FSA/RHS & VA B) Conventional C) Refinancings D) Home Improvement Loans F) Non-occupant Loans on G) Loans On Manufactured Number Average Value Number Average Value Number Average Value Number Average Value Number Average Value Number Average Value
LOANS ORIGINATED 280 $137,592 3,054 $99,635 1,046 $106,393 207 $56,237 281 $99,332 10 $43,526 APPLICATIONS APPROVED, NOT ACCEPTED 10 $164,958 380 $91,928 199 $110,204 84 $32,538 52 $80,301 20 $50,313 APPLICATIONS DENIED 28 $143,041 709 $95,342 1,082 $112,242 275 $33,979 115 $84,274 30 $45,409 APPLICATIONS WITHDRAWN 24 $143,145 488 $106,846 524 $130,172 112 $252,912 64 $84,935 0 $0 FILES CLOSED FOR INCOMPLETENESS 4 $194,278 121 $109,006 498 $130,132 6 $29,893 18 $91,778 0 $0
Aggregated Statistics For Year 2004(Based on 8 full tracts) A) FHA, FSA/RHS & VA B) Conventional C) Refinancings D) Home Improvement Loans F) Non-occupant Loans on G) Loans On Manufactured Number Average Value Number Average Value Number Average Value Number Average Value Number Average Value Number Average Value
LOANS ORIGINATED 297 $130,216 2,365 $101,680 1,514 $108,435 193 $43,902 245 $88,846 4 $65,735 APPLICATIONS APPROVED, NOT ACCEPTED 14 $127,321 408 $98,430 307 $100,949 48 $46,293 52 $91,420 14 $35,284 APPLICATIONS DENIED 46 $123,644 498 $96,529 1,167 $105,099 295 $43,158 94 $91,634 26 $39,541 APPLICATIONS WITHDRAWN 30 $139,202 324 $118,302 629 $112,005 28 $52,274 38 $105,084 2 $79,680 FILES CLOSED FOR INCOMPLETENESS 4 $117,288 84 $99,958 482 $114,839 12 $34,586 12 $96,562 0 $0
Aggregated Statistics For Year 2003(Based on 8 full tracts) A) FHA, FSA/RHS & VA B) Conventional C) Refinancings D) Home Improvement Loans F) Non-occupant Loans on Number Average Value Number Average Value Number Average Value Number Average Value Number Average Value
LOANS ORIGINATED 351 $126,234 1,851 $106,735 3,684 $104,986 183 $28,773 189 $79,390 APPLICATIONS APPROVED, NOT ACCEPTED 18 $149,276 231 $101,142 565 $104,351 70 $35,238 36 $91,776 APPLICATIONS DENIED 54 $125,718 293 $129,120 1,671 $98,275 195 $31,489 52 $91,902 APPLICATIONS WITHDRAWN 48 $128,858 251 $107,754 924 $105,262 14 $37,249 24 $78,112 FILES CLOSED FOR INCOMPLETENESS 6 $129,487 90 $117,773 161 $105,871 8 $41,146 4 $87,025
Aggregated Statistics For Year 1999(Based on 2 full and 1 partial tracts) A) FHA, FSA/RHS & VA B) Conventional C) Refinancings D) Home Improvement Loans E) Loans on Dwellings For 5+ Families F) Non-occupant Loans on Number Average Value Number Average Value Number Average Value Number Average Value Number Average Value Number Average Value
LOANS ORIGINATED 151 $102,889 567 $103,419 265 $84,471 93 $24,088 0 $0 32 $67,179 APPLICATIONS APPROVED, NOT ACCEPTED 3 $103,293 93 $81,722 63 $77,018 26 $60,064 0 $0 7 $64,670 APPLICATIONS DENIED 12 $100,318 154 $74,811 106 $62,746 46 $19,233 1 $9,890 13 $52,659 APPLICATIONS WITHDRAWN 10 $99,890 87 $113,531 104 $77,201 8 $28,682 0 $0 8 $61,694 FILES CLOSED FOR INCOMPLETENESS 2 $83,065 28 $124,902 47 $76,315 2 $14,765 0 $0 0 $0
Detailed HMDA statistics for the following Tracts:
5534.00
,
5535.00 ,
5550.00 ,
5551.00
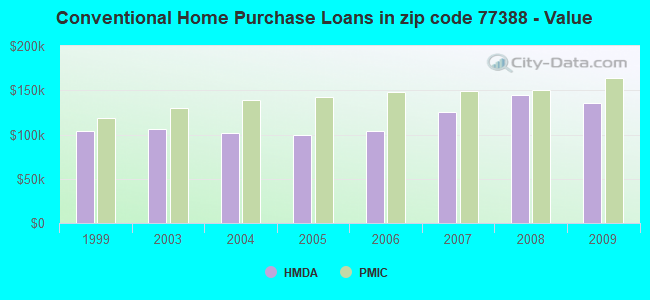
Private Mortgage Insurance Companies Aggregated Statistics For Year 2009(Based on 8 full tracts) A) Conventional B) Refinancings C) Non-occupant Loans on Number Average Value Number Average Value Number Average Value
LOANS ORIGINATED 103 $163,431 60 $164,968 0 $0 APPLICATIONS APPROVED, NOT ACCEPTED 22 $142,564 44 $175,144 2 $70,495 APPLICATIONS DENIED 12 $157,450 12 $198,822 0 $0 APPLICATIONS WITHDRAWN 2 $134,975 16 $198,951 0 $0 FILES CLOSED FOR INCOMPLETENESS 4 $168,822 6 $149,387 2 $85,985
Aggregated Statistics For Year 2008(Based on 8 full tracts) A) Conventional B) Refinancings C) Non-occupant Loans on D) Loans On Manufactured Number Average Value Number Average Value Number Average Value Number Average Value
LOANS ORIGINATED 468 $150,326 86 $146,968 60 $116,791 2 $127,490 APPLICATIONS APPROVED, NOT ACCEPTED 125 $149,999 42 $159,896 12 $119,523 2 $130,475 APPLICATIONS DENIED 28 $144,222 20 $161,917 16 $117,060 0 $0 APPLICATIONS WITHDRAWN 18 $171,572 4 $157,928 4 $139,492 0 $0 FILES CLOSED FOR INCOMPLETENESS 10 $112,079 6 $134,950 10 $103,319 0 $0
Aggregated Statistics For Year 2007(Based on 8 full tracts) A) Conventional B) Refinancings C) Non-occupant Loans on Number Average Value Number Average Value Number Average Value
LOANS ORIGINATED 661 $148,884 106 $149,255 66 $123,972 APPLICATIONS APPROVED, NOT ACCEPTED 80 $163,425 38 $148,993 16 $135,321 APPLICATIONS DENIED 8 $170,736 4 $175,295 0 $0 APPLICATIONS WITHDRAWN 30 $140,302 14 $150,156 4 $122,775 FILES CLOSED FOR INCOMPLETENESS 0 $0 0 $0 0 $0
Aggregated Statistics For Year 2006(Based on 8 full tracts) A) Conventional B) Refinancings C) Non-occupant Loans on Number Average Value Number Average Value Number Average Value
LOANS ORIGINATED 295 $148,186 38 $144,639 28 $119,324 APPLICATIONS APPROVED, NOT ACCEPTED 44 $144,838 16 $120,914 2 $165,800 APPLICATIONS DENIED 4 $123,975 2 $117,530 0 $0 APPLICATIONS WITHDRAWN 12 $185,631 2 $164,340 0 $0 FILES CLOSED FOR INCOMPLETENESS 2 $144,970 0 $0 0 $0
Aggregated Statistics For Year 2005(Based on 8 full tracts) A) Conventional B) Refinancings C) Non-occupant Loans on Number Average Value Number Average Value Number Average Value
LOANS ORIGINATED 374 $142,242 64 $133,936 42 $121,360 APPLICATIONS APPROVED, NOT ACCEPTED 84 $150,962 28 $127,587 14 $106,300 APPLICATIONS DENIED 10 $137,676 0 $0 2 $84,985 APPLICATIONS WITHDRAWN 24 $137,494 12 $125,490 4 $79,432 FILES CLOSED FOR INCOMPLETENESS 0 $0 0 $0 0 $0
Aggregated Statistics For Year 2004(Based on 8 full tracts) A) Conventional B) Refinancings C) Non-occupant Loans on Number Average Value Number Average Value Number Average Value
LOANS ORIGINATED 474 $139,453 114 $124,883 34 $106,351 APPLICATIONS APPROVED, NOT ACCEPTED 100 $139,532 74 $135,924 16 $100,057 APPLICATIONS DENIED 8 $111,352 0 $0 0 $0 APPLICATIONS WITHDRAWN 28 $155,732 16 $157,523 0 $0 FILES CLOSED FOR INCOMPLETENESS 2 $115,165 20 $84,983 0 $0
Aggregated Statistics For Year 2003(Based on 8 full tracts) A) Conventional B) Refinancings C) Non-occupant Loans on Number Average Value Number Average Value Number Average Value
LOANS ORIGINATED 482 $130,479 301 $135,726 38 $100,327 APPLICATIONS APPROVED, NOT ACCEPTED 118 $134,176 86 $141,021 2 $135,020 APPLICATIONS DENIED 20 $132,776 4 $142,428 4 $123,348 APPLICATIONS WITHDRAWN 38 $126,703 18 $119,152 6 $121,392 FILES CLOSED FOR INCOMPLETENESS 14 $122,158 0 $0 0 $0
Aggregated Statistics For Year 1999(Based on 2 full and 1 partial tracts) A) Conventional B) Refinancings C) Non-occupant Loans on Number Average Value Number Average Value Number Average Value
LOANS ORIGINATED 202 $119,003 45 $101,995 5 $60,748 APPLICATIONS APPROVED, NOT ACCEPTED 25 $138,597 15 $113,789 0 $0 APPLICATIONS DENIED 13 $135,115 3 $88,860 0 $0 APPLICATIONS WITHDRAWN 12 $134,167 3 $210,833 0 $0 FILES CLOSED FOR INCOMPLETENESS 1 $188,820 1 $122,790 0 $0
Detailed PMIC statistics for the following Tracts:
5534.00
,
5535.00 ,
5550.00 ,
5551.00
2002 - 2018 National Fire Incident Reporting System (NFIRS) incidents See full 2006 National Fire Incident Reporting System statistics for zip code 77388, Texas
Most common first names in zip code 77388 among deceased individuals Name Count Lived (average)
Mary 47 80.7 years John 41 70.9 years James 36 69.0 years Robert 36 71.9 years William 32 73.6 years Charles 20 71.4 years Dorothy 20 80.1 years Donald 19 66.9 years Marie 18 81.3 years George 16 77.9 years
Most common last names in zip code 77388 among deceased individuals Last name Count Lived (average)
Smith 23 71.0 years Johnson 17 74.5 years Lewis 11 72.5 years Brown 10 61.7 years Clark 9 77.5 years Williams 9 71.6 years Evans 8 74.7 years Miller 8 76.2 years Harris 7 74.4 years Davis 7 70.7 years
Businesses in zip code 77388
Name Count Name Count
Ace Hardware 1 Long John Silver's 1 Advance Auto Parts 1 Lowe's 1 AutoZone 1 MasterBrand Cabinets 4 Blockbuster 1 McDonald's 3 CVS 2 Motel 6 1 Catherines 1 Office Depot 1 Chick-Fil-A 1 Panda Express 1 Church's Chicken 1 Payless 1 Cricket Wireless 3 Pizza Hut 1 Curves 1 Popeyes 1 DHL 3 Quiznos 1 Decora Cabinetry 2 SONIC Drive-In 1 Dennys 1 Sears 1 FedEx 6 Sprint Nextel 2 Firestone Complete Auto Care 1 Starbucks 3 GameStop 1 T-Mobile 1 H&R Block 1 Target 1 Jack In The Box 2 U-Haul 3 Jones New York 1 UPS 4 KFC 1 Vans 1 LA Fitness 1 Verizon Wireless 2 Lane Bryant 1 Walgreens 2 Little Caesars Pizza 1 Wendy's 1


 Nearest zip codes: 77068, 77090, 77379, 77380, 77014, 77389.
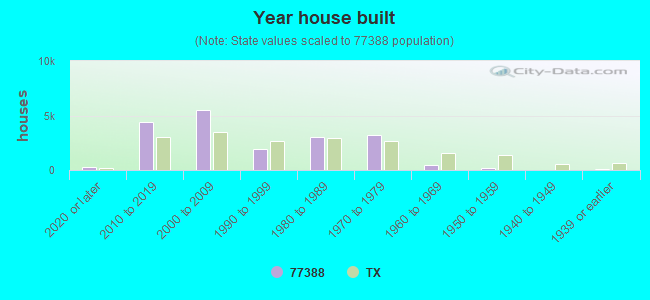


 According to the data from the years 2002 - 2018 the average number of fire incidents per year is 137. The highest number of fires - 223 took place in 2008, and the least - 62 in 2002. The data has an increasing trend.
 When looking into fire subcategories, the most incidents belonged to: Outside Fires (44.5%), and Structure Fires (35.3%).