Estimated zip code population in 2022: 2,251 Zip code population in 2010: 1,657 Zip code population in 2000: 1,649
Houses and condos: 931 Renter-occupied apartments: 122
% of renters here:
14%
State:
38%
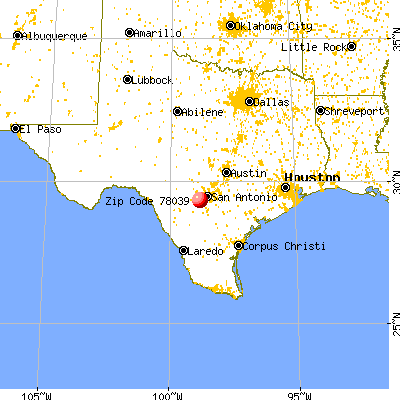
March 2022 cost of living index in zip code 78039: 78.0 (low, U.S. average is 100)
Land area: 18.4 sq. mi. Water area: 0.1 sq. mi.
Population density: 123 people per square mile
(very low).
OSM Map
General Map
Google Map
MSN Map
OSM Map
General Map
Google Map
MSN Map
OSM Map
General Map
Google Map
MSN Map
OSM Map
General Map
Google Map
MSN Map
Please wait while loading the map...
Real estate property taxes paid for housing units in 2022:
This zip code:
1.5% ($1,459)
Texas:
1.5% ($4,050)
Median real estate property taxes paid for housing units with mortgages in 2022: $5,183 (1.4%) Median real estate property taxes paid for housing units with no mortgage in 2022: $1,308 (1.7%)
Business Search- 14 Million verified businesses
Males: 978
(43.5%)
Females: 1,273
(56.5%)
For population 25 years and over in 78039:
High school or higher: 91.2%
Bachelor's degree or higher: 20.0%
Graduate or professional degree: 5.5%
Unemployed: 0.2%
Mean travel time to work (commute): 27.4 minutes
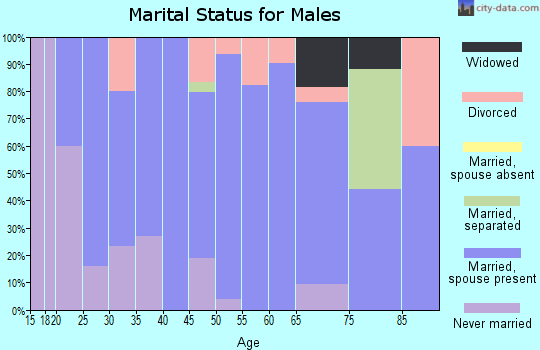
For population 15 years and over in 78039:
Never married: 32.8%
Now married: 45.8%
Separated: 1.2%
Widowed: 10.9%
Divorced: 9.4%
Zip code 78039 compared to state average:
Median house value significantly below state average.
Unemployed percentage significantly below state average.
Black race population percentage significantly below state average.
Median age significantly above state average.
Foreign-born population percentage significantly below state average.
Renting percentage significantly below state average.
Length of stay since moving in significantly above state average.
Averages for the 2020 tax year for zip code 78039, filed in 2021:
Average Adjusted Gross Income (AGI) in 2020: $56,661 (Individual Income Tax Returns)
Here:
$56,661
State:
$77,054
Salary/wage: $49,977 (reported on 80.5% of returns)
Here:
$49,977
State:
$62,766
(% of AGI for various income ranges: 1334.5% for AGIs below $25k, 3585.0% for AGIs $25k-50k, 6588.0% for AGIs $50k-75k, 8551.7% for AGIs $75k-100k, 23571.7% for AGIs $100k-200k)
Taxable interest for individuals: $1,132 (reported on 25.3% of returns)
This zip code:
$1,132
Texas:
$2,665
(% of AGI for various income ranges: 28.5% for AGIs below $25k, 40.6% for AGIs $25k-50k, 22.0% for AGIs $50k-75k, 33.3% for AGIs $75k-100k, 128.3% for AGIs $100k-200k)
Ordinary dividends: $1,956 (reported on 10.3% of returns)
Here:
$1,956
State:
$10,044
(% of AGI for various income ranges: 14.0% for AGIs below $25k, 41.0% for AGIs $50k-75k, 178.3% for AGIs $100k-200k)
Net capital gain/loss in AGI: +$6,944 (reported on 10.3% of returns)
Here:
+$6,944
State:
+$39,590
(% of AGI for various income ranges: 18.0% for AGIs below $25k, 46.0% for AGIs $50k-75k, 905.0% for AGIs $100k-200k)
Profit/loss from business: +$4,950 (reported on 16.1% of returns)
Here:
+$4,950
State:
+$10,888
(% of AGI for various income ranges: 113.5% for AGIs below $25k, 105.6% for AGIs $25k-50k, 150.0% for AGIs $50k-75k, 210.0% for AGIs $100k-200k)
Taxable individual retirement arrangement distribution: $11,900 (reported on 5.7% of returns)
78039:
$11,900
Texas:
$24,740
(% of AGI for various income ranges: 91.0% for AGIs below $25k, 688.3% for AGIs $75k-100k)
Total itemized deductions: $45,300 (reported on 2.3% of returns)
Here:
$45,300
State:
$40,428
(% of AGI for various income ranges: 906.0% for AGIs $50k-75k)
Taxes paid: $6,950 (reported on 2.3% of returns)
78039:
$6,950
State:
$7,821
(% of AGI for various income ranges: 139.0% for AGIs $50k-75k)
Earned income credit: $2,636 (reported on 16.1% of returns)
Here:
$2,636
State:
$2,584
(% of AGI for various income ranges: 113.5% for AGIs below $25k, 78.9% for AGIs $25k-50k)
Percentage of individuals using paid preparers for their 2020 taxes: 87.4%
Here:
87%
State:
92%
(% for various income ranges: 82.8% for AGIs below $25k, 87.5% for AGIs $25k-50k, 92.9% for AGIs $50k-75k, 87.5% for AGIs $75k-100k, 110.0% for AGIs $100k-200k, 0.0% for AGIs over 200k)
Averages for the 2012 tax year for zip code 78039, filed in 2013:
Average Adjusted Gross Income (AGI) in 2012: $41,591 (Individual Income Tax Returns)
Here:
$41,591
State:
$65,384
Salary/wage: $37,856 (reported on 83.0% of returns)
Here:
$37,856
State:
$52,524
(% of AGI for various income ranges: 73.2% for AGIs below $25k, 82.5% for AGIs $25k-50k, 72.2% for AGIs $50k-75k, 77.1% for AGIs $75k-100k, 72.2% for AGIs $100k-200k)
Taxable interest for individuals: $785 (reported on 29.5% of returns)
This zip code:
$785
Texas:
$2,372
(% of AGI for various income ranges: 0.7% for AGIs below $25k, 0.5% for AGIs $25k-50k, 0.5% for AGIs $50k-75k, 1.1% for AGIs $75k-100k, 0.3% for AGIs $100k-200k)
Ordinary dividends: $1,511 (reported on 10.2% of returns)
Here:
$1,511
State:
$9,721
(% of AGI for various income ranges: 1.3% for AGIs below $25k, 0.6% for AGIs $50k-75k, 0.4% for AGIs $100k-200k)
Net capital gain/loss in AGI: +$880 (reported on 5.7% of returns)
Here:
+$880
State:
+$35,319
Profit/loss from business: +$4,879 (reported on 15.9% of returns)
Here:
+$4,879
State:
+$13,732
(% of AGI for various income ranges: 6.5% for AGIs below $25k, 4.0% for AGIs $25k-50k, 0.9% for AGIs $75k-100k)
Taxable individual retirement arrangement distribution: $7,783 (reported on 6.8% of returns)
78039:
$7,783
Texas:
$19,511
Total itemized deductions: $16,775 (21% of AGI, reported on 13.6% of returns)
Here:
$16,775
State:
$24,724
Here:
20.8% of AGI
State:
15.9% of AGI
(% of AGI for various income ranges: 7.6% for AGIs $25k-50k, 11.3% for AGIs $50k-75k, 5.9% for AGIs $100k-200k)
Charity contributions: $2,378 (reported on 10.2% of returns)
Here:
$2,378
State:
$6,808
(% of AGI for various income ranges: 0.7% for AGIs below $25k, 1.4% for AGIs $50k-75k, 0.8% for AGIs $100k-200k)
Taxes paid: $3,992 (reported on 13.6% of returns)
78039:
$3,992
State:
$6,921
(% of AGI for various income ranges: 1.3% for AGIs $25k-50k, 3.1% for AGIs $50k-75k, 1.6% for AGIs $100k-200k)
Earned income credit: $2,105 (reported on 22.7% of returns)
Here:
$2,105
State:
$2,570
(% of AGI for various income ranges: 6.6% for AGIs below $25k, 1.4% for AGIs $25k-50k)
Percentage of individuals using paid preparers for their 2012 taxes: 47.7%
Here:
48%
State:
51%
(% for various income ranges: 46.2% for AGIs below $25k, 41.7% for AGIs $25k-50k, 60.0% for AGIs $50k-75k, 42.9% for AGIs $75k-100k, 62.5% for AGIs $100k-200k)
Averages for the 2004 tax year for zip code 78039, filed in 2005:
Average Adjusted Gross Income (AGI) in 2004: $35,078 (Individual Income Tax Returns)
Here:
$35,078
State:
$47,881
Salary/wage: $31,808 (reported on 82.8% of returns)
Here:
$31,808
State:
$41,947
(% of AGI for various income ranges: 88.6% for AGIs below $10k, 75.4% for AGIs $10k-25k, 81.6% for AGIs $25k-50k, 79.0% for AGIs $50k-75k, 77.7% for AGIs $75k-100k, 56.9% for AGIs over 100k)
Taxable interest for individuals: $966 (reported on 36.3% of returns)
This zip code:
$966
Texas:
$2,255
(% of AGI for various income ranges: 5.4% for AGIs below $10k, 1.5% for AGIs $10k-25k, 0.9% for AGIs $25k-50k, 1.0% for AGIs $50k-75k, 0.4% for AGIs $75k-100k, 0.7% for AGIs over 100k)
Taxable dividends: $804 (reported on 12.4% of returns)
Here:
$804
State:
$4,261
(% of AGI for various income ranges: 1.5% for AGIs below $10k, 0.5% for AGIs $10k-25k, 0.2% for AGIs $25k-50k, 0.3% for AGIs $50k-75k, 0.3% for AGIs $75k-100k, 0.1% for AGIs over 100k)
Net capital gain/loss: +$3,238 (reported on 9.7% of returns)
Here:
+$3,238
State:
+$16,110
(% of AGI for various income ranges: 0.9% for AGIs below $10k, -0.0% for AGIs $10k-25k, -0.0% for AGIs $25k-50k, 0.6% for AGIs $50k-75k, 0.2% for AGIs $75k-100k, 4.0% for AGIs over 100k)
Profit/loss from business: +$7,732 (reported on 15.0% of returns)
Here:
+$7,732
State:
+$11,013
(% of AGI for various income ranges: 9.7% for AGIs below $10k, 4.5% for AGIs $10k-25k, 4.5% for AGIs $25k-50k, 2.1% for AGIs $50k-75k, 4.5% for AGIs $75k-100k)
IRA payment deduction: $2,692 (reported on 1.6% of returns)
78039:
$2,692
Texas:
$3,120
Total itemized deductions: $13,724 (21% of AGI, reported on 10.6% of returns)
Here:
$13,724
State:
$19,631
Here:
20.7% of AGI
State:
18.9% of AGI
(% of AGI for various income ranges: 2.8% for AGIs $10k-25k, 4.3% for AGIs $25k-50k, 4.1% for AGIs $50k-75k, 5.4% for AGIs $75k-100k, 4.6% for AGIs over 100k)
Charity contributions deductions: $2,369 (4% of AGI, reported on 7.9% of returns)
Here:
$2,369
State:
$4,753
Here:
3.5% of AGI
State:
4.2% of AGI
(% of AGI for various income ranges: 0.6% for AGIs $25k-50k, 0.6% for AGIs $50k-75k, 0.6% for AGIs $75k-100k, 0.8% for AGIs over 100k)
Total tax: $4,229 (reported on 72.6% of returns)
78039:
$4,229
State:
$9,058
(% of AGI for various income ranges: 2.5% for AGIs below $10k, 3.6% for AGIs $10k-25k, 6.4% for AGIs $25k-50k, 8.4% for AGIs $50k-75k, 11.1% for AGIs $75k-100k, 16.1% for AGIs over 100k)
Earned income credit: $1,860 (reported on 21.7% of returns)
Here:
$1,860
State:
$2,024
Percentage of individuals using paid preparers for their 2004 taxes: 55.5%
Here:
55%
State:
57%
(% for various income ranges: 48.4% for AGIs below $10k, 61.8% for AGIs $10k-25k, 50.0% for AGIs $25k-50k, 62.0% for AGIs $50k-75k, 52.9% for AGIs $75k-100k, 58.6% for AGIs over 100k)
Household received Food Stamps/SNAP in the past 12 months: 116 Household did not receive Food Stamps/SNAP in the past 12 months: 753
Women who had a birth in the past 12 months: 11 (11 now married, 0 unmarried) Women who did not have a birth in the past 12 months: 612 (192 now married, 422 unmarried)
Housing units in zip code 78039 with a mortgage: 170 (6 second mortgage, 4 both second mortgage and home equity loan) Median monthly owner costs for units with a mortgage: $1,884 Median monthly owner costs for units without a mortgage: $446
Residents with income below the poverty level in 2022:
This zip code:
12.2%
Whole state:
14.0%
Residents with income below 50% of the poverty level in 2022:
This zip code:
5.4%
Whole state:
7.4%
Median number of rooms in houses and condos:
Here:
6.6
State:
6.3
Median number of rooms in apartments:
Here:
5.3
State:
4.0
Notable locations in this zip code not listed on our city pages
Size of family households: 278 2-persons, 129 3-persons, 79 4-persons, 136 5-persons, 5 6-persons
Size of nonfamily households: 198 1-person, 40 2-persons
244 married couples with children.
95 single-parent households (95 women).
66.2% of residents of 78039 zip code speak English at home.
33.5% of residents speak Spanish at home (59% very well, 28% well, 12% not well, 1% not at all).
0.1% of residents speak other Indo-European language at home (100% very well).
0.1% of residents speak Asian or Pacific Island language at home (100% very well).
0.1% of residents speak other language at home (100% very well).
Foreign born population: 28 (1.3%) (89.5% of them are naturalized citizens)
This zip code:
1.3%
Whole state:
17.2%
54%Sweden
35%Honduras
12%English
8%German
3%Irish
3%American
2%Swedish
2%French
1%Alsatian
Year of entry for the foreign-born population
372010 or later
02000 to 2009
01990 to 1999
36Before 1990
Housing units lacking complete plumbing facilities: 0.9% Housing units lacking complete kitchen facilities: 1.5%
54.8%Electricity
36.4%Utility gas
7.4%Bottled, tank, or LP gas
1.6%No fuel used
Population in 1990: 1,320. Population change in the 1990s: +329 (+24.9%).
Place of birth for U.S.-born residents:
This state: 1,940
Northeast: 7
Midwest: 44
South: 74
West: 93
62% of the 78039 zip code residents lived in the same house 5 years ago. Out of people who lived in different houses, 38% lived in this county. Out of people who lived in different counties, 50% lived in Texas.
97% of the 78039 zip code residents lived in the same house 1 year ago. Out of people who lived in different houses, 70% moved from this county. Out of people who lived in different houses, 17% moved from different county within same state. Out of people who lived in different houses, 20% moved from different state.
Private vs. public school enrollment:
Students in private schools in grades 1 to 8 (elementary and middle school): 31
Here:
19.4%
Texas:
8.8%
Students in private schools in grades 9 to 12 (high school): 71
Here:
47.8%
Texas:
8.0%
Students in private undergraduate colleges:
Here:
0.0%
Texas:
16.2%
Occupation by median earnings in the past 12 months ($)
169,626Material moving occupations
66,565Management occupations
61,154Education, training, and library occupations
52,147Architecture and engineering occupations
46,672Office and administrative support occupations
46,179Health technologists and technicians
Top industries in this zip code by the number of employees in 2005:
Administrative and Support and Waste Management and Remediation Services: Janitorial Services (20-49 employees: 1 establishment, 5-9 employees: 1 establishment)
Mining: Crude Petroleum and Natural Gas Extraction (20-49: 1)
Wholesale Trade: Grain and Field Bean Merchant Wholesalers (10-19: 1, 1-4: 1)
Accommodation and Food Services: Full-Service Restaurants (10-19: 1)
Health Care and Social Assistance: Child Day Care Services (10-19: 1)
Finance and Insurance: Commercial Banking (10-19: 1)
Other Services (except Public Administration): Religious Organizations (5-9: 1, 1-4: 1)
Home Mortgage Disclosure Act Aggregated Statistics For Year 2009 (Based on 2 partial tracts)
A) FHA, FSA/RHS & VA Home Purchase Loans
B) Conventional Home Purchase Loans
C) Refinancings
D) Home Improvement Loans
G) Loans On Manufactured Home Dwelling (A B C & D)
Number
Average Value
Number
Average Value
Number
Average Value
Number
Average Value
Number
Average Value
LOANS ORIGINATED
20
$124,680
3
$99,103
5
$114,802
1
$78,700
2
$75,160
APPLICATIONS APPROVED, NOT ACCEPTED
3
$106,460
1
$30,190
1
$165,100
1
$23,110
1
$57,250
APPLICATIONS DENIED
9
$147,799
2
$54,965
6
$94,905
4
$47,158
1
$89,940
APPLICATIONS WITHDRAWN
0
$0
0
$0
4
$115,188
0
$0
0
$0
FILES CLOSED FOR INCOMPLETENESS
0
$0
0
$0
1
$96,810
0
$0
0
$0
Aggregated Statistics For Year 2008 (Based on 2 partial tracts)
A) FHA, FSA/RHS & VA Home Purchase Loans
B) Conventional Home Purchase Loans
C) Refinancings
D) Home Improvement Loans
F) Non-occupant Loans on < 5 Family Dwellings (A B C & D)
G) Loans On Manufactured Home Dwelling (A B C & D)
Number
Average Value
Number
Average Value
Number
Average Value
Number
Average Value
Number
Average Value
Number
Average Value
LOANS ORIGINATED
4
$133,665
4
$158,285
6
$124,885
2
$40,390
1
$120,760
1
$73,910
APPLICATIONS APPROVED, NOT ACCEPTED
0
$0
2
$103,370
3
$91,957
1
$63,710
0
$0
2
$56,005
APPLICATIONS DENIED
2
$129,290
9
$79,440
9
$104,308
8
$40,702
1
$68,710
7
$58,741
APPLICATIONS WITHDRAWN
0
$0
1
$68,710
4
$143,865
1
$58,090
0
$0
0
$0
FILES CLOSED FOR INCOMPLETENESS
0
$0
1
$95,360
0
$0
0
$0
0
$0
0
$0
Aggregated Statistics For Year 2007 (Based on 2 partial tracts)
A) FHA, FSA/RHS & VA Home Purchase Loans
B) Conventional Home Purchase Loans
C) Refinancings
D) Home Improvement Loans
F) Non-occupant Loans on < 5 Family Dwellings (A B C & D)
G) Loans On Manufactured Home Dwelling (A B C & D)
Number
Average Value
Number
Average Value
Number
Average Value
Number
Average Value
Number
Average Value
Number
Average Value
LOANS ORIGINATED
4
$117,425
13
$97,726
4
$125,025
5
$24,484
3
$103,543
3
$55,033
APPLICATIONS APPROVED, NOT ACCEPTED
0
$0
4
$90,880
1
$73,290
1
$27,070
1
$79,530
2
$49,445
APPLICATIONS DENIED
5
$138,786
13
$74,856
16
$94,081
7
$21,861
2
$67,875
10
$57,651
APPLICATIONS WITHDRAWN
1
$104,100
2
$125,545
4
$87,445
1
$37,890
0
$0
1
$34,770
FILES CLOSED FOR INCOMPLETENESS
1
$113,050
1
$135,750
0
$0
0
$0
0
$0
0
$0
Aggregated Statistics For Year 2006 (Based on 2 partial tracts)
A) FHA, FSA/RHS & VA Home Purchase Loans
B) Conventional Home Purchase Loans
C) Refinancings
D) Home Improvement Loans
F) Non-occupant Loans on < 5 Family Dwellings (A B C & D)
G) Loans On Manufactured Home Dwelling (A B C & D)
Number
Average Value
Number
Average Value
Number
Average Value
Number
Average Value
Number
Average Value
Number
Average Value
LOANS ORIGINATED
7
$132,147
20
$87,954
5
$120,840
3
$23,250
4
$109,305
5
$61,710
APPLICATIONS APPROVED, NOT ACCEPTED
1
$70,370
7
$66,713
2
$68,080
0
$0
0
$0
3
$51,703
APPLICATIONS DENIED
1
$147,410
13
$59,497
10
$96,584
5
$23,860
1
$47,260
7
$42,264
APPLICATIONS WITHDRAWN
1
$53,720
3
$109,097
5
$120,048
1
$35,600
1
$98,890
0
$0
FILES CLOSED FOR INCOMPLETENESS
0
$0
1
$46,010
1
$78,280
0
$0
0
$0
0
$0
Aggregated Statistics For Year 2005 (Based on 2 partial tracts)
A) FHA, FSA/RHS & VA Home Purchase Loans
B) Conventional Home Purchase Loans
C) Refinancings
D) Home Improvement Loans
F) Non-occupant Loans on < 5 Family Dwellings (A B C & D)
G) Loans On Manufactured Home Dwelling (A B C & D)
Number
Average Value
Number
Average Value
Number
Average Value
Number
Average Value
Number
Average Value
Number
Average Value
LOANS ORIGINATED
1
$62,670
7
$87,681
7
$88,841
4
$34,092
2
$93,065
2
$42,055
APPLICATIONS APPROVED, NOT ACCEPTED
0
$0
4
$52,988
2
$74,850
0
$0
1
$43,930
3
$46,847
APPLICATIONS DENIED
1
$70,370
11
$56,441
9
$96,142
6
$32,340
1
$48,720
10
$42,140
APPLICATIONS WITHDRAWN
0
$0
2
$91,085
7
$89,764
2
$155,420
0
$0
1
$50,800
FILES CLOSED FOR INCOMPLETENESS
0
$0
0
$0
2
$82,135
0
$0
0
$0
0
$0
Aggregated Statistics For Year 2004 (Based on 2 partial tracts)
A) FHA, FSA/RHS & VA Home Purchase Loans
B) Conventional Home Purchase Loans
C) Refinancings
D) Home Improvement Loans
F) Non-occupant Loans on < 5 Family Dwellings (A B C & D)
G) Loans On Manufactured Home Dwelling (A B C & D)
Number
Average Value
Number
Average Value
Number
Average Value
Number
Average Value
Number
Average Value
Number
Average Value
LOANS ORIGINATED
2
$92,545
7
$63,084
7
$91,906
2
$28,210
2
$74,745
3
$53,577
APPLICATIONS APPROVED, NOT ACCEPTED
0
$0
5
$42,640
2
$90,880
1
$16,030
0
$0
4
$47,885
APPLICATIONS DENIED
0
$0
13
$49,232
14
$85,109
4
$13,638
1
$47,470
11
$46,125
APPLICATIONS WITHDRAWN
0
$0
1
$91,610
6
$76,478
0
$0
0
$0
0
$0
FILES CLOSED FOR INCOMPLETENESS
0
$0
0
$0
1
$70,790
0
$0
0
$0
0
$0
Aggregated Statistics For Year 2003 (Based on 2 partial tracts)
A) FHA, FSA/RHS & VA Home Purchase Loans
B) Conventional Home Purchase Loans
C) Refinancings
D) Home Improvement Loans
F) Non-occupant Loans on < 5 Family Dwellings (A B C & D)
Number
Average Value
Number
Average Value
Number
Average Value
Number
Average Value
Number
Average Value
LOANS ORIGINATED
7
$90,329
6
$72,870
14
$81,793
1
$18,950
1
$74,120
APPLICATIONS APPROVED, NOT ACCEPTED
0
$0
4
$43,202
2
$57,255
0
$0
0
$0
APPLICATIONS DENIED
2
$83,800
10
$45,054
12
$72,298
4
$8,015
0
$0
APPLICATIONS WITHDRAWN
2
$80,575
2
$82,550
5
$71,954
0
$0
0
$0
FILES CLOSED FOR INCOMPLETENESS
1
$75,370
1
$46,430
1
$28,940
0
$0
0
$0
Aggregated Statistics For Year 2002 (Based on 2 partial tracts)
A) FHA, FSA/RHS & VA Home Purchase Loans
B) Conventional Home Purchase Loans
C) Refinancings
D) Home Improvement Loans
Number
Average Value
Number
Average Value
Number
Average Value
Number
Average Value
LOANS ORIGINATED
31
$92,723
7
$62,817
7
$76,469
1
$19,780
APPLICATIONS APPROVED, NOT ACCEPTED
0
$0
4
$45,752
2
$79,115
0
$0
APPLICATIONS DENIED
2
$76,305
9
$47,956
8
$58,010
5
$13,908
APPLICATIONS WITHDRAWN
19
$85,767
1
$90,780
2
$79,740
0
$0
FILES CLOSED FOR INCOMPLETENESS
0
$0
0
$0
1
$123,880
0
$0
Aggregated Statistics For Year 2001 (Based on 2 partial tracts)
A) FHA, FSA/RHS & VA Home Purchase Loans
B) Conventional Home Purchase Loans
C) Refinancings
D) Home Improvement Loans
Number
Average Value
Number
Average Value
Number
Average Value
Number
Average Value
LOANS ORIGINATED
44
$85,471
10
$52,321
6
$74,848
2
$14,470
APPLICATIONS APPROVED, NOT ACCEPTED
1
$56,840
7
$49,670
2
$93,585
0
$0
APPLICATIONS DENIED
2
$76,305
12
$52,067
7
$57,284
3
$16,030
APPLICATIONS WITHDRAWN
21
$85,491
2
$72,350
3
$72,593
0
$0
FILES CLOSED FOR INCOMPLETENESS
10
$80,657
1
$35,600
0
$0
0
$0
Aggregated Statistics For Year 2000 (Based on 2 partial tracts)
A) FHA, FSA/RHS & VA Home Purchase Loans
B) Conventional Home Purchase Loans
C) Refinancings
D) Home Improvement Loans
F) Non-occupant Loans on < 5 Family Dwellings (A B C & D)
Number
Average Value
Number
Average Value
Number
Average Value
Number
Average Value
Number
Average Value
LOANS ORIGINATED
35
$81,775
10
$54,569
5
$63,292
1
$11,870
1
$21,240
APPLICATIONS APPROVED, NOT ACCEPTED
3
$82,863
6
$45,595
2
$59,960
0
$0
0
$0
APPLICATIONS DENIED
5
$73,370
20
$45,564
5
$43,014
2
$13,535
1
$39,560
APPLICATIONS WITHDRAWN
18
$79,544
3
$101,393
3
$69,400
1
$12,910
0
$0
FILES CLOSED FOR INCOMPLETENESS
10
$80,802
1
$83,280
2
$59,755
0
$0
0
$0
Aggregated Statistics For Year 1999 (Based on 1 partial tract)
A) FHA, FSA/RHS & VA Home Purchase Loans
B) Conventional Home Purchase Loans
C) Refinancings
D) Home Improvement Loans
F) Non-occupant Loans on < 5 Family Dwellings (A B C & D)
Detailed PMIC statistics for the following Tracts:1619.00
2003 - 2018 National Fire Incident Reporting System (NFIRS) incidents
Based on the data from the years 2003 - 2018 the average number of fires per year is 9. The highest number of reported fire incidents - 28 took place in 2011, and the least - 2 in 2007. The data has a decreasing trend.
When looking into fire subcategories, the most incidents belonged to: Outside Fires (65.5%), and Structure Fires (16.9%).
Fire incident types reported to NFIRS in Zip Code 78039


 Nearest zip codes: 78009, 78002, 78059, 78052, 78252, 78245.


 Based on the data from the years 2003 - 2018 the average number of fires per year is 9. The highest number of reported fire incidents - 28 took place in 2011, and the least - 2 in 2007. The data has a decreasing trend.
 When looking into fire subcategories, the most incidents belonged to: Outside Fires (65.5%), and Structure Fires (16.9%).