Estimated zip code population in 2022: 5,142 Zip code population in 2010: 4,273 Zip code population in 2000: 3,439
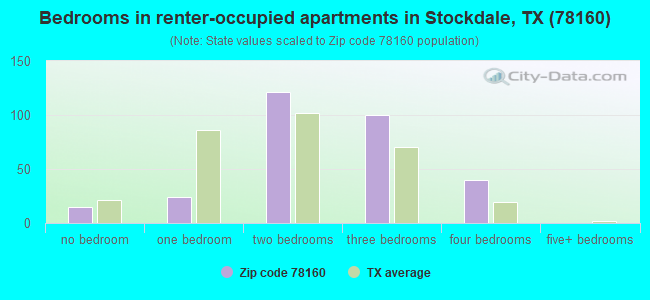
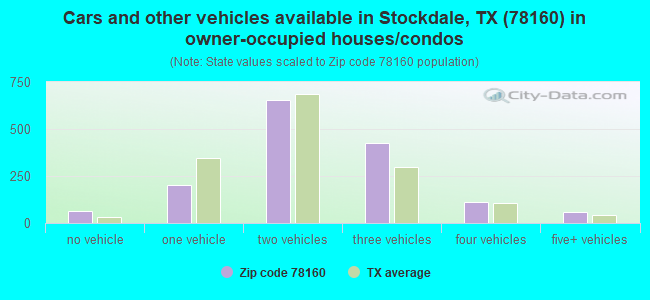
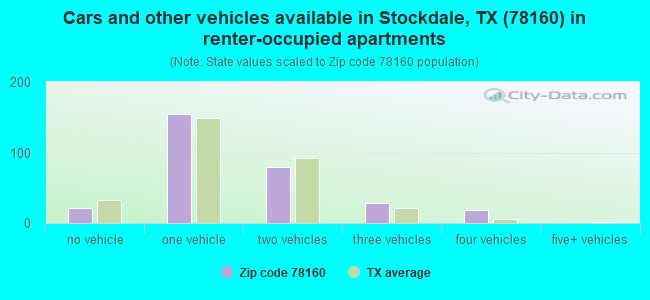
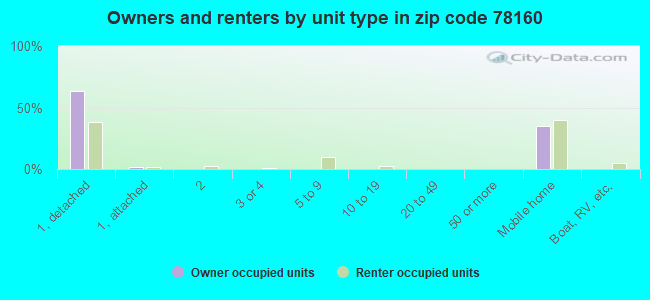
Houses and condos: 2,050 Renter-occupied apartments: 301
% of renters here:
17%
State:
38%
March 2022 cost of living index in zip code 78160: 79.7 (low, U.S. average is 100)
Land area: 182.2 sq. mi. Water area: 0.8 sq. mi.
Population density: 28 people per square mile
(very low).
OSM Map
General Map
Google Map
MSN Map
OSM Map
General Map
Google Map
MSN Map
OSM Map
General Map
Google Map
MSN Map
OSM Map
General Map
Google Map
MSN Map
Please wait while loading the map...
Real estate property taxes paid for housing units in 2022:
This zip code:
1.0% ($2,156)
Texas:
1.5% ($4,050)
Median real estate property taxes paid for housing units with mortgages in 2022: $2,352 (0.9%) Median real estate property taxes paid for housing units with no mortgage in 2022: $1,760 (1.1%)
Averages for the 2020 tax year for zip code 78160, filed in 2021:
Average Adjusted Gross Income (AGI) in 2020: $63,941 (Individual Income Tax Returns)
Here:
$63,941
State:
$77,054
Salary/wage: $55,570 (reported on 80.4% of returns)
Here:
$55,570
State:
$62,766
(% of AGI for various income ranges: 1165.2% for AGIs below $25k, 3340.8% for AGIs $25k-50k, 6459.5% for AGIs $50k-75k, 9026.9% for AGIs $75k-100k, 14716.8% for AGIs $100k-200k)
Taxable interest for individuals: $876 (reported on 29.9% of returns)
This zip code:
$876
Texas:
$2,665
(% of AGI for various income ranges: 10.0% for AGIs below $25k, 19.2% for AGIs $25k-50k, 28.6% for AGIs $50k-75k, 41.2% for AGIs $75k-100k, 61.4% for AGIs $100k-200k)
Ordinary dividends: $2,454 (reported on 12.4% of returns)
Here:
$2,454
State:
$10,044
(% of AGI for various income ranges: 6.2% for AGIs below $25k, 12.1% for AGIs $25k-50k, 16.8% for AGIs $50k-75k, 60.6% for AGIs $75k-100k, 79.1% for AGIs $100k-200k)
Net capital gain/loss in AGI: +$15,704 (reported on 12.9% of returns)
Here:
+$15,704
State:
+$39,590
(% of AGI for various income ranges: 13.8% for AGIs below $25k, 28.4% for AGIs $25k-50k, 52.7% for AGIs $50k-75k, 207.5% for AGIs $75k-100k, 715.5% for AGIs $100k-200k)
Profit/loss from business: +$12,844 (reported on 20.1% of returns)
Here:
+$12,844
State:
+$10,888
(% of AGI for various income ranges: 175.5% for AGIs below $25k, 190.0% for AGIs $25k-50k, 286.4% for AGIs $50k-75k, 371.2% for AGIs $75k-100k, 1057.3% for AGIs $100k-200k)
Taxable individual retirement arrangement distribution: $17,038 (reported on 6.7% of returns)
78160:
$17,038
Texas:
$24,740
(% of AGI for various income ranges: 58.8% for AGIs below $25k, 79.7% for AGIs $25k-50k, 282.3% for AGIs $50k-75k, 474.5% for AGIs $100k-200k)
Total itemized deductions: $28,400 (reported on 3.6% of returns)
Here:
$28,400
State:
$40,428
(% of AGI for various income ranges: 183.9% for AGIs $25k-50k, 585.9% for AGIs $100k-200k)
Charity contributions: $7,675 (reported on 2.1% of returns)
Here:
$7,675
State:
$18,201
(% of AGI for various income ranges: 139.5% for AGIs $100k-200k)
Taxes paid: $5,486 (reported on 3.6% of returns)
78160:
$5,486
State:
$7,821
(% of AGI for various income ranges: 32.4% for AGIs $25k-50k, 118.6% for AGIs $100k-200k)
Earned income credit: $2,253 (reported on 16.5% of returns)
Here:
$2,253
State:
$2,584
(% of AGI for various income ranges: 106.9% for AGIs below $25k, 71.6% for AGIs $25k-50k)
Percentage of individuals using paid preparers for their 2020 taxes: 92.8%
Here:
93%
State:
92%
(% for various income ranges: 91.4% for AGIs below $25k, 93.6% for AGIs $25k-50k, 93.1% for AGIs $50k-75k, 95.5% for AGIs $75k-100k, 93.8% for AGIs $100k-200k, 83.3% for AGIs over 200k)
Averages for the 2012 tax year for zip code 78160, filed in 2013:
Average Adjusted Gross Income (AGI) in 2012: $49,887 (Individual Income Tax Returns)
Here:
$49,887
State:
$65,384
Salary/wage: $44,827 (reported on 80.8% of returns)
Here:
$44,827
State:
$52,524
(% of AGI for various income ranges: 71.4% for AGIs below $25k, 80.9% for AGIs $25k-50k, 78.6% for AGIs $50k-75k, 80.8% for AGIs $75k-100k, 88.1% for AGIs $100k-200k)
Taxable interest for individuals: $831 (reported on 27.7% of returns)
This zip code:
$831
Texas:
$2,372
(% of AGI for various income ranges: 1.1% for AGIs below $25k, 0.4% for AGIs $25k-50k, 0.4% for AGIs $50k-75k, 0.5% for AGIs $75k-100k, 0.4% for AGIs $100k-200k, 0.4% for AGIs over 200k)
Ordinary dividends: $1,839 (reported on 10.2% of returns)
Here:
$1,839
State:
$9,721
(% of AGI for various income ranges: 0.4% for AGIs below $25k, 0.7% for AGIs $25k-50k, 0.6% for AGIs $50k-75k, 0.4% for AGIs $100k-200k)
Net capital gain/loss in AGI: +$3,300 (reported on 9.6% of returns)
Here:
+$3,300
State:
+$35,319
(% of AGI for various income ranges: 0.5% for AGIs below $25k, 0.4% for AGIs $25k-50k, 0.3% for AGIs $50k-75k, 0.5% for AGIs $75k-100k, 1.4% for AGIs $100k-200k)
Profit/loss from business: +$13,835 (reported on 20.9% of returns)
Here:
+$13,835
State:
+$13,732
(% of AGI for various income ranges: 11.9% for AGIs below $25k, 5.0% for AGIs $25k-50k, 6.7% for AGIs $50k-75k, 3.4% for AGIs $75k-100k, 7.1% for AGIs $100k-200k)
Taxable individual retirement arrangement distribution: $12,564 (reported on 6.2% of returns)
78160:
$12,564
Texas:
$19,511
(% of AGI for various income ranges: 1.4% for AGIs below $25k, 1.1% for AGIs $25k-50k, 3.4% for AGIs $50k-75k, 2.1% for AGIs $100k-200k)
Total itemized deductions: $20,057 (23% of AGI, reported on 15.8% of returns)
Here:
$20,057
State:
$24,724
Here:
22.9% of AGI
State:
15.9% of AGI
(% of AGI for various income ranges: 6.3% for AGIs below $25k, 5.5% for AGIs $25k-50k, 6.9% for AGIs $50k-75k, 6.5% for AGIs $75k-100k, 9.0% for AGIs $100k-200k)
Charity contributions: $4,282 (reported on 9.6% of returns)
Here:
$4,282
State:
$6,808
(% of AGI for various income ranges: 0.7% for AGIs below $25k, 0.8% for AGIs $50k-75k, 1.1% for AGIs $75k-100k, 1.6% for AGIs $100k-200k)
Taxes paid: $4,525 (reported on 15.8% of returns)
78160:
$4,525
State:
$6,921
(% of AGI for various income ranges: 0.9% for AGIs below $25k, 1.0% for AGIs $25k-50k, 1.5% for AGIs $50k-75k, 1.3% for AGIs $75k-100k, 2.5% for AGIs $100k-200k)
Earned income credit: $2,168 (reported on 20.9% of returns)
Here:
$2,168
State:
$2,570
(% of AGI for various income ranges: 6.8% for AGIs below $25k, 1.5% for AGIs $25k-50k)
Percentage of individuals using paid preparers for their 2012 taxes: 55.9%
Here:
56%
State:
51%
(% for various income ranges: 51.5% for AGIs below $25k, 52.4% for AGIs $25k-50k, 62.1% for AGIs $50k-75k, 62.5% for AGIs $75k-100k, 63.2% for AGIs $100k-200k, 66.7% for AGIs over 200k)
Averages for the 2004 tax year for zip code 78160, filed in 2005:
Average Adjusted Gross Income (AGI) in 2004: $35,551 (Individual Income Tax Returns)
Here:
$35,551
State:
$47,881
Salary/wage: $33,216 (reported on 82.0% of returns)
Here:
$33,216
State:
$41,947
(% of AGI for various income ranges: 217.2% for AGIs below $10k, 77.5% for AGIs $10k-25k, 79.1% for AGIs $25k-50k, 80.6% for AGIs $50k-75k, 83.5% for AGIs $75k-100k, 54.4% for AGIs over 100k)
Taxable interest for individuals: $1,289 (reported on 37.9% of returns)
This zip code:
$1,289
Texas:
$2,255
(% of AGI for various income ranges: 8.7% for AGIs below $10k, 1.8% for AGIs $10k-25k, 1.1% for AGIs $25k-50k, 0.8% for AGIs $50k-75k, 1.7% for AGIs $75k-100k, 1.3% for AGIs over 100k)
Taxable dividends: $1,075 (reported on 11.6% of returns)
Here:
$1,075
State:
$4,261
(% of AGI for various income ranges: 2.4% for AGIs below $10k, 0.4% for AGIs $10k-25k, 0.2% for AGIs $25k-50k, 0.1% for AGIs $50k-75k, 0.5% for AGIs $75k-100k, 0.6% for AGIs over 100k)
Net capital gain/loss: +$6,556 (reported on 17.1% of returns)
Here:
+$6,556
State:
+$16,110
(% of AGI for various income ranges: 5.8% for AGIs below $10k, 0.7% for AGIs $10k-25k, 1.2% for AGIs $25k-50k, 0.4% for AGIs $50k-75k, 1.5% for AGIs $75k-100k, 11.0% for AGIs over 100k)
Profit/loss from business: +$9,477 (reported on 19.9% of returns)
Here:
+$9,477
State:
+$11,013
(% of AGI for various income ranges: -10.5% for AGIs below $10k, 9.4% for AGIs $10k-25k, 5.8% for AGIs $25k-50k, 5.1% for AGIs $50k-75k, 7.6% for AGIs $75k-100k, 1.5% for AGIs over 100k)
IRA payment deduction: $2,042 (reported on 1.6% of returns)
78160:
$2,042
Texas:
$3,120
Total itemized deductions: $14,688 (22% of AGI, reported on 13.4% of returns)
Here:
$14,688
State:
$19,631
Here:
22.1% of AGI
State:
18.9% of AGI
(% of AGI for various income ranges: 20.7% for AGIs below $10k, 3.4% for AGIs $10k-25k, 4.4% for AGIs $25k-50k, 6.7% for AGIs $50k-75k, 5.9% for AGIs $75k-100k, 5.9% for AGIs over 100k)
Charity contributions deductions: $3,416 (5% of AGI, reported on 10.2% of returns)
Here:
$3,416
State:
$4,753
Here:
4.7% of AGI
State:
4.2% of AGI
(% of AGI for various income ranges: 0.4% for AGIs $10k-25k, 0.7% for AGIs $25k-50k, 0.6% for AGIs $50k-75k, 0.8% for AGIs $75k-100k, 2.2% for AGIs over 100k)
Total tax: $5,001 (reported on 72.0% of returns)
78160:
$5,001
State:
$9,058
(% of AGI for various income ranges: 5.7% for AGIs below $10k, 4.7% for AGIs $10k-25k, 6.4% for AGIs $25k-50k, 8.8% for AGIs $50k-75k, 11.2% for AGIs $75k-100k, 18.9% for AGIs over 100k)
Earned income credit: $1,873 (reported on 21.5% of returns)
Here:
$1,873
State:
$2,024
Percentage of individuals using paid preparers for their 2004 taxes: 63.7%
Here:
64%
State:
57%
(% for various income ranges: 55.3% for AGIs below $10k, 64.1% for AGIs $10k-25k, 61.8% for AGIs $25k-50k, 72.4% for AGIs $50k-75k, 67.3% for AGIs $75k-100k, 80.9% for AGIs over 100k)
Likely homosexual households (counted as self-reported same-sex unmarried-partner households)
Lesbian couples: 0.0% of all households
Gay men: 0.2% of all households
Household received Food Stamps/SNAP in the past 12 months: 259 Household did not receive Food Stamps/SNAP in the past 12 months: 1,557
Women who had a birth in the past 12 months: 87 (75 now married, 12 unmarried) Women who did not have a birth in the past 12 months: 1,020 (369 now married, 653 unmarried)
Housing units in zip code 78160 with a mortgage: 741 (28 second mortgage, 30 both second mortgage and home equity loan) Houses without a mortgage: 8
Median monthly owner costs for units with a mortgage: $1,655 Median monthly owner costs for units without a mortgage: $597
Residents with income below the poverty level in 2022:
This zip code:
19.5%
Whole state:
14.0%
Residents with income below 50% of the poverty level in 2022:
This zip code:
3.5%
Whole state:
7.4%
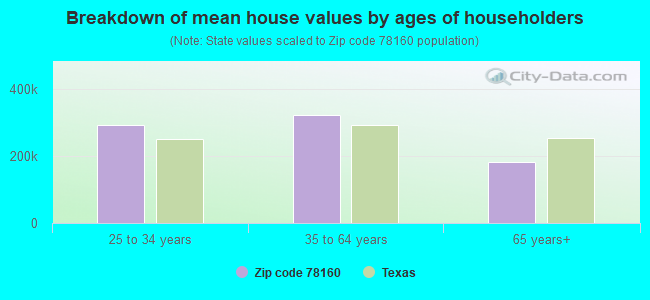
Median number of rooms in houses and condos:
Here:
5.8
State:
6.3
Median number of rooms in apartments:
Here:
4.7
State:
4.0
Notable locations in this zip code not listed on our city pages
Notable locations in zip code 78160: Dale Valley Ranch (A), Lazy S Ranch (B), Longhorn Volunteer Fire Department (C), Stockdale Volunteer Fire Department (D), Stockdale Volunteer Ambulance Service (E). Display/hide their locations on the map
Churches in zip code 78160 include: Saint Anns Church (A), Saint Johns Church (B), Missionary Church (C), Saint Marys Church (D). Display/hide their locations on the map
Cemeteries: Neyland Cemetery (1), Saint Anns Cemetery (2), Leach Cemetery (3), Steel Branch Cemetery (4), Nockenut Cemetery (5), Denhawken Cemetery (6). Display/hide their locations on the map
Streams, rivers, and creeks: Alum Creek (A), Clifton Branch (B), Steel Branch (C), Gold Pool Branch (D), East Fork Ecleto Creek (E). Display/hide their locations on the map
In group quarters: 31 (-1 institutionalized population)
Size of family households: 604 2-persons, 269 3-persons, 268 4-persons, 207 5-persons, 22 6-persons, 42 7-or-more-persons
Size of nonfamily households: 338 1-person, 53 2-persons
558 married couples with children.
27 single-parent households (27 women).
72.0% of residents of 78160 zip code speak English at home.
26.0% of residents speak Spanish at home (73% very well, 13% well, 12% not well, 3% not at all).
2.4% of residents speak other Indo-European language at home (62% very well, 28% well, 4% not well, 5% not at all).
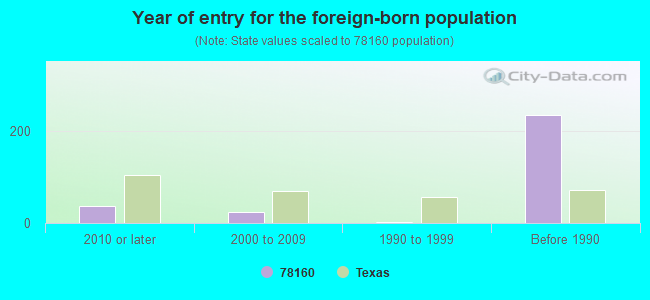
Foreign born population: 292 (5.7%) (40.0% of them are naturalized citizens)
This zip code:
5.7%
Whole state:
17.2%
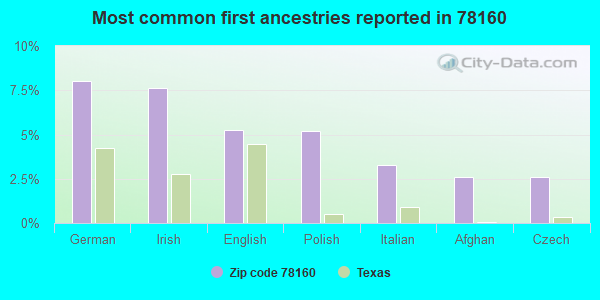
85%Honduras
8%German
8%Irish
5%English
5%Polish
3%Italian
3%Afghan
3%Czech
Year of entry for the foreign-born population
382010 or later
252000 to 2009
31990 to 1999
235Before 1990
Housing units lacking complete plumbing facilities: 8.8% Housing units lacking complete kitchen facilities: 6.9%
86.0%Electricity
8.8%Utility gas
4.6%Bottled, tank, or LP gas
0.6%Wood
Population in 1990: 3,085. Population change in the 1990s: +354 (+11.5%).
Place of birth for U.S.-born residents:
This state: 3,953
Northeast: 48
Midwest: 130
South: 437
West: 216
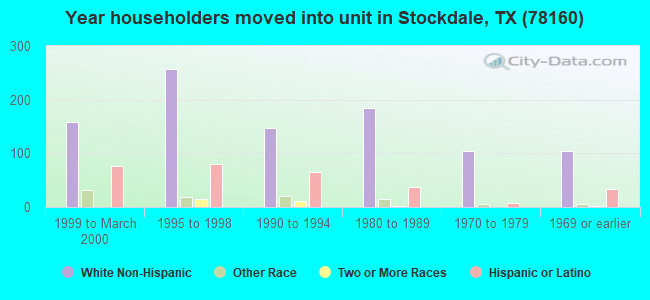
64% of the 78160 zip code residents lived in the same house 5 years ago. Out of people who lived in different houses, 50% lived in this county. Out of people who lived in different counties, 50% lived in Texas.
95% of the 78160 zip code residents lived in the same house 1 year ago. Out of people who lived in different houses, 8% moved from this county. Out of people who lived in different houses, 101% moved from different county within same state.
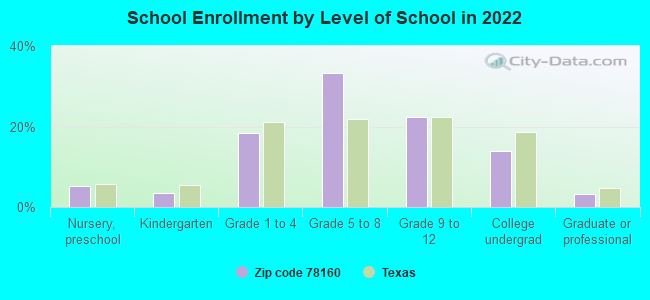
Private vs. public school enrollment:
Students in private schools in grades 1 to 8 (elementary and middle school): 106
Here:
21.4%
Texas:
8.8%
Students in private schools in grades 9 to 12 (high school): 14
Here:
6.6%
Texas:
8.0%
Students in private undergraduate colleges: 21
Here:
16.2%
Texas:
16.2%
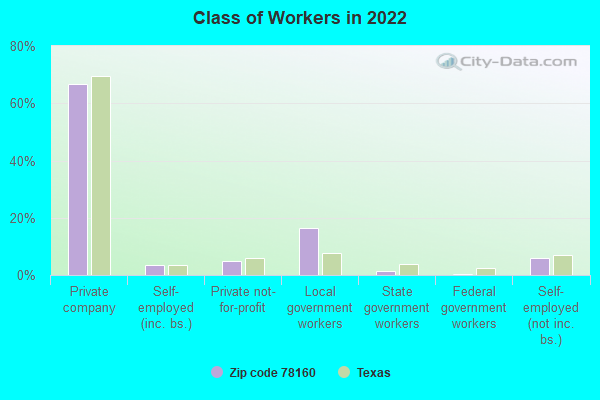
Occupation by median earnings in the past 12 months ($)
96,537Community and social service occupations
86,245Production occupations
81,499Construction and extraction occupations
78,822Installation, maintenance, and repair occupations
66,314Business and financial operations occupations
65,199Management occupations
Companies with federal contracts located in this zip code:
TEXAS ARRIS CORPORATION (968 COUNTY ROAD 439 in STOCKDALE, TX; small business)
$27,909 with Air Force for Aircraft Maintenance and Repair Shop Specialized Equipment. Signed on 2001-09-25. Completion date: 2002-02-15.
Top industries in this zip code by the number of employees in 2005:
Construction: New Single-Family Housing Construction (except Operative Builders) (20-49 employees: 1 establishment, 5-9 employees: 1 establishment)
Health Care and Social Assistance: Nursing Care Facilities (20-49: 1)
Construction: Poured Concrete Foundation and Structure Contractors (10-19: 1)
Finance and Insurance: Commercial Banking (10-19: 1)
Accommodation and Food Services: Limited-Service Restaurants (10-19: 1)
Construction: Water and Sewer Line and Related Structures Construction (10-19: 1)
People in group quarters in 2010:
51 people in nursing facilities/skilled-nursing facilities
People in group quarters in 2000:
68 people in nursing homes
8 people in other group homes
Fatal accident statistics in 2014:
Fatal accident count: 4
Vehicles involved in fatal accidents: 7
Fatal accidents caused by drunken drivers: 1
Fatalities: 4
Persons involved in fatal accidents: 9
Pedestrians involved in fatal accidents: 0
Fatal accident statistics in 2013:
Fatal accident count: 4
Vehicles involved in fatal accidents: 6
Fatal accidents caused by drunken drivers: 0
Fatalities: 4
Persons involved in fatal accidents: 17
Pedestrians involved in fatal accidents: 1
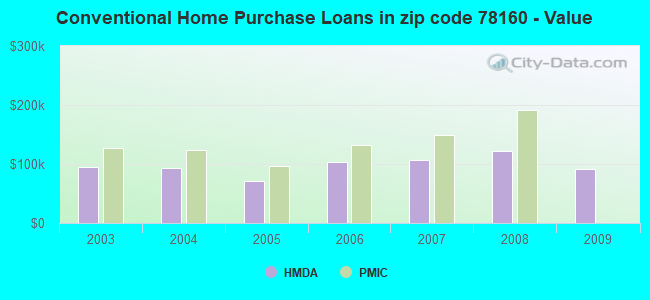
Home Mortgage Disclosure Act Aggregated Statistics For Year 2009 (Based on 4 partial tracts)
A) FHA, FSA/RHS & VA Home Purchase Loans
B) Conventional Home Purchase Loans
C) Refinancings
D) Home Improvement Loans
F) Non-occupant Loans on < 5 Family Dwellings (A B C & D)
G) Loans On Manufactured Home Dwelling (A B C & D)
Number
Average Value
Number
Average Value
Number
Average Value
Number
Average Value
Number
Average Value
Number
Average Value
LOANS ORIGINATED
19
$148,329
25
$92,119
41
$138,171
12
$40,543
2
$27,425
17
$61,864
APPLICATIONS APPROVED, NOT ACCEPTED
2
$65,975
5
$125,850
11
$71,633
0
$0
3
$37,117
4
$46,215
APPLICATIONS DENIED
1
$182,890
13
$112,572
25
$141,368
14
$13,879
2
$77,795
13
$56,171
APPLICATIONS WITHDRAWN
2
$166,100
0
$0
19
$97,154
2
$14,230
0
$0
4
$32,458
FILES CLOSED FOR INCOMPLETENESS
0
$0
0
$0
2
$121,035
0
$0
0
$0
0
$0
Aggregated Statistics For Year 2008 (Based on 4 partial tracts)
A) FHA, FSA/RHS & VA Home Purchase Loans
B) Conventional Home Purchase Loans
C) Refinancings
D) Home Improvement Loans
F) Non-occupant Loans on < 5 Family Dwellings (A B C & D)
G) Loans On Manufactured Home Dwelling (A B C & D)
Number
Average Value
Number
Average Value
Number
Average Value
Number
Average Value
Number
Average Value
Number
Average Value
LOANS ORIGINATED
14
$116,243
28
$122,229
40
$111,833
12
$59,596
13
$67,772
15
$60,199
APPLICATIONS APPROVED, NOT ACCEPTED
2
$164,695
13
$73,772
11
$122,204
5
$19,732
0
$0
10
$69,900
APPLICATIONS DENIED
2
$125,450
16
$77,784
30
$110,161
16
$54,409
2
$94,180
13
$66,006
APPLICATIONS WITHDRAWN
0
$0
4
$116,595
6
$172,552
2
$30,510
2
$194,490
1
$53,630
FILES CLOSED FOR INCOMPLETENESS
1
$58,430
0
$0
5
$129,048
2
$7,625
0
$0
0
$0
Aggregated Statistics For Year 2007 (Based on 4 partial tracts)
A) FHA, FSA/RHS & VA Home Purchase Loans
B) Conventional Home Purchase Loans
C) Refinancings
D) Home Improvement Loans
F) Non-occupant Loans on < 5 Family Dwellings (A B C & D)
G) Loans On Manufactured Home Dwelling (A B C & D)
Number
Average Value
Number
Average Value
Number
Average Value
Number
Average Value
Number
Average Value
Number
Average Value
LOANS ORIGINATED
7
$141,757
55
$107,594
33
$108,191
17
$55,239
7
$77,520
15
$70,865
APPLICATIONS APPROVED, NOT ACCEPTED
0
$0
21
$95,373
5
$119,454
3
$52,940
0
$0
9
$40,614
APPLICATIONS DENIED
3
$143,420
34
$96,714
43
$118,713
23
$48,784
2
$127,465
27
$46,798
APPLICATIONS WITHDRAWN
4
$122,942
5
$99,450
16
$137,758
7
$53,229
0
$0
3
$71,530
FILES CLOSED FOR INCOMPLETENESS
2
$140,335
2
$86,705
3
$270,877
0
$0
0
$0
0
$0
Aggregated Statistics For Year 2006 (Based on 4 partial tracts)
A) FHA, FSA/RHS & VA Home Purchase Loans
B) Conventional Home Purchase Loans
C) Refinancings
D) Home Improvement Loans
F) Non-occupant Loans on < 5 Family Dwellings (A B C & D)
G) Loans On Manufactured Home Dwelling (A B C & D)
Number
Average Value
Number
Average Value
Number
Average Value
Number
Average Value
Number
Average Value
Number
Average Value
LOANS ORIGINATED
12
$142,489
48
$104,195
41
$118,311
25
$43,183
11
$154,080
21
$66,040
APPLICATIONS APPROVED, NOT ACCEPTED
1
$82,040
16
$100,623
10
$111,200
2
$3,815
0
$0
7
$66,320
APPLICATIONS DENIED
0
$0
22
$90,611
54
$78,432
33
$47,627
2
$38,135
17
$53,013
APPLICATIONS WITHDRAWN
0
$0
18
$101,821
43
$128,531
8
$74,364
5
$33,558
3
$63,557
FILES CLOSED FOR INCOMPLETENESS
0
$0
3
$35,083
5
$133,320
0
$0
0
$0
0
$0
Aggregated Statistics For Year 2005 (Based on 4 partial tracts)
A) FHA, FSA/RHS & VA Home Purchase Loans
B) Conventional Home Purchase Loans
C) Refinancings
D) Home Improvement Loans
F) Non-occupant Loans on < 5 Family Dwellings (A B C & D)
G) Loans On Manufactured Home Dwelling (A B C & D)
Number
Average Value
Number
Average Value
Number
Average Value
Number
Average Value
Number
Average Value
Number
Average Value
LOANS ORIGINATED
9
$101,903
65
$71,359
47
$106,029
10
$45,844
6
$49,212
23
$73,371
APPLICATIONS APPROVED, NOT ACCEPTED
2
$51,865
27
$48,653
8
$124,954
0
$0
2
$95,335
17
$53,256
APPLICATIONS DENIED
2
$77,240
67
$48,759
79
$81,264
13
$29,040
7
$44,494
52
$45,324
APPLICATIONS WITHDRAWN
0
$0
11
$90,384
43
$135,517
4
$127,322
3
$166,270
6
$75,507
FILES CLOSED FOR INCOMPLETENESS
2
$80,845
2
$61,780
18
$123,251
0
$0
0
$0
2
$80,845
Aggregated Statistics For Year 2004 (Based on 4 partial tracts)
A) FHA, FSA/RHS & VA Home Purchase Loans
B) Conventional Home Purchase Loans
C) Refinancings
D) Home Improvement Loans
F) Non-occupant Loans on < 5 Family Dwellings (A B C & D)
G) Loans On Manufactured Home Dwelling (A B C & D)
Number
Average Value
Number
Average Value
Number
Average Value
Number
Average Value
Number
Average Value
Number
Average Value
LOANS ORIGINATED
10
$81,463
64
$92,519
74
$91,999
7
$55,599
2
$47,285
35
$51,535
APPLICATIONS APPROVED, NOT ACCEPTED
3
$134,037
17
$45,345
23
$86,495
4
$40,072
0
$0
20
$35,446
APPLICATIONS DENIED
4
$65,152
46
$48,197
64
$70,570
13
$48,856
4
$83,588
44
$36,884
APPLICATIONS WITHDRAWN
3
$78,303
3
$123,713
44
$81,157
4
$46,240
2
$49,575
3
$94,067
FILES CLOSED FOR INCOMPLETENESS
3
$84,913
0
$0
16
$102,780
2
$22,880
0
$0
0
$0
Aggregated Statistics For Year 2003 (Based on 4 partial tracts)
A) FHA, FSA/RHS & VA Home Purchase Loans
B) Conventional Home Purchase Loans
C) Refinancings
D) Home Improvement Loans
F) Non-occupant Loans on < 5 Family Dwellings (A B C & D)
Detailed PMIC statistics for the following Tracts:9801.02
, 9805.00
2002 - 2018 National Fire Incident Reporting System (NFIRS) incidents
Based on the data from the years 2002 - 2018 the average number of fire incidents per year is 21. The highest number of reported fire incidents - 65 took place in 2008, and the least - 0 in 2006. The data has a rising trend.
When looking into fire subcategories, the most incidents belonged to: Outside Fires (71.1%), and Structure Fires (15.7%).
Fire incident types reported to NFIRS in Zip Code 78160

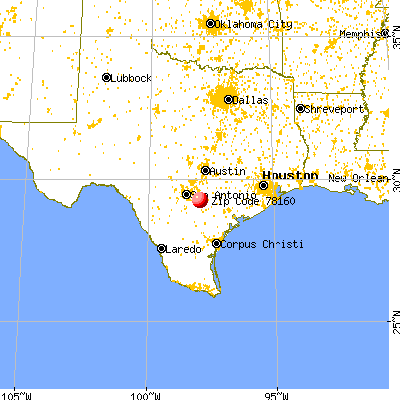


 Nearest zip codes: 78143, 78161, 78140, 78121, 78147, 78116.
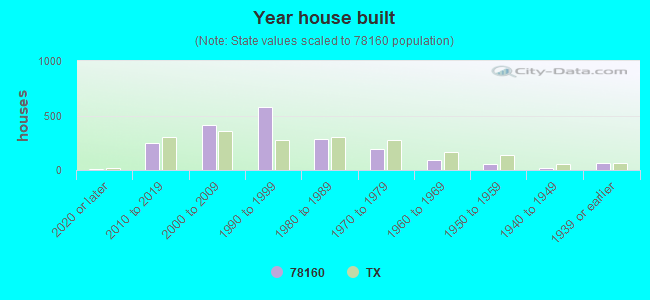


 Based on the data from the years 2002 - 2018 the average number of fire incidents per year is 21. The highest number of reported fire incidents - 65 took place in 2008, and the least - 0 in 2006. The data has a rising trend.
 When looking into fire subcategories, the most incidents belonged to: Outside Fires (71.1%), and Structure Fires (15.7%).