Estimated zip code population in 2022: 532 Zip code population in 2010: 864 Zip code population in 2000: 335
Houses and condos: 240 Renter-occupied apartments: 9
% of renters here:
6%
State:
38%
March 2022 cost of living index in zip code 78161: 79.2 (low, U.S. average is 100)
Land area: 12.8 sq. mi. Water area: 0.1 sq. mi.
Population density: 42 people per square mile
(very low).
OSM Map
General Map
Google Map
MSN Map
OSM Map
General Map
Google Map
MSN Map
OSM Map
General Map
Google Map
MSN Map
OSM Map
General Map
Google Map
MSN Map
Please wait while loading the map...
Median real estate property taxes paid for housing units with mortgages in 2022: $209 (1.8%) Median real estate property taxes paid for housing units with no mortgage in 2022: $2,627 (1.3%)
Business Search- 14 Million verified businesses
Males: 163
(30.6%)
Females: 369
(69.4%)
For population 25 years and over in 78161:
High school or higher: 87.8%
Bachelor's degree or higher: 15.8%
Graduate or professional degree: 0.0%
Unemployed: 18.6%
Mean travel time to work (commute): 33.7 minutes
For population 15 years and over in 78161:
Never married: 53.0%
Now married: 24.9%
Separated: 0.0%
Widowed: 11.1%
Divorced: 11.0%
Zip code 78161 compared to state average:
Median house value significantly below state average.
Unemployed percentage significantly above state average.
Black race population percentage significantly below state average.
Foreign-born population percentage significantly below state average.
Renting percentage significantly below state average.
Length of stay since moving in significantly above state average.
House age significantly below state average.
Percentage of population with a bachelor's degree or higher significantly below state average.
Averages for the 2020 tax year for zip code 78161, filed in 2021:
Average Adjusted Gross Income (AGI) in 2020: $57,322 (Individual Income Tax Returns)
Here:
$57,322
State:
$77,054
Salary/wage: $52,468 (reported on 77.5% of returns)
Here:
$52,468
State:
$62,766
(% of AGI for various income ranges: 993.3% for AGIs below $25k, 3650.0% for AGIs $25k-50k, 6777.5% for AGIs $50k-75k, 8297.5% for AGIs $75k-100k, 15140.0% for AGIs $100k-200k)
Taxable interest for individuals: $250 (reported on 25.0% of returns)
This zip code:
$250
Texas:
$2,665
(% of AGI for various income ranges: 11.1% for AGIs $25k-50k, 7.5% for AGIs $50k-75k, 30.0% for AGIs $100k-200k)
Ordinary dividends: $1,867 (reported on 7.5% of returns)
Here:
$1,867
State:
$10,044
(% of AGI for various income ranges: 140.0% for AGIs $50k-75k)
Net capital gain/loss in AGI: +$1,100 (reported on 7.5% of returns)
Here:
+$1,100
State:
+$39,590
(% of AGI for various income ranges: 82.5% for AGIs $50k-75k)
Profit/loss from business: +$11,667 (reported on 22.5% of returns)
Here:
+$11,667
State:
+$10,888
(% of AGI for various income ranges: 261.1% for AGIs below $25k, 508.9% for AGIs $25k-50k, 892.5% for AGIs $75k-100k)
Earned income credit: $2,388 (reported on 20.0% of returns)
Here:
$2,388
State:
$2,584
(% of AGI for various income ranges: 134.4% for AGIs below $25k, 77.8% for AGIs $25k-50k)
Percentage of individuals using paid preparers for their 2020 taxes: 92.5%
Here:
92%
State:
92%
(% for various income ranges: 91.7% for AGIs below $25k, 90.9% for AGIs $25k-50k, 100.0% for AGIs $50k-75k, 80.0% for AGIs $75k-100k, 100.0% for AGIs $100k-200k)
Averages for the 2012 tax year for zip code 78161, filed in 2013:
Average Adjusted Gross Income (AGI) in 2012: $44,910 (Individual Income Tax Returns)
Here:
$44,910
State:
$65,384
Salary/wage: $40,715 (reported on 85.0% of returns)
Here:
$40,715
State:
$52,524
(% of AGI for various income ranges: 79.1% for AGIs below $25k, 76.7% for AGIs $25k-50k, 88.4% for AGIs $50k-75k, 76.3% for AGIs $75k-100k, 70.2% for AGIs $100k-200k)
Taxable interest for individuals: $212 (reported on 20.0% of returns)
This zip code:
$212
Texas:
$2,372
(% of AGI for various income ranges: 0.2% for AGIs $25k-50k, 0.2% for AGIs $50k-75k)
Ordinary dividends: $850 (reported on 5.0% of returns)
Here:
$850
State:
$9,721
Net capital gain/loss in AGI: +$3,500 (reported on 5.0% of returns)
Here:
+$3,500
State:
+$35,319
Profit/loss from business: +$4,475 (reported on 20.0% of returns)
Here:
+$4,475
State:
+$13,732
(% of AGI for various income ranges: 12.6% for AGIs below $25k, 4.8% for AGIs $25k-50k)
Total itemized deductions: $19,388 (24% of AGI, reported on 20.0% of returns)
Here:
$19,388
State:
$24,724
Here:
23.6% of AGI
State:
15.9% of AGI
(% of AGI for various income ranges: 26.1% for AGIs below $25k, 12.5% for AGIs $50k-75k, 22.2% for AGIs $75k-100k)
Charity contributions: $3,320 (reported on 12.5% of returns)
Here:
$3,320
State:
$6,808
(% of AGI for various income ranges: 1.1% for AGIs $25k-50k, 4.4% for AGIs $75k-100k)
Taxes paid: $4,012 (reported on 20.0% of returns)
78161:
$4,012
State:
$6,921
(% of AGI for various income ranges: 4.1% for AGIs below $25k, 2.5% for AGIs $50k-75k, 5.5% for AGIs $75k-100k)
Earned income credit: $2,250 (reported on 20.0% of returns)
Here:
$2,250
State:
$2,570
(% of AGI for various income ranges: 7.0% for AGIs below $25k, 1.2% for AGIs $25k-50k)
Percentage of individuals using paid preparers for their 2012 taxes: 55.0%
Here:
55%
State:
51%
(% for various income ranges: 50.0% for AGIs below $25k, 54.5% for AGIs $25k-50k, 66.7% for AGIs $50k-75k, 66.7% for AGIs $75k-100k, 50.0% for AGIs $100k-200k)
Averages for the 2004 tax year for zip code 78161, filed in 2005:
Average Adjusted Gross Income (AGI) in 2004: $37,071 (Individual Income Tax Returns)
Here:
$37,071
State:
$47,881
Salary/wage: $35,532 (reported on 86.6% of returns)
Here:
$35,532
State:
$41,947
(% of AGI for various income ranges: 129.5% for AGIs below $10k, 84.5% for AGIs $10k-25k, 85.7% for AGIs $25k-50k, 88.5% for AGIs $50k-75k, 78.4% for AGIs $75k-100k, 69.5% for AGIs over 100k)
Taxable interest for individuals: $547 (reported on 27.9% of returns)
This zip code:
$547
Texas:
$2,255
(% of AGI for various income ranges: 0.7% for AGIs $10k-25k, 0.7% for AGIs $25k-50k, 0.3% for AGIs $50k-75k, 0.2% for AGIs $75k-100k, 0.2% for AGIs over 100k)
Taxable dividends: $405 (reported on 9.7% of returns)
Here:
$405
State:
$4,261
Net capital gain/loss: +$1,029 (reported on 8.9% of returns)
Here:
+$1,029
State:
+$16,110
Profit/loss from business: +$6,921 (reported on 16.6% of returns)
Here:
+$6,921
State:
+$11,013
(% of AGI for various income ranges: 21.6% for AGIs below $10k, 4.1% for AGIs $10k-25k, 5.6% for AGIs $50k-75k, 6.0% for AGIs $75k-100k)
Total itemized deductions: $17,652 (26% of AGI, reported on 18.2% of returns)
Here:
$17,652
State:
$19,631
Here:
25.7% of AGI
State:
18.9% of AGI
(% of AGI for various income ranges: 11.0% for AGIs $25k-50k, 6.9% for AGIs $50k-75k, 10.8% for AGIs $75k-100k, 12.7% for AGIs over 100k)
Charity contributions deductions: $2,827 (4% of AGI, reported on 13.7% of returns)
Here:
$2,827
State:
$4,753
Here:
4.1% of AGI
State:
4.2% of AGI
Total tax: $4,784 (reported on 73.2% of returns)
78161:
$4,784
State:
$9,058
(% of AGI for various income ranges: 4.7% for AGIs below $10k, 3.6% for AGIs $10k-25k, 5.9% for AGIs $25k-50k, 9.4% for AGIs $50k-75k, 12.6% for AGIs $75k-100k, 17.4% for AGIs over 100k)
Earned income credit: $2,000 (reported on 20.5% of returns)
Here:
$2,000
State:
$2,024
Percentage of individuals using paid preparers for their 2004 taxes: 61.3%
Here:
61%
State:
57%
(% for various income ranges: 62.1% for AGIs below $10k, 57.5% for AGIs $10k-25k, 59.6% for AGIs $25k-50k, 56.9% for AGIs $50k-75k, 87.0% for AGIs $75k-100k, 72.2% for AGIs over 100k)
Household received Food Stamps/SNAP in the past 12 months: 77 Household did not receive Food Stamps/SNAP in the past 12 months: 91
Women who had a birth in the past 12 months: 7 (0 now married, 6 unmarried) Women who did not have a birth in the past 12 months: 208 (9 now married, 202 unmarried)
Housing units in zip code 78161 with a mortgage: 74 Median monthly owner costs for units with a mortgage: $571 Median monthly owner costs for units without a mortgage: $296
Residents with income below the poverty level in 2022:
This zip code:
50.0%
Whole state:
14.0%
Residents with income below 50% of the poverty level in 2022:
This zip code:
48.4%
Whole state:
7.4%
Median number of rooms in houses and condos:
Here:
4.1
State:
6.3
Notable locations in this zip code not listed on our city pages
Size of family households: 36 2-persons, 49 5-persons, 11 7-or-more-persons
Size of nonfamily households: 48 1-person, 18 3-persons
86.3% of residents of 78161 zip code speak English at home.
12.1% of residents speak Spanish at home (73% very well, 27% well).
1.6% of residents speak other language at home (100% very well).
Foreign born population: 0 (0.0%)
:
0.0%
Whole state:
17.2%
8%American
3%Irish
3%Italian
Housing units lacking complete plumbing facilities: 28.2% Housing units lacking complete kitchen facilities: 28.0%
Population in 1990: 1,051.
Place of birth for U.S.-born residents:
This state: 391
Northeast: 19
Midwest: 46
South: 43
West: 28
51% of the 78161 zip code residents lived in the same house 5 years ago. Out of people who lived in different houses, 36% lived in this county. Out of people who lived in different counties, 50% lived in Texas.
82% of the 78161 zip code residents lived in the same house 1 year ago. Out of people who lived in different houses, 102% moved from different county within same state.
Private vs. public school enrollment:
Students in private schools in grades 1 to 8 (elementary and middle school):
Here:
0.0%
Texas:
8.8%
Students in private schools in grades 9 to 12 (high school):
Here:
0.0%
Texas:
8.0%
Students in private undergraduate colleges:
Here:
0.0%
Texas:
16.2%
Occupation by median earnings in the past 12 months ($)
67,005Management occupations
15,495Sales and related occupations
Top industries in this zip code by the number of employees in 2005:
Accommodation and Food Services: Full-Service Restaurants (5-9 employees: 1 establishment)
Construction: Painting and Wall Covering Contractors (1-4: 1)
Other Services (except Public Administration): Religious Organizations (1-4: 1)
Fatal accident statistics in 2014:
Fatal accident count: 2
Vehicles involved in fatal accidents: 2
Fatal accidents caused by drunken drivers: 0
Fatalities: 2
Persons involved in fatal accidents: 2
Pedestrians involved in fatal accidents: 2
Fatal accident statistics in 2012:
Fatal accident count: 1
Vehicles involved in fatal accidents: 2
Fatal accidents caused by drunken drivers: 0
Fatalities: 1
Persons involved in fatal accidents: 7
Pedestrians involved in fatal accidents: 0
Home Mortgage Disclosure Act Aggregated Statistics For Year 2009 (Based on 4 partial tracts)
C) Refinancings
Number
Average Value
LOANS ORIGINATED
1
$146,640
APPLICATIONS APPROVED, NOT ACCEPTED
0
$0
APPLICATIONS DENIED
1
$78,200
APPLICATIONS WITHDRAWN
0
$0
FILES CLOSED FOR INCOMPLETENESS
0
$0
Aggregated Statistics For Year 2008 (Based on 4 partial tracts)
A) FHA, FSA/RHS & VA Home Purchase Loans
B) Conventional Home Purchase Loans
C) Refinancings
Number
Average Value
Number
Average Value
Number
Average Value
LOANS ORIGINATED
1
$82,920
1
$84,560
1
$61,680
APPLICATIONS APPROVED, NOT ACCEPTED
0
$0
0
$0
0
$0
APPLICATIONS DENIED
0
$0
0
$0
1
$57,560
APPLICATIONS WITHDRAWN
0
$0
0
$0
0
$0
FILES CLOSED FOR INCOMPLETENESS
0
$0
0
$0
0
$0
Aggregated Statistics For Year 2007 (Based on 4 partial tracts)
B) Conventional Home Purchase Loans
C) Refinancings
G) Loans On Manufactured Home Dwelling (A B C & D)
Number
Average Value
Number
Average Value
Number
Average Value
LOANS ORIGINATED
1
$92,000
1
$129,680
0
$0
APPLICATIONS APPROVED, NOT ACCEPTED
0
$0
0
$0
0
$0
APPLICATIONS DENIED
1
$58,040
1
$73,400
1
$30,240
APPLICATIONS WITHDRAWN
0
$0
0
$0
0
$0
FILES CLOSED FOR INCOMPLETENESS
0
$0
0
$0
0
$0
Aggregated Statistics For Year 2006 (Based on 4 partial tracts)
B) Conventional Home Purchase Loans
C) Refinancings
G) Loans On Manufactured Home Dwelling (A B C & D)
Number
Average Value
Number
Average Value
Number
Average Value
LOANS ORIGINATED
1
$113,240
1
$81,720
1
$60,400
APPLICATIONS APPROVED, NOT ACCEPTED
0
$0
0
$0
0
$0
APPLICATIONS DENIED
0
$0
1
$78,600
1
$33,360
APPLICATIONS WITHDRAWN
0
$0
0
$0
0
$0
FILES CLOSED FOR INCOMPLETENESS
0
$0
0
$0
0
$0
Aggregated Statistics For Year 2005 (Based on 4 partial tracts)
B) Conventional Home Purchase Loans
C) Refinancings
D) Home Improvement Loans
G) Loans On Manufactured Home Dwelling (A B C & D)
Number
Average Value
Number
Average Value
Number
Average Value
Number
Average Value
LOANS ORIGINATED
1
$72,840
1
$141,320
0
$0
1
$38,160
APPLICATIONS APPROVED, NOT ACCEPTED
0
$0
0
$0
0
$0
0
$0
APPLICATIONS DENIED
1
$37,600
1
$82,120
1
$17,760
1
$25,320
APPLICATIONS WITHDRAWN
0
$0
1
$44,080
0
$0
0
$0
FILES CLOSED FOR INCOMPLETENESS
0
$0
0
$0
0
$0
0
$0
Aggregated Statistics For Year 2004 (Based on 4 partial tracts)
B) Conventional Home Purchase Loans
C) Refinancings
G) Loans On Manufactured Home Dwelling (A B C & D)
Number
Average Value
Number
Average Value
Number
Average Value
LOANS ORIGINATED
1
$100,280
1
$124,720
1
$37,120
APPLICATIONS APPROVED, NOT ACCEPTED
0
$0
0
$0
0
$0
APPLICATIONS DENIED
1
$28,120
1
$85,360
1
$33,680
APPLICATIONS WITHDRAWN
0
$0
0
$0
0
$0
FILES CLOSED FOR INCOMPLETENESS
0
$0
0
$0
0
$0
Aggregated Statistics For Year 2003 (Based on 4 partial tracts)
Detailed HMDA statistics for the following Tracts:9801.02
2004 - 2018 National Fire Incident Reporting System (NFIRS) incidents
According to the data from the years 2004 - 2018 the average number of fire incidents per year is 8. The highest number of reported fires - 20 took place in 2010, and the least - 0 in 2005. The data has a rising trend.
When looking into fire subcategories, the most incidents belonged to: Outside Fires (65.2%), and Structure Fires (25.2%).
Fire incident types reported to NFIRS in Zip Code 78161

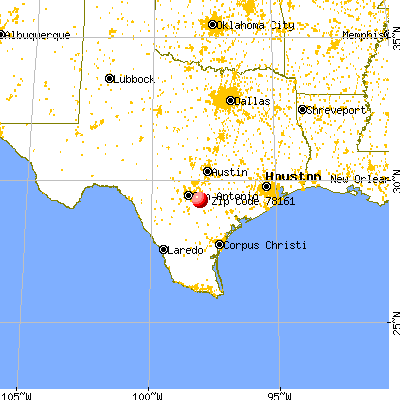


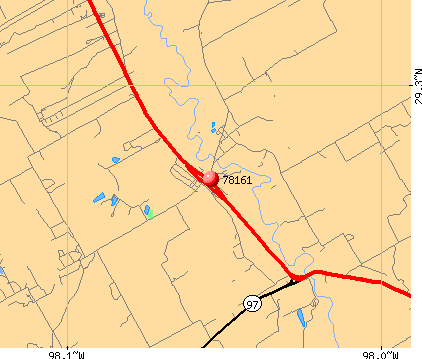 Nearest zip codes: 78121, 78160, 78101, 78152, 78143, 78147.


 According to the data from the years 2004 - 2018 the average number of fire incidents per year is 8. The highest number of reported fires - 20 took place in 2010, and the least - 0 in 2005. The data has a rising trend.
 When looking into fire subcategories, the most incidents belonged to: Outside Fires (65.2%), and Structure Fires (25.2%).