Estimated zip code population in 2022: 26,420 Zip code population in 2010: 13,513 Zip code population in 2000: 1,119
Houses and condos: 9,702 Renter-occupied apartments: 1,900
% of renters here:
20%
State:
38%
March 2022 cost of living index in zip code 78261: 88.3 (less than average, U.S. average is 100)
Land area: 29.9 sq. mi. Water area: 0.0 sq. mi.
Population density: 885 people per square mile
(low).
OSM Map
General Map
Google Map
MSN Map
OSM Map
General Map
Google Map
MSN Map
OSM Map
General Map
Google Map
MSN Map
OSM Map
General Map
Google Map
MSN Map
Please wait while loading the map...
Real estate property taxes paid for housing units in 2022:
This zip code:
1.6% ($7,045)
Texas:
1.5% ($4,050)
Median real estate property taxes paid for housing units with mortgages in 2022: $6,975 (1.6%) Median real estate property taxes paid for housing units with no mortgage in 2022: $7,855 (1.6%)
Estimated median house/condo value in 2022: $438,789
78261:
$438,789
Texas:
$275,400
According to our research of Texas and other state lists, there were 12 registered sex offenders living in 78261 zip code as of May 28, 2024. The ratio of all residents to sex offenders in zip code 78261 is 1,337 to 1. The ratio of registered sex offenders to all residents in this zip code is much lower than the state average.
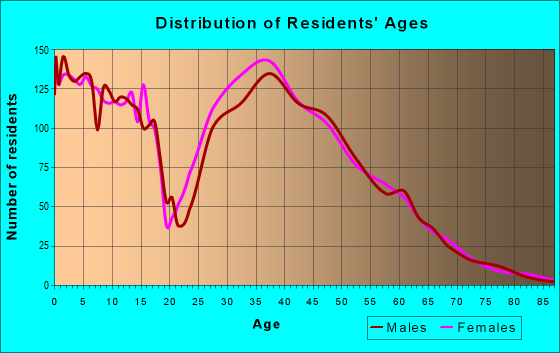
Median resident age:
This zip code:
37.6 years
Texas median age:
35.6 years
Average household size:
This zip code:
2.8 people
Texas:
2.6 people
Averages for the 2020 tax year for zip code 78261, filed in 2021:
Average Adjusted Gross Income (AGI) in 2020: $113,770 (Individual Income Tax Returns)
Here:
$113,770
State:
$77,054
Salary/wage: $92,691 (reported on 86.2% of returns)
Here:
$92,691
State:
$62,766
(% of AGI for various income ranges: 1133.4% for AGIs below $25k, 3476.9% for AGIs $25k-50k, 6374.4% for AGIs $50k-75k, 9396.9% for AGIs $75k-100k, 18407.2% for AGIs $100k-200k, 68804.0% for AGIs over 200k)
Taxable interest for individuals: $1,786 (reported on 33.7% of returns)
This zip code:
$1,786
Texas:
$2,665
(% of AGI for various income ranges: 12.2% for AGIs below $25k, 20.2% for AGIs $25k-50k, 38.4% for AGIs $50k-75k, 63.9% for AGIs $75k-100k, 77.8% for AGIs $100k-200k, 776.0% for AGIs over 200k)
Ordinary dividends: $5,589 (reported on 28.6% of returns)
Here:
$5,589
State:
$10,044
(% of AGI for various income ranges: 18.6% for AGIs below $25k, 37.1% for AGIs $25k-50k, 68.3% for AGIs $50k-75k, 160.8% for AGIs $75k-100k, 205.0% for AGIs $100k-200k, 2258.5% for AGIs over 200k)
Net capital gain/loss in AGI: +$29,466 (reported on 22.4% of returns)
Here:
+$29,466
State:
+$39,590
(% of AGI for various income ranges: 13.3% for AGIs below $25k, 42.6% for AGIs $25k-50k, 69.3% for AGIs $50k-75k, 199.5% for AGIs $75k-100k, 416.0% for AGIs $100k-200k, 12791.3% for AGIs over 200k)
Profit/loss from business: +$16,976 (reported on 20.5% of returns)
Here:
+$16,976
State:
+$10,888
(% of AGI for various income ranges: 90.4% for AGIs below $25k, 177.3% for AGIs $25k-50k, 210.6% for AGIs $50k-75k, 256.4% for AGIs $75k-100k, 466.8% for AGIs $100k-200k, 4392.7% for AGIs over 200k)
Taxable individual retirement arrangement distribution: $28,666 (reported on 7.3% of returns)
78261:
$28,666
Texas:
$24,740
(% of AGI for various income ranges: 25.6% for AGIs below $25k, 68.4% for AGIs $25k-50k, 162.1% for AGIs $50k-75k, 238.7% for AGIs $75k-100k, 444.9% for AGIs $100k-200k, 2029.5% for AGIs over 200k)
Self-employed (Keogh) retirement plans: $28,456 (reported on 0.7% of returns)
78261:
$28,456
Texas:
$29,298
(% of AGI for various income ranges: 15.2% for AGIs $100k-200k, 409.8% for AGIs over 200k)
Total itemized deductions: $34,620 (reported on 15.7% of returns)
Here:
$34,620
State:
$40,428
(% of AGI for various income ranges: 77.1% for AGIs below $25k, 142.9% for AGIs $25k-50k, 415.7% for AGIs $50k-75k, 580.2% for AGIs $75k-100k, 1100.4% for AGIs $100k-200k, 5632.5% for AGIs over 200k)
Charity contributions: $12,714 (reported on 13.0% of returns)
Here:
$12,714
State:
$18,201
(% of AGI for various income ranges: 6.1% for AGIs below $25k, 18.6% for AGIs $25k-50k, 62.0% for AGIs $50k-75k, 131.4% for AGIs $75k-100k, 280.6% for AGIs $100k-200k, 2290.5% for AGIs over 200k)
Taxes paid: $8,203 (reported on 15.4% of returns)
78261:
$8,203
State:
$7,821
(% of AGI for various income ranges: 15.3% for AGIs below $25k, 36.0% for AGIs $25k-50k, 112.9% for AGIs $50k-75k, 147.3% for AGIs $75k-100k, 292.5% for AGIs $100k-200k, 1129.8% for AGIs over 200k)
Earned income credit: $2,072 (reported on 8.9% of returns)
Here:
$2,072
State:
$2,584
(% of AGI for various income ranges: 60.6% for AGIs below $25k, 59.4% for AGIs $25k-50k, 0.8% for AGIs $50k-75k)
Percentage of individuals using paid preparers for their 2020 taxes: 93.3%
Here:
93%
State:
92%
(% for various income ranges: 91.7% for AGIs below $25k, 94.3% for AGIs $25k-50k, 94.3% for AGIs $50k-75k, 93.2% for AGIs $75k-100k, 93.1% for AGIs $100k-200k, 94.2% for AGIs over 200k)
Averages for the 2012 tax year for zip code 78261, filed in 2013:
Average Adjusted Gross Income (AGI) in 2012: $103,519 (Individual Income Tax Returns)
Here:
$103,519
State:
$65,384
Salary/wage: $85,751 (reported on 90.2% of returns)
Here:
$85,751
State:
$52,524
(% of AGI for various income ranges: 82.1% for AGIs below $25k, 85.5% for AGIs $25k-50k, 87.2% for AGIs $50k-75k, 86.3% for AGIs $75k-100k, 84.2% for AGIs $100k-200k, 58.6% for AGIs over 200k)
Taxable interest for individuals: $1,186 (reported on 37.2% of returns)
This zip code:
$1,186
Texas:
$2,372
(% of AGI for various income ranges: 0.8% for AGIs below $25k, 0.3% for AGIs $25k-50k, 0.3% for AGIs $50k-75k, 0.3% for AGIs $75k-100k, 0.4% for AGIs $100k-200k, 0.6% for AGIs over 200k)
Ordinary dividends: $5,466 (reported on 22.8% of returns)
Here:
$5,466
State:
$9,721
(% of AGI for various income ranges: 2.0% for AGIs below $25k, 0.7% for AGIs $25k-50k, 0.6% for AGIs $50k-75k, 0.6% for AGIs $75k-100k, 0.9% for AGIs $100k-200k, 1.8% for AGIs over 200k)
Net capital gain/loss in AGI: +$37,211 (reported on 19.5% of returns)
Here:
+$37,211
State:
+$35,319
(% of AGI for various income ranges: 0.4% for AGIs $50k-75k, 0.1% for AGIs $75k-100k, 0.8% for AGIs $100k-200k, 17.1% for AGIs over 200k)
Profit/loss from business: +$22,083 (reported on 18.4% of returns)
Here:
+$22,083
State:
+$13,732
(% of AGI for various income ranges: 9.4% for AGIs below $25k, 3.9% for AGIs $25k-50k, 2.5% for AGIs $50k-75k, 2.0% for AGIs $75k-100k, 2.3% for AGIs $100k-200k, 5.9% for AGIs over 200k)
Taxable individual retirement arrangement distribution: $21,034 (reported on 7.4% of returns)
78261:
$21,034
Texas:
$19,511
(% of AGI for various income ranges: 1.8% for AGIs below $25k, 2.6% for AGIs $25k-50k, 1.6% for AGIs $50k-75k, 1.5% for AGIs $75k-100k, 1.5% for AGIs $100k-200k, 1.3% for AGIs over 200k)
Self-employment retirement plans: $19,600 (reported on 0.9% of returns)
78261:
$19,600
Texas:
$23,938
Total itemized deductions: $25,065 (16% of AGI, reported on 53.2% of returns)
Here:
$25,065
State:
$24,724
Here:
16.3% of AGI
State:
15.9% of AGI
(% of AGI for various income ranges: 14.8% for AGIs below $25k, 15.4% for AGIs $25k-50k, 17.2% for AGIs $50k-75k, 16.5% for AGIs $75k-100k, 14.7% for AGIs $100k-200k, 8.9% for AGIs over 200k)
Charity contributions: $4,756 (reported on 41.7% of returns)
Here:
$4,756
State:
$6,808
(% of AGI for various income ranges: 0.8% for AGIs below $25k, 1.3% for AGIs $25k-50k, 1.8% for AGIs $50k-75k, 1.8% for AGIs $75k-100k, 2.1% for AGIs $100k-200k, 2.0% for AGIs over 200k)
Taxes paid: $7,766 (reported on 52.6% of returns)
78261:
$7,766
State:
$6,921
(% of AGI for various income ranges: 3.4% for AGIs below $25k, 4.0% for AGIs $25k-50k, 4.8% for AGIs $50k-75k, 4.9% for AGIs $75k-100k, 4.7% for AGIs $100k-200k, 2.9% for AGIs over 200k)
Earned income credit: $2,008 (reported on 8.3% of returns)
Here:
$2,008
State:
$2,570
(% of AGI for various income ranges: 4.6% for AGIs below $25k, 0.9% for AGIs $25k-50k)
Percentage of individuals using paid preparers for their 2012 taxes: 41.3%
Here:
41%
State:
51%
(% for various income ranges: 32.7% for AGIs below $25k, 38.0% for AGIs $25k-50k, 38.0% for AGIs $50k-75k, 41.4% for AGIs $75k-100k, 43.7% for AGIs $100k-200k, 68.2% for AGIs over 200k)
Averages for the 2004 tax year for zip code 78261, filed in 2005:
Average Adjusted Gross Income (AGI) in 2004: $125,710 (Individual Income Tax Returns)
Here:
$125,710
State:
$47,881
Salary/wage: $102,434 (reported on 83.8% of returns)
Here:
$102,434
State:
$41,947
(% of AGI for various income ranges: 298.1% for AGIs below $10k, 67.5% for AGIs $10k-25k, 79.7% for AGIs $25k-50k, 73.2% for AGIs $50k-75k, 76.3% for AGIs $75k-100k, 66.2% for AGIs over 100k)
Taxable interest for individuals: $3,535 (reported on 68.8% of returns)
This zip code:
$3,535
Texas:
$2,255
(% of AGI for various income ranges: 38.7% for AGIs below $10k, 5.4% for AGIs $10k-25k, 1.9% for AGIs $25k-50k, 1.3% for AGIs $50k-75k, 1.1% for AGIs $75k-100k, 1.9% for AGIs over 100k)
Taxable dividends: $5,291 (reported on 48.4% of returns)
Here:
$5,291
State:
$4,261
(% of AGI for various income ranges: 23.7% for AGIs below $10k, 5.8% for AGIs $10k-25k, 1.1% for AGIs $25k-50k, 2.2% for AGIs $50k-75k, 1.1% for AGIs $75k-100k, 2.0% for AGIs over 100k)
Net capital gain/loss: +$15,548 (reported on 44.4% of returns)
Here:
+$15,548
State:
+$16,110
(% of AGI for various income ranges: -7.5% for AGIs below $10k, -1.8% for AGIs $10k-25k, 0.2% for AGIs $25k-50k, 1.0% for AGIs $50k-75k, 1.0% for AGIs $75k-100k, 6.5% for AGIs over 100k)
Profit/loss from business: +$37,127 (reported on 24.4% of returns)
Here:
+$37,127
State:
+$11,013
(% of AGI for various income ranges: 9.0% for AGIs below $10k, 1.6% for AGIs $10k-25k, 3.0% for AGIs $25k-50k, 5.3% for AGIs $50k-75k, 6.6% for AGIs $75k-100k, 7.6% for AGIs over 100k)
IRA payment deduction: $3,881 (reported on 3.9% of returns)
78261:
$3,881
Texas:
$3,120
Self-employed pension: $19,057 (reported on 3.3% of returns)
Here:
$19,057
Texas:
$16,401
Total itemized deductions: $29,336 (16% of AGI, reported on 60.5% of returns)
Here:
$29,336
State:
$19,631
Here:
16.0% of AGI
State:
18.9% of AGI
(% of AGI for various income ranges: 27.6% for AGIs $10k-25k, 19.3% for AGIs $25k-50k, 22.5% for AGIs $50k-75k, 20.4% for AGIs $75k-100k, 12.7% for AGIs over 100k)
Charity contributions deductions: $6,191 (3% of AGI, reported on 54.5% of returns)
Here:
$6,191
State:
$4,753
Here:
3.2% of AGI
State:
4.2% of AGI
(% of AGI for various income ranges: 1.9% for AGIs $10k-25k, 2.2% for AGIs $25k-50k, 2.8% for AGIs $50k-75k, 2.8% for AGIs $75k-100k, 2.7% for AGIs over 100k)
Total tax: $28,498 (reported on 84.5% of returns)
78261:
$28,498
State:
$9,058
(% of AGI for various income ranges: 7.1% for AGIs below $10k, 4.6% for AGIs $10k-25k, 7.3% for AGIs $25k-50k, 8.8% for AGIs $50k-75k, 10.8% for AGIs $75k-100k, 21.2% for AGIs over 100k)
Earned income credit: $1,026 (reported on 3.7% of returns)
Here:
$1,026
State:
$2,024
Percentage of individuals using paid preparers for their 2004 taxes: 54.7%
Here:
55%
State:
57%
(% for various income ranges: 47.3% for AGIs below $10k, 49.5% for AGIs $10k-25k, 42.9% for AGIs $25k-50k, 55.1% for AGIs $50k-75k, 54.8% for AGIs $75k-100k, 62.2% for AGIs over 100k)
Likely homosexual households (counted as self-reported same-sex unmarried-partner households)
Lesbian couples: 0.2% of all households
Gay men: 0.1% of all households
Household received Food Stamps/SNAP in the past 12 months: 58 Household did not receive Food Stamps/SNAP in the past 12 months: 9,372
Women who had a birth in the past 12 months: 427 (435 now married, 0 unmarried) Women who did not have a birth in the past 12 months: 6,494 (3,647 now married, 2,821 unmarried)
Housing units in zip code 78261 with a mortgage: 6,241 (294 second mortgage, 58 home equity loan, 209 both second mortgage and home equity loan) Houses without a mortgage: 10
Median monthly owner costs for units with a mortgage: $2,331 Median monthly owner costs for units without a mortgage: $941
Residents with income below the poverty level in 2022:
This zip code:
3.2%
Whole state:
14.0%
Residents with income below 50% of the poverty level in 2022:
This zip code:
0.5%
Whole state:
7.4%
Median number of rooms in houses and condos:
Here:
7.9
State:
6.3
Median number of rooms in apartments:
Here:
4.8
State:
4.0
Notable locations in this zip code not listed on our city pages
Size of family households: 2,046 2-persons, 2,279 3-persons, 1,356 4-persons, 946 5-persons, 41 6-persons, 175 7-or-more-persons
Size of nonfamily households: 2,071 1-person, 422 2-persons, 113 3-persons
5,717 married couples with children.
825 single-parent households (361 men, 464 women).
73.5% of residents of 78261 zip code speak English at home.
17.8% of residents speak Spanish at home (88% very well, 9% well, 3% not well).
7.0% of residents speak other Indo-European language at home (81% very well, 10% well, 8% not well, 1% not at all).
1.3% of residents speak Asian or Pacific Island language at home (67% very well, 22% well, 11% not well).
0.4% of residents speak other language at home (100% not at all).
Foreign born population: 3,187 (12.1%) (78.0% of them are naturalized citizens)
Housing units lacking complete plumbing facilities: 0.5% Housing units lacking complete kitchen facilities: 1.1%
64.2%Electricity
31.6%Utility gas
2.6%Bottled, tank, or LP gas
1.2%Solar energy
Population in 1990: 487. Population change in the 1990s: +632 (+129.8%).
Place of birth for U.S.-born residents:
This state: 13,691
Northeast: 829
Midwest: 1,799
South: 2,725
West: 3,684
43% of the 78261 zip code residents lived in the same house 5 years ago. Out of people who lived in different houses, 89% lived in this county. Out of people who lived in different counties, 50% lived in Texas.
89% of the 78261 zip code residents lived in the same house 1 year ago. Out of people who lived in different houses, 35% moved from this county. Out of people who lived in different houses, 41% moved from different county within same state. Out of people who lived in different houses, 28% moved from different state.
Private vs. public school enrollment:
Students in private schools in grades 1 to 8 (elementary and middle school): 563
Here:
19.3%
Texas:
8.8%
Students in private schools in grades 9 to 12 (high school): 125
Here:
5.8%
Texas:
8.0%
Students in private undergraduate colleges: 102
Here:
9.9%
Texas:
16.2%
Occupation by median earnings in the past 12 months ($)
153,465Fire fighting and prevention, and other protective service workers including supervisors
121,216Life, physical, and social science occupations
114,645Transportation occupations
102,091Architecture and engineering occupations
96,981Health diagnosing and treating practitioners and other technical occupations
94,829Management occupations
Companies with federal contracts located in this zip code:
D & D MACHINERY & SALES, INC (2420 WR LARSON RD in SAN ANTONIO, TX; small business) : $10,024,603 in 37 contractsfrom 1999 to 2006
Contracts for Aircraft Alarm and Signal Systems, Aircraft Ground Servicing Equipment, Airfield Specialized Trucks and Trailers, Conveyors, and moreby Air Force, Navy, Army, Defense Logistics Agency, and others Signed by year:2000: $480,054; 2001: $194,340; 2002: $282,448; 2003: $1,421,228; 2004: $6,068,294; 2005: $152,267; 2006: $13,136.
Biggest contracts:
$5,999,999 with Air Force for Aircraft Alarm and Signal Systems. Signed on 2004-07-30. Completion date: 2005-07-30.
$1,383,900 with Air Force for Aircraft Ground Servicing Equipment. Signed on 1999-12-08. Completion date: 2000-09-30.
$369,950, same as above.Signed on 2003-08-18. Completion date: 2004-03-31.
$304,351 with Air Force for Airfield Specialized Trucks and Trailers. Signed on 2003-07-16. Completion date: 2004-01-15.
MAJOMED CORPORATION (27671 RAMBLEWOOD ST in SAN ANTONIO, TX; small business) : $443,755 in 9 contractsfrom 1999 to 2004
Contracts for Internal Medicine Services by Army Signed by year:2000: $69,996; 2001: $75,295; 2002: $73,989; 2003: $75,990; 2004: $80,481; 2005: $0; 2006: $0.
Biggest contracts:
$83,328 with Army for Internal Medicine Services. Signed on 2004-10-06. Completion date: 2005-09-30.
$75,990, same as above.Signed on 2003-11-04. Completion date: 2004-09-30.
$75,295, same as above.Signed on 2001-10-23. Completion date: 2004-09-30.
$73,989, same as above.Signed on 2002-10-21. Completion date: 2004-09-30.
Top industries in this zip code by the number of employees in 2005:
Other Services (except Public Administration): Other Similar Organizations (except Business, Professional, Labor, and Political Organizations) (100-249 employees: 1 establishment)
Construction: Highway, Street, and Bridge Construction (20-49: 1)
Health Care and Social Assistance: Child Day Care Services (20-49: 1)
Construction: New Single-Family Housing Construction (except Operative Builders) (10-19: 1, 1-4: 4)
Finance and Insurance: Mortgage and Nonmortgage Loan Brokers (10-19: 1, 1-4: 1)
Construction: Roofing Contractors (10-19: 1)
Construction: Plumbing, Heating, and Air-Conditioning Contractors (10-19: 1)
Wholesale Trade: Medical, Dental, and Hospital Equipment and Supplies Merchant Wholesalers (10-19: 1)
Fatal accident statistics in 2012:
Fatal accident count: 2
Vehicles involved in fatal accidents: 2
Fatal accidents caused by drunken drivers: 1
Fatalities: 2
Persons involved in fatal accidents: 3
Pedestrians involved in fatal accidents: 0
Fatal accident statistics in 2010:
Fatal accident count: 1
Vehicles involved in fatal accidents: 1
Fatal accidents caused by drunken drivers: 0
Fatalities: 1
Persons involved in fatal accidents: 1
Pedestrians involved in fatal accidents: 0
Home Mortgage Disclosure Act Aggregated Statistics For Year 2009 (Based on 2 partial tracts)
A) FHA, FSA/RHS & VA Home Purchase Loans
B) Conventional Home Purchase Loans
C) Refinancings
D) Home Improvement Loans
F) Non-occupant Loans on < 5 Family Dwellings (A B C & D)
G) Loans On Manufactured Home Dwelling (A B C & D)
Number
Average Value
Number
Average Value
Number
Average Value
Number
Average Value
Number
Average Value
Number
Average Value
LOANS ORIGINATED
467
$204,043
271
$195,753
514
$214,319
25
$45,683
48
$172,855
0
$0
APPLICATIONS APPROVED, NOT ACCEPTED
29
$177,932
25
$181,907
69
$214,301
2
$35,120
4
$239,035
0
$0
APPLICATIONS DENIED
57
$201,482
52
$261,190
192
$210,018
21
$39,470
10
$225,359
0
$0
APPLICATIONS WITHDRAWN
79
$202,332
60
$196,573
153
$217,770
12
$97,584
14
$161,679
1
$120,650
FILES CLOSED FOR INCOMPLETENESS
2
$220,235
4
$234,698
25
$181,973
0
$0
2
$95,860
0
$0
Aggregated Statistics For Year 2008 (Based on 2 partial tracts)
A) FHA, FSA/RHS & VA Home Purchase Loans
B) Conventional Home Purchase Loans
C) Refinancings
D) Home Improvement Loans
F) Non-occupant Loans on < 5 Family Dwellings (A B C & D)
Number
Average Value
Number
Average Value
Number
Average Value
Number
Average Value
Number
Average Value
LOANS ORIGINATED
427
$196,720
395
$198,520
203
$207,630
42
$54,975
61
$174,018
APPLICATIONS APPROVED, NOT ACCEPTED
46
$180,532
80
$173,565
50
$174,189
11
$48,156
14
$130,984
APPLICATIONS DENIED
64
$198,814
64
$216,310
144
$201,005
53
$44,688
21
$171,143
APPLICATIONS WITHDRAWN
64
$193,119
81
$190,041
82
$211,065
7
$84,766
7
$154,183
FILES CLOSED FOR INCOMPLETENESS
5
$204,452
13
$178,058
13
$275,064
2
$28,510
5
$177,676
Aggregated Statistics For Year 2007 (Based on 2 partial tracts)
A) FHA, FSA/RHS & VA Home Purchase Loans
B) Conventional Home Purchase Loans
C) Refinancings
D) Home Improvement Loans
E) Loans on Dwellings For 5+ Families
F) Non-occupant Loans on < 5 Family Dwellings (A B C & D)
G) Loans On Manufactured Home Dwelling (A B C & D)
Number
Average Value
Number
Average Value
Number
Average Value
Number
Average Value
Number
Average Value
Number
Average Value
Number
Average Value
LOANS ORIGINATED
288
$185,587
968
$166,360
166
$224,049
37
$63,074
1
$9,916,800
112
$158,632
1
$78,510
APPLICATIONS APPROVED, NOT ACCEPTED
15
$193,267
178
$147,433
37
$209,459
18
$48,712
0
$0
25
$148,223
1
$41,320
APPLICATIONS DENIED
33
$167,233
112
$154,640
130
$202,888
47
$41,742
0
$0
28
$200,373
1
$61,150
APPLICATIONS WITHDRAWN
69
$167,244
179
$169,153
69
$192,515
12
$95,793
0
$0
17
$148,704
0
$0
FILES CLOSED FOR INCOMPLETENESS
2
$286,760
18
$193,974
22
$254,606
2
$57,850
0
$0
2
$202,055
0
$0
Aggregated Statistics For Year 2006 (Based on 2 partial tracts)
A) FHA, FSA/RHS & VA Home Purchase Loans
B) Conventional Home Purchase Loans
C) Refinancings
D) Home Improvement Loans
F) Non-occupant Loans on < 5 Family Dwellings (A B C & D)
G) Loans On Manufactured Home Dwelling (A B C & D)
Number
Average Value
Number
Average Value
Number
Average Value
Number
Average Value
Number
Average Value
Number
Average Value
LOANS ORIGINATED
268
$169,979
1,146
$141,285
105
$235,414
44
$55,745
219
$125,401
0
$0
APPLICATIONS APPROVED, NOT ACCEPTED
12
$190,554
184
$141,943
17
$232,607
12
$47,036
40
$122,224
1
$34,710
APPLICATIONS DENIED
19
$177,763
193
$137,448
91
$220,985
35
$58,273
55
$129,069
1
$32,230
APPLICATIONS WITHDRAWN
87
$154,793
359
$136,105
85
$206,046
6
$46,278
96
$126,344
1
$138,840
FILES CLOSED FOR INCOMPLETENESS
2
$115,285
34
$146,710
16
$212,798
2
$163,215
12
$150,818
0
$0
Aggregated Statistics For Year 2005 (Based on 2 partial tracts)
A) FHA, FSA/RHS & VA Home Purchase Loans
B) Conventional Home Purchase Loans
C) Refinancings
D) Home Improvement Loans
E) Loans on Dwellings For 5+ Families
F) Non-occupant Loans on < 5 Family Dwellings (A B C & D)
G) Loans On Manufactured Home Dwelling (A B C & D)
Number
Average Value
Number
Average Value
Number
Average Value
Number
Average Value
Number
Average Value
Number
Average Value
Number
Average Value
LOANS ORIGINATED
149
$159,867
736
$128,502
108
$243,604
17
$164,356
0
$0
98
$117,568
0
$0
APPLICATIONS APPROVED, NOT ACCEPTED
13
$181,172
93
$133,459
17
$209,371
9
$40,586
0
$0
10
$155,281
0
$0
APPLICATIONS DENIED
6
$141,865
103
$116,161
70
$244,107
23
$89,107
0
$0
12
$83,948
2
$26,030
APPLICATIONS WITHDRAWN
43
$151,097
132
$130,365
57
$232,813
7
$214,510
0
$0
30
$122,500
0
$0
FILES CLOSED FOR INCOMPLETENESS
1
$198,340
17
$153,370
37
$236,909
0
$0
1
$1,702,380
0
$0
0
$0
Aggregated Statistics For Year 2004 (Based on 2 partial tracts)
A) FHA, FSA/RHS & VA Home Purchase Loans
B) Conventional Home Purchase Loans
C) Refinancings
D) Home Improvement Loans
F) Non-occupant Loans on < 5 Family Dwellings (A B C & D)
G) Loans On Manufactured Home Dwelling (A B C & D)
Number
Average Value
Number
Average Value
Number
Average Value
Number
Average Value
Number
Average Value
Number
Average Value
LOANS ORIGINATED
119
$147,571
385
$152,214
141
$242,733
21
$73,550
27
$133,234
2
$102,475
APPLICATIONS APPROVED, NOT ACCEPTED
4
$167,965
47
$189,070
17
$241,649
4
$54,750
4
$257,217
1
$32,230
APPLICATIONS DENIED
6
$140,350
48
$142,761
47
$254,953
10
$50,080
7
$147,336
2
$43,800
APPLICATIONS WITHDRAWN
40
$167,181
80
$153,669
36
$221,314
2
$53,715
5
$92,888
0
$0
FILES CLOSED FOR INCOMPLETENESS
1
$131,400
5
$162,636
30
$226,929
2
$36,360
2
$242,135
0
$0
Aggregated Statistics For Year 2003 (Based on 2 partial tracts)
A) FHA, FSA/RHS & VA Home Purchase Loans
B) Conventional Home Purchase Loans
C) Refinancings
D) Home Improvement Loans
E) Loans on Dwellings For 5+ Families
F) Non-occupant Loans on < 5 Family Dwellings (A B C & D)
Number
Average Value
Number
Average Value
Number
Average Value
Number
Average Value
Number
Average Value
Number
Average Value
LOANS ORIGINATED
169
$134,542
283
$151,733
293
$224,581
17
$47,396
1
$19,833,600
19
$129,353
APPLICATIONS APPROVED, NOT ACCEPTED
7
$131,161
17
$163,433
36
$195,145
2
$50,825
0
$0
1
$28,920
APPLICATIONS DENIED
5
$153,876
26
$167,600
93
$239,123
7
$63,633
0
$0
5
$348,576
APPLICATIONS WITHDRAWN
36
$135,048
47
$148,312
63
$253,220
4
$46,692
0
$0
2
$143,795
FILES CLOSED FOR INCOMPLETENESS
2
$102,885
9
$155,639
7
$230,920
0
$0
0
$0
0
$0
Aggregated Statistics For Year 2002 (Based on 2 partial tracts)
A) FHA, FSA/RHS & VA Home Purchase Loans
B) Conventional Home Purchase Loans
C) Refinancings
D) Home Improvement Loans
F) Non-occupant Loans on < 5 Family Dwellings (A B C & D)
Number
Average Value
Number
Average Value
Number
Average Value
Number
Average Value
Number
Average Value
LOANS ORIGINATED
44
$140,413
167
$177,424
186
$216,628
10
$77,599
2
$153,710
APPLICATIONS APPROVED, NOT ACCEPTED
2
$102,885
18
$94,393
14
$155,186
2
$30,990
1
$247,920
APPLICATIONS DENIED
1
$106,610
19
$147,534
30
$216,241
7
$77,327
2
$21,485
APPLICATIONS WITHDRAWN
6
$145,860
25
$145,711
30
$234,092
2
$33,055
1
$50,410
FILES CLOSED FOR INCOMPLETENESS
0
$0
5
$208,584
11
$248,221
1
$8,260
0
$0
Aggregated Statistics For Year 2001 (Based on 2 partial tracts)
A) FHA, FSA/RHS & VA Home Purchase Loans
B) Conventional Home Purchase Loans
C) Refinancings
D) Home Improvement Loans
F) Non-occupant Loans on < 5 Family Dwellings (A B C & D)
Number
Average Value
Number
Average Value
Number
Average Value
Number
Average Value
Number
Average Value
LOANS ORIGINATED
66
$132,838
125
$165,035
119
$206,287
12
$31,817
4
$97,722
APPLICATIONS APPROVED, NOT ACCEPTED
1
$105,780
7
$222,537
8
$158,152
1
$33,060
0
$0
APPLICATIONS DENIED
2
$138,835
18
$149,578
21
$146,273
4
$35,122
0
$0
APPLICATIONS WITHDRAWN
33
$126,189
40
$147,326
15
$164,564
0
$0
1
$31,400
FILES CLOSED FOR INCOMPLETENESS
1
$116,520
1
$84,290
4
$209,080
0
$0
0
$0
Aggregated Statistics For Year 2000 (Based on 2 partial tracts)
A) FHA, FSA/RHS & VA Home Purchase Loans
B) Conventional Home Purchase Loans
C) Refinancings
D) Home Improvement Loans
F) Non-occupant Loans on < 5 Family Dwellings (A B C & D)
Number
Average Value
Number
Average Value
Number
Average Value
Number
Average Value
Number
Average Value
LOANS ORIGINATED
28
$128,269
114
$180,655
40
$235,834
12
$36,568
4
$72,722
APPLICATIONS APPROVED, NOT ACCEPTED
2
$70,655
12
$121,550
5
$163,132
3
$30,027
0
$0
APPLICATIONS DENIED
2
$121,070
11
$162,575
8
$169,102
6
$23,552
0
$0
APPLICATIONS WITHDRAWN
20
$127,638
31
$155,336
7
$296,560
2
$15,700
0
$0
FILES CLOSED FOR INCOMPLETENESS
0
$0
5
$141,480
3
$218,997
0
$0
0
$0
Aggregated Statistics For Year 1999 (Based on 1 partial tract)
A) FHA, FSA/RHS & VA Home Purchase Loans
B) Conventional Home Purchase Loans
C) Refinancings
D) Home Improvement Loans
F) Non-occupant Loans on < 5 Family Dwellings (A B C & D)
Detailed PMIC statistics for the following Tracts:1219.01
2002 - 2018 National Fire Incident Reporting System (NFIRS) incidents
According to the data from the years 2002 - 2018 the average number of fire incidents per year is 12. The highest number of fire incidents - 46 took place in 2017, and the least - 1 in 2003. The data has a rising trend.
When looking into fire subcategories, the most incidents belonged to: Structure Fires (48.3%), and Outside Fires (35.9%).
Fire incident types reported to NFIRS in Zip Code 78261


 Nearest zip codes: 78259, 78266, 78260, 78163, 78247, 78258.


 : $10,024,603 in 37 contracts from 1999 to 2006


 According to the data from the years 2002 - 2018 the average number of fire incidents per year is 12. The highest number of fire incidents - 46 took place in 2017, and the least - 1 in 2003. The data has a rising trend.
 When looking into fire subcategories, the most incidents belonged to: Structure Fires (48.3%), and Outside Fires (35.9%).