Estimated zip code population in 2022: 15,802 Zip code population in 2010: 9,838 Zip code population in 2000: 7,854
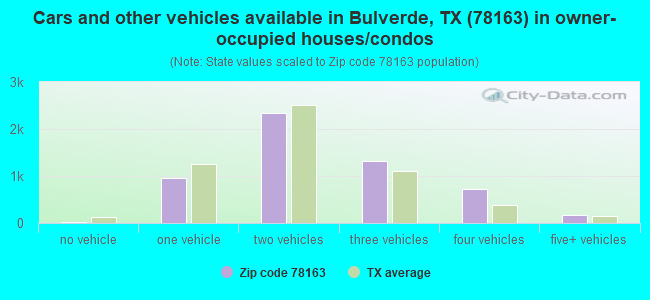
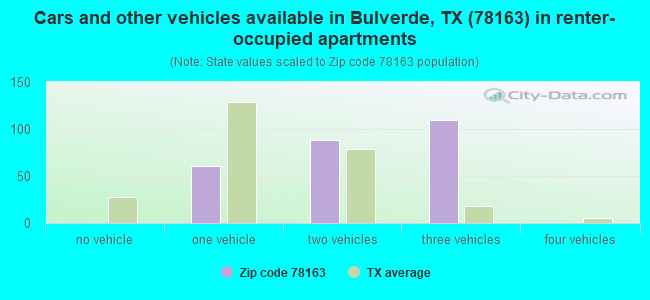
Houses and condos: 6,072 Renter-occupied apartments: 265
% of renters here:
5%
State:
38%
March 2022 cost of living index in zip code 78163: 81.7 (low, U.S. average is 100)
Land area: 77.1 sq. mi. Water area: 0.1 sq. mi.
Population density: 205 people per square mile
(very low).
OSM Map
General Map
Google Map
MSN Map
OSM Map
General Map
Google Map
MSN Map
OSM Map
General Map
Google Map
MSN Map
OSM Map
General Map
Google Map
MSN Map
Please wait while loading the map...
Real estate property taxes paid for housing units in 2022:
This zip code:
1.2% ($5,878)
Texas:
1.5% ($4,050)
Median real estate property taxes paid for housing units with mortgages in 2022: $6,908 (1.3%) Median real estate property taxes paid for housing units with no mortgage in 2022: $4,654 (1.1%)
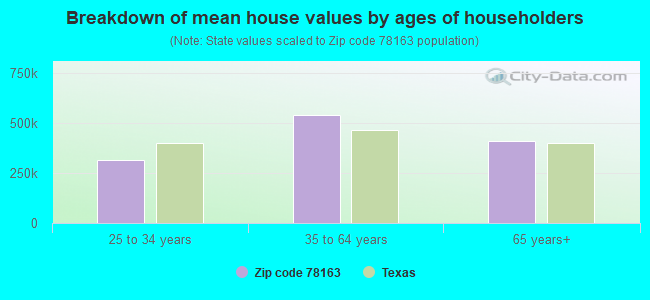
Estimated median house/condo value in 2022: $475,586
78163:
$475,586
Texas:
$275,400
According to our research of Texas and other state lists, there were 10 registered sex offenders living in 78163 zip code as of May 28, 2024. The ratio of all residents to sex offenders in zip code 78163 is 1,081 to 1. The ratio of registered sex offenders to all residents in this zip code is much lower than the state average.
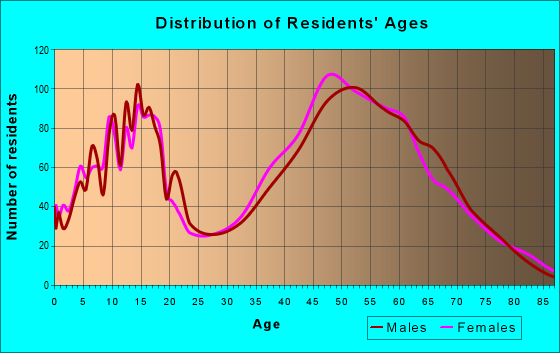
Median resident age:
This zip code:
46.8 years
Texas median age:
35.6 years
Average household size:
This zip code:
2.7 people
Texas:
2.6 people
Averages for the 2020 tax year for zip code 78163, filed in 2021:
Average Adjusted Gross Income (AGI) in 2020: $102,486 (Individual Income Tax Returns)
Here:
$102,486
State:
$77,054
Salary/wage: $86,127 (reported on 79.3% of returns)
Here:
$86,127
State:
$62,766
(% of AGI for various income ranges: 1048.8% for AGIs below $25k, 3227.3% for AGIs $25k-50k, 6072.8% for AGIs $50k-75k, 9092.2% for AGIs $75k-100k, 17575.6% for AGIs $100k-200k, 59024.8% for AGIs over 200k)
Taxable interest for individuals: $1,454 (reported on 43.8% of returns)
This zip code:
$1,454
Texas:
$2,665
(% of AGI for various income ranges: 26.7% for AGIs below $25k, 34.9% for AGIs $25k-50k, 62.5% for AGIs $50k-75k, 70.7% for AGIs $75k-100k, 113.3% for AGIs $100k-200k, 671.3% for AGIs over 200k)
Ordinary dividends: $3,016 (reported on 47.5% of returns)
Here:
$3,016
State:
$10,044
(% of AGI for various income ranges: 35.4% for AGIs below $25k, 75.8% for AGIs $25k-50k, 109.4% for AGIs $50k-75k, 179.0% for AGIs $75k-100k, 270.9% for AGIs $100k-200k, 1583.5% for AGIs over 200k)
Net capital gain/loss in AGI: +$18,448 (reported on 25.4% of returns)
Here:
+$18,448
State:
+$39,590
(% of AGI for various income ranges: 16.8% for AGIs below $25k, 67.6% for AGIs $25k-50k, 113.2% for AGIs $50k-75k, 173.1% for AGIs $75k-100k, 520.7% for AGIs $100k-200k, 8761.9% for AGIs over 200k)
Profit/loss from business: +$18,783 (reported on 22.1% of returns)
Here:
+$18,783
State:
+$10,888
(% of AGI for various income ranges: 181.4% for AGIs below $25k, 431.6% for AGIs $25k-50k, 336.7% for AGIs $50k-75k, 380.0% for AGIs $75k-100k, 769.6% for AGIs $100k-200k, 3955.2% for AGIs over 200k)
Taxable individual retirement arrangement distribution: $24,751 (reported on 11.4% of returns)
78163:
$24,751
Texas:
$24,740
(% of AGI for various income ranges: 63.7% for AGIs below $25k, 164.4% for AGIs $25k-50k, 245.9% for AGIs $50k-75k, 458.1% for AGIs $75k-100k, 780.9% for AGIs $100k-200k, 1900.0% for AGIs over 200k)
Self-employed (Keogh) retirement plans: $20,483 (reported on 0.8% of returns)
78163:
$20,483
Texas:
$29,298
(% of AGI for various income ranges: 60.2% for AGIs $75k-100k, 283.9% for AGIs over 200k)
Total itemized deductions: $35,301 (reported on 14.4% of returns)
Here:
$35,301
State:
$40,428
(% of AGI for various income ranges: 80.0% for AGIs below $25k, 248.0% for AGIs $25k-50k, 435.9% for AGIs $50k-75k, 601.7% for AGIs $75k-100k, 1142.3% for AGIs $100k-200k, 5134.2% for AGIs over 200k)
Charity contributions: $11,352 (reported on 12.0% of returns)
Here:
$11,352
State:
$18,201
(% of AGI for various income ranges: 5.1% for AGIs below $25k, 21.1% for AGIs $25k-50k, 48.7% for AGIs $50k-75k, 88.6% for AGIs $75k-100k, 300.7% for AGIs $100k-200k, 1889.4% for AGIs over 200k)
Taxes paid: $8,035 (reported on 14.4% of returns)
78163:
$8,035
State:
$7,821
(% of AGI for various income ranges: 14.5% for AGIs below $25k, 48.5% for AGIs $25k-50k, 115.2% for AGIs $50k-75k, 159.0% for AGIs $75k-100k, 287.1% for AGIs $100k-200k, 1028.1% for AGIs over 200k)
Earned income credit: $2,132 (reported on 7.3% of returns)
Here:
$2,132
State:
$2,584
(% of AGI for various income ranges: 53.9% for AGIs below $25k, 60.3% for AGIs $25k-50k)
Percentage of individuals using paid preparers for their 2020 taxes: 91.4%
Here:
91%
State:
92%
(% for various income ranges: 89.4% for AGIs below $25k, 90.6% for AGIs $25k-50k, 91.8% for AGIs $50k-75k, 92.0% for AGIs $75k-100k, 93.0% for AGIs $100k-200k, 91.5% for AGIs over 200k)
Averages for the 2012 tax year for zip code 78163, filed in 2013:
Average Adjusted Gross Income (AGI) in 2012: $86,884 (Individual Income Tax Returns)
Here:
$86,884
State:
$65,384
Salary/wage: $71,698 (reported on 80.1% of returns)
Here:
$71,698
State:
$52,524
(% of AGI for various income ranges: 70.7% for AGIs below $25k, 63.9% for AGIs $25k-50k, 65.5% for AGIs $50k-75k, 67.4% for AGIs $75k-100k, 74.1% for AGIs $100k-200k, 57.0% for AGIs over 200k)
Taxable interest for individuals: $1,669 (reported on 48.1% of returns)
This zip code:
$1,669
Texas:
$2,372
(% of AGI for various income ranges: 2.4% for AGIs below $25k, 1.0% for AGIs $25k-50k, 1.3% for AGIs $50k-75k, 0.7% for AGIs $75k-100k, 0.8% for AGIs $100k-200k, 0.9% for AGIs over 200k)
Ordinary dividends: $4,466 (reported on 27.2% of returns)
Here:
$4,466
State:
$9,721
(% of AGI for various income ranges: 2.3% for AGIs below $25k, 1.6% for AGIs $25k-50k, 0.9% for AGIs $50k-75k, 1.3% for AGIs $75k-100k, 1.1% for AGIs $100k-200k, 1.7% for AGIs over 200k)
Net capital gain/loss in AGI: +$15,321 (reported on 22.2% of returns)
Here:
+$15,321
State:
+$35,319
(% of AGI for various income ranges: 0.5% for AGIs $25k-50k, 0.8% for AGIs $50k-75k, 0.7% for AGIs $75k-100k, 1.2% for AGIs $100k-200k, 10.0% for AGIs over 200k)
Profit/loss from business: +$19,194 (reported on 24.3% of returns)
Here:
+$19,194
State:
+$13,732
(% of AGI for various income ranges: 10.5% for AGIs below $25k, 7.7% for AGIs $25k-50k, 6.2% for AGIs $50k-75k, 3.8% for AGIs $75k-100k, 4.3% for AGIs $100k-200k, 5.7% for AGIs over 200k)
Taxable individual retirement arrangement distribution: $19,600 (reported on 12.0% of returns)
78163:
$19,600
Texas:
$19,511
(% of AGI for various income ranges: 2.6% for AGIs below $25k, 2.8% for AGIs $25k-50k, 2.7% for AGIs $50k-75k, 4.1% for AGIs $75k-100k, 3.1% for AGIs $100k-200k, 1.8% for AGIs over 200k)
Self-employment retirement plans: $18,720 (reported on 1.0% of returns)
78163:
$18,720
Texas:
$23,938
(% of AGI for various income ranges: 0.3% for AGIs $100k-200k, 0.4% for AGIs over 200k)
Total itemized deductions: $23,332 (16% of AGI, reported on 42.9% of returns)
Here:
$23,332
State:
$24,724
Here:
16.3% of AGI
State:
15.9% of AGI
(% of AGI for various income ranges: 11.9% for AGIs below $25k, 14.6% for AGIs $25k-50k, 15.1% for AGIs $50k-75k, 13.5% for AGIs $75k-100k, 12.7% for AGIs $100k-200k, 8.0% for AGIs over 200k)
Charity contributions: $4,899 (reported on 36.1% of returns)
Here:
$4,899
State:
$6,808
(% of AGI for various income ranges: 1.1% for AGIs below $25k, 1.6% for AGIs $25k-50k, 1.8% for AGIs $50k-75k, 1.8% for AGIs $75k-100k, 2.3% for AGIs $100k-200k, 2.2% for AGIs over 200k)
Taxes paid: $6,940 (reported on 42.5% of returns)
78163:
$6,940
State:
$6,921
(% of AGI for various income ranges: 2.5% for AGIs below $25k, 3.6% for AGIs $25k-50k, 4.4% for AGIs $50k-75k, 4.0% for AGIs $75k-100k, 3.9% for AGIs $100k-200k, 2.4% for AGIs over 200k)
Earned income credit: $2,072 (reported on 8.3% of returns)
Here:
$2,072
State:
$2,570
(% of AGI for various income ranges: 3.9% for AGIs below $25k, 0.6% for AGIs $25k-50k)
Percentage of individuals using paid preparers for their 2012 taxes: 47.1%
Here:
47%
State:
51%
(% for various income ranges: 38.6% for AGIs below $25k, 46.2% for AGIs $25k-50k, 50.0% for AGIs $50k-75k, 44.4% for AGIs $75k-100k, 53.2% for AGIs $100k-200k, 63.9% for AGIs over 200k)
Averages for the 2004 tax year for zip code 78163, filed in 2005:
Average Adjusted Gross Income (AGI) in 2004: $64,777 (Individual Income Tax Returns)
Here:
$64,777
State:
$47,881
Salary/wage: $58,237 (reported on 80.7% of returns)
Here:
$58,237
State:
$41,947
(% of AGI for various income ranges: 154.8% for AGIs below $10k, 70.0% for AGIs $10k-25k, 67.6% for AGIs $25k-50k, 71.0% for AGIs $50k-75k, 80.9% for AGIs $75k-100k, 70.5% for AGIs over 100k)
Taxable interest for individuals: $1,512 (reported on 57.8% of returns)
This zip code:
$1,512
Texas:
$2,255
(% of AGI for various income ranges: 9.2% for AGIs below $10k, 3.2% for AGIs $10k-25k, 1.8% for AGIs $25k-50k, 1.8% for AGIs $50k-75k, 0.7% for AGIs $75k-100k, 1.1% for AGIs over 100k)
Taxable dividends: $2,319 (reported on 30.9% of returns)
Here:
$2,319
State:
$4,261
(% of AGI for various income ranges: 4.7% for AGIs below $10k, 1.3% for AGIs $10k-25k, 1.2% for AGIs $25k-50k, 1.1% for AGIs $50k-75k, 0.7% for AGIs $75k-100k, 1.2% for AGIs over 100k)
Net capital gain/loss: +$9,209 (reported on 26.9% of returns)
Here:
+$9,209
State:
+$16,110
(% of AGI for various income ranges: -2.0% for AGIs below $10k, 1.4% for AGIs $10k-25k, 0.5% for AGIs $25k-50k, 1.2% for AGIs $50k-75k, 1.0% for AGIs $75k-100k, 6.3% for AGIs over 100k)
Profit/loss from business: +$12,173 (reported on 25.6% of returns)
Here:
+$12,173
State:
+$11,013
(% of AGI for various income ranges: 12.4% for AGIs below $10k, 11.6% for AGIs $10k-25k, 6.3% for AGIs $25k-50k, 4.7% for AGIs $50k-75k, 4.7% for AGIs $75k-100k, 4.0% for AGIs over 100k)
IRA payment deduction: $3,461 (reported on 3.5% of returns)
78163:
$3,461
Texas:
$3,120
(% of AGI for various income ranges: 0.5% for AGIs $10k-25k, 0.3% for AGIs $25k-50k, 0.3% for AGIs $50k-75k, 0.2% for AGIs $75k-100k, 0.1% for AGIs over 100k)
Self-employed pension: $11,048 (reported on 1.0% of returns)
Here:
$11,048
Texas:
$16,401
Total itemized deductions: $20,121 (20% of AGI, reported on 46.2% of returns)
Here:
$20,121
State:
$19,631
Here:
19.6% of AGI
State:
18.9% of AGI
(% of AGI for various income ranges: 25.8% for AGIs below $10k, 13.1% for AGIs $10k-25k, 16.4% for AGIs $25k-50k, 16.3% for AGIs $50k-75k, 16.9% for AGIs $75k-100k, 12.7% for AGIs over 100k)
Charity contributions deductions: $4,084 (4% of AGI, reported on 40.2% of returns)
Here:
$4,084
State:
$4,753
Here:
3.8% of AGI
State:
4.2% of AGI
(% of AGI for various income ranges: 1.2% for AGIs below $10k, 1.0% for AGIs $10k-25k, 2.1% for AGIs $25k-50k, 2.2% for AGIs $50k-75k, 2.7% for AGIs $75k-100k, 2.8% for AGIs over 100k)
Total tax: $10,690 (reported on 82.9% of returns)
78163:
$10,690
State:
$9,058
(% of AGI for various income ranges: 6.0% for AGIs below $10k, 5.4% for AGIs $10k-25k, 7.4% for AGIs $25k-50k, 9.0% for AGIs $50k-75k, 10.1% for AGIs $75k-100k, 17.9% for AGIs over 100k)
Earned income credit: $1,843 (reported on 6.8% of returns)
Here:
$1,843
State:
$2,024
Percentage of individuals using paid preparers for their 2004 taxes: 49.8%
Here:
50%
State:
57%
(% for various income ranges: 41.6% for AGIs below $10k, 48.8% for AGIs $10k-25k, 46.9% for AGIs $25k-50k, 53.7% for AGIs $50k-75k, 51.6% for AGIs $75k-100k, 56.9% for AGIs over 100k)
Likely homosexual households (counted as self-reported same-sex unmarried-partner households)
Lesbian couples: 0.0% of all households
Gay men: 0.2% of all households
Household received Food Stamps/SNAP in the past 12 months: 180 Household did not receive Food Stamps/SNAP in the past 12 months: 5,606
Women who had a birth in the past 12 months: 178 (149 now married, 30 unmarried) Women who did not have a birth in the past 12 months: 2,809 (1,510 now married, 1,291 unmarried)
Housing units in zip code 78163 with a mortgage: 3,237 (207 second mortgage, 149 both second mortgage and home equity loan) Houses without a mortgage: 53
Median monthly owner costs for units with a mortgage: $2,381 Median monthly owner costs for units without a mortgage: $888
Residents with income below the poverty level in 2022:
This zip code:
4.6%
Whole state:
14.0%
Residents with income below 50% of the poverty level in 2022:
This zip code:
2.4%
Whole state:
7.4%
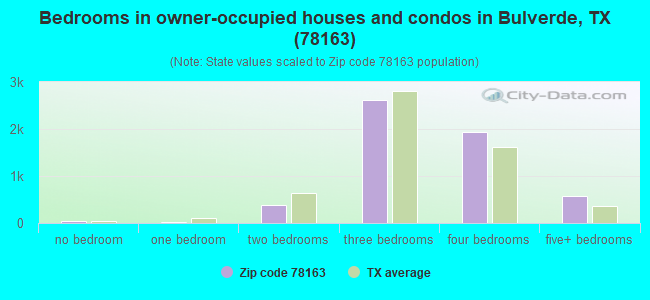
Median number of rooms in houses and condos:
Here:
7.4
State:
6.3
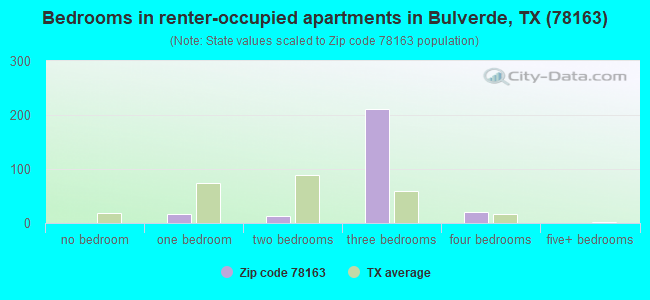
Median number of rooms in apartments:
Here:
5.8
State:
4.0
Notable locations in this zip code not listed on our city pages
Notable locations in zip code 78163: Bulverde Community Center (A), Canyon View Acres (B), Leon Springs Volunteer Fire Department (C), Bulverde Fire Department Station 1 Headquarters (D), Bulverde Fire Department Station 2 (E). Display/hide their locations on the map
Churches in zip code 78163 include: Saint Pauls Church (A), Saint Paul Lutheran Church (B), Smithson Valley Evangelical Free Church (C), Bulverde Church of Christ (D), Bulverde Baptist Church (E), Saint Joseph Chapel (F), Saint Joseph Catholic Church (G). Display/hide their locations on the map
Cemeteries: Schlather Cemetery (1), Weidner Cemetery (2), Lex Cemetery (3), Kruckemeyer Cemetery (4), Koch Cemetery (5), Kabelmacher Cemetery (6), Peña Cemetery (7). Display/hide their locations on the map
In group quarters: 40 (-1 institutionalized population)
Size of family households: 2,765 2-persons, 1,017 3-persons, 638 4-persons, 389 5-persons, 137 6-persons, 90 7-or-more-persons
Size of nonfamily households: 567 1-person, 195 2-persons
2,759 married couples with children.
239 single-parent households (45 men, 194 women).
84.8% of residents of 78163 zip code speak English at home.
10.2% of residents speak Spanish at home (77% very well, 15% well, 4% not well, 4% not at all).
2.0% of residents speak other Indo-European language at home (83% very well, 17% well).
2.4% of residents speak Asian or Pacific Island language at home (71% very well, 23% well, 6% not well).
1.2% of residents speak other language at home (63% very well, 26% well, 11% not well).
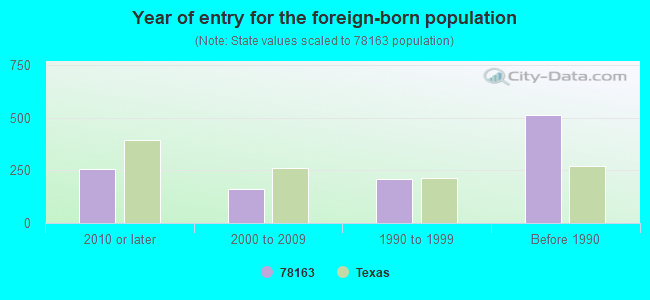
Foreign born population: 1,040 (6.6%) (77.8% of them are naturalized citizens)
This zip code:
6.6%
Whole state:
17.2%
31%Honduras
13%Malaysia
9%Nicaragua
6%Nepal
5%Bhutan
5%Poland
4%Eritrea
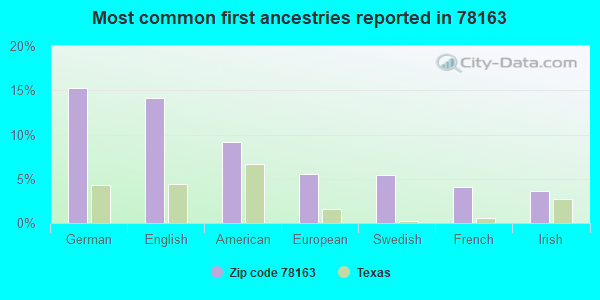
15%German
14%English
9%American
6%European
5%Swedish
4%French
4%Irish
Year of entry for the foreign-born population
2552010 or later
1632000 to 2009
2111990 to 1999
513Before 1990
Facilities with environmental interests located in this zip code:
AMERICAN TELEPHONE AND TELEGRAPH COMPANY (25 MI N L432420 in BULVERDE, TX)
(Resource Conservation and Recovery Act (tracking hazardous waste)) Alternative names: AMERICAN TEL & TEL CO LONG LINES
AEROGLO INC (29890 BULVERDE RD in BULVERDE, TX)
Conditionally Exempt Small Quantity Generators, less than 100 kg/month of hazardous waste (Resource Conservation and Recovery Act (tracking hazardous waste)) Organizations: UNKNOWN (CONTACT/OWNER)
73.5%Electricity
14.0%Utility gas
11.3%Bottled, tank, or LP gas
1.0%Solar energy
Population in 1990: 5,491. Population change in the 1990s: +2,363 (+43.0%).
Place of birth for U.S.-born residents:
This state: 8,623
Northeast: 547
Midwest: 1,603
South: 2,043
West: 1,861
56% of the 78163 zip code residents lived in the same house 5 years ago. Out of people who lived in different houses, 16% lived in this county. Out of people who lived in different counties, 50% lived in Texas.
95% of the 78163 zip code residents lived in the same house 1 year ago. Out of people who lived in different houses, 17% moved from this county. Out of people who lived in different houses, 71% moved from different county within same state. Out of people who lived in different houses, 20% moved from different state.
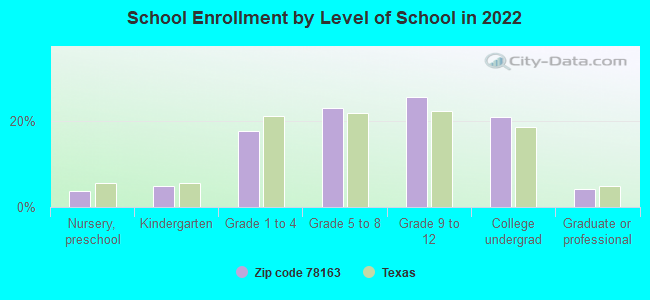
Private vs. public school enrollment:
Students in private schools in grades 1 to 8 (elementary and middle school): 265
Here:
17.2%
Texas:
8.8%
Students in private schools in grades 9 to 12 (high school): 195
Here:
20.0%
Texas:
8.0%
Students in private undergraduate colleges: 63
Here:
8.0%
Texas:
16.2%
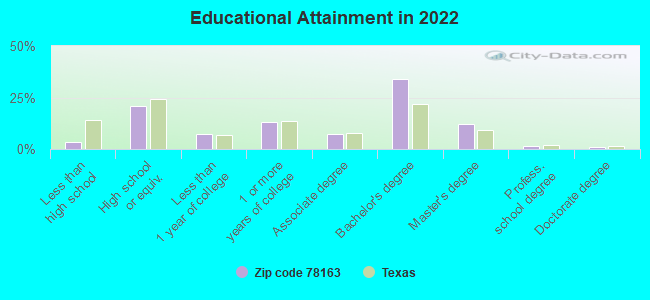
Occupation by median earnings in the past 12 months ($)
126,007Business and financial operations occupations
117,412Management occupations
111,876Computer and mathematical occupations
93,664Sales and related occupations
83,471Architecture and engineering occupations
81,662Health diagnosing and treating practitioners and other technical occupations
Companies with federal contracts located in this zip code (BULVERDE, TX):
ENVIRONMENTAL EXPRESS SERVICES (2631 BULVERDE RD STE 104; small business) : $806,510 in 14 contractsfrom 2001 to 2006
Contracts for Architect - Engineer Services (including landscaping, interior layout, and designing), Other Architect and Engineering Services, Food Items For Resale, Other Natural Resources and Conservation Services, and moreby Air Force, Indian Affairs (Assistant Secretary) Signed by year:2000: $0; 2001: $59,000; 2002: $0; 2003: $0; 2004: $24,473; 2005: $488,817; 2006: $234,220.
Biggest contracts:
$204,175 with Air Force for Architect - Engineer Services (including landscaping, interior layout, and designing). Taking place in VA. Signed on 2005-09-28. Completion date: 2007-01-12.
$143,955 with Air Force for Other Architect and Engineering Services. Taking place in ID. Signed on 2006-05-31. Completion date: 2006-09-30.
$101,276 with Air Force for Architect - Engineer Services (including landscaping, interior layout, and designing). Taking place in VA. Signed on 2005-11-28. Completion date: 2006-11-27.
$79,566 with Air Force for Other Architect and Engineering Services. Taking place in NV. Signed on 2005-09-26. Completion date: 2006-06-19.
24 HOUR POWER, L L C (29774 HWY 281 N STE # 9; small business) : $738,434 in 20 contractsfrom 2001 to 2006
Contracts for Maintenance, Repair and Rebuilding of Equipment -- Electrical and Electronic Equipment Components, Converters, Electrical, Nonrotating, Construction of Structures and Facilities -- EPG Facilities - Other, Including Transmission, Batteries, Nonrechargeable, and moreby Air Force, Department of Defense, Army Signed by year:2000: $0; 2001: $112,137; 2002: $179,524; 2003: $148,630; 2004: $147,327; 2005: $140,733; 2006: $10,083.
Biggest contracts:
$155,638 with Air Force for Maintenance, Repair and Rebuilding of Equipment -- Electrical and Electronic Equipment Components. Taking place in NE. Signed on 2005-10-01. Completion date: 2006-09-30.
$130,396, same as above.Signed on 2004-10-01. Completion date: 2005-09-30.
$125,765, same as above.Signed on 2003-10-01. Completion date: 2006-09-30.
$123,850 with Air Force for Maintenance, Repair and Rebuilding of Equipment -- Electrical and Electronic Equipment Components. Signed on 2002-10-01. Completion date: 2003-09-30.
DENNIS J GRILL, PH D (5991 TEMERITY WAY; small business) : $448,692 in 7 contractsfrom 1999 to 2004
Contracts for Psychiatry Services, Other Medical Services by Army Signed by year:2000: $71,730; 2001: $71,730; 2002: $73,324; 2003: $74,918; 2004: $85,260; 2005: $0; 2006: $0.
Biggest contracts:
$85,260 with Army for Psychiatry Services. Signed on 2004-10-06. Completion date: 2005-09-30.
$74,918, same as above.Signed on 2003-11-03. Completion date: 2004-09-30.
$73,324, same as above.Signed on 2002-10-18. Completion date: 2004-09-30.
$71,730, same as above.Signed on 2001-10-29. Completion date: 2004-09-30.
ALL PHASE TELECOM (6420 FM 1863) : $48,850 in 3 contractsfrom 2002 to 2005
$38,890 with Air Force for Drugs and Biologicals. Signed on 2002-09-30. Completion date: 2002-09-30.
$5,245 with Air Force for Miscellaneous Communication Equipment. Signed on 2005-01-13. Completion date: 2004-12-31.
$4,715 with Air Force for Telephone and Telegraph Equipment. Signed on 2004-11-08. Completion date: 2004-10-31.
AMERICAN CRITICAL ENERGY SYSTE (29774 US HWY 281 N UNIT 2) : $17,917 in 5 contractsfrom 2003 to 2005
Contracts for Maintenance, Repair and Rebuilding of Equipment -- Automatic Data Processing Equipment (Including Firmware), Software, Supplies and Support Equipment, Maintenance, Repair and Rebuilding of Equipment -- Maintenance and Repair Shop Equipment, ADP Facility Operation and Maintenance Services, Automated Information System Design and Integration Services by Army, Air Force Signed by year:2000: $0; 2001: $0; 2002: $0; 2003: $3,230; 2004: $7,781; 2005: $6,906; 2006: $0.
Biggest contracts:
$4,325 with Army for Maintenance, Repair and Rebuilding of Equipment -- Automatic Data Processing Equipment (Including Firmware), Software, Supplies and Support Equipment. Signed on 2004-03-10. Completion date: 2005-03-14.
$3,456 with Air Force for Maintenance, Repair and Rebuilding of Equipment -- Maintenance and Repair Shop Equipment. Signed on 2005-11-30. Completion date: 2006-11-30.
$3,456 with Air Force for ADP Facility Operation and Maintenance Services. Signed on 2004-12-01. Completion date: 2005-11-30.
$3,450 with Air Force for Automated Information System Design and Integration Services. Signed on 2005-08-31. Completion date: 2006-09-26.
HI-SERVE, INC (5073 HONEYSUCKLE BRANCH; small business)
$8,080 with Air Force for Maintenance, Repair or Alteration of Real Property -- Other Administrative Facilities and Service Buildings. Signed on 2001-08-28. Completion date: 2001-08-28.
BULVERDE HOME THEATER (1108 HILLSIDE OAKS; small business)
$7,380 with Army for Winches, Hoists, Cranes, and Derricks. Signed on 2002-09-25. Completion date: 2002-11-04.
Top industries in this zip code by the number of employees in 2005:
Other Services (except Public Administration): Religious Organizations (50-99 employees: 1 establishment, 10-19 employees: 2 establishments, 5-9 employees: 1 establishment, 1-4 employees: 6 establishments)
Educational Services: Elementary and Secondary Schools (50-99: 1)
Construction: New Single-Family Housing Construction (except Operative Builders) (10-19: 2, 5-9: 4, 1-4: 5)
Accommodation and Food Services: Limited-Service Restaurants (20-49: 1, 10-19: 2)
Construction: Commercial and Institutional Building Construction (20-49: 1, 10-19: 1, 1-4: 7)
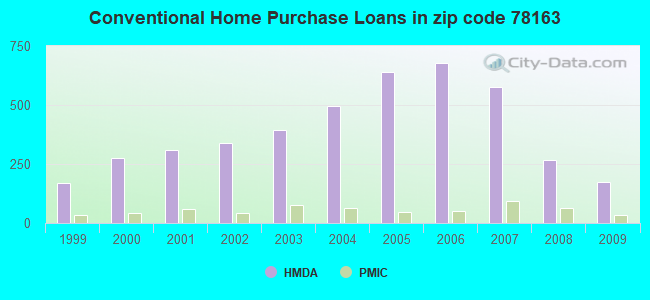
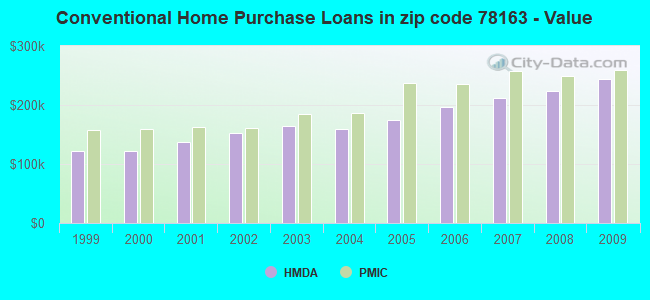
Detailed PMIC statistics for the following Tracts:3107.00
2002 - 2018 National Fire Incident Reporting System (NFIRS) incidents
Based on the data from the years 2002 - 2018 the average number of fire incidents per year is 55. The highest number of reported fires - 129 took place in 2007, and the least - 10 in 2002. The data has a growing trend.
When looking into fire subcategories, the most reports belonged to: Outside Fires (52.3%), and Structure Fires (33.3%).
Fire incident types reported to NFIRS in Zip Code 78163


 Nearest zip codes: 78260, 78261, 78070, 78258, 78259, 78266.
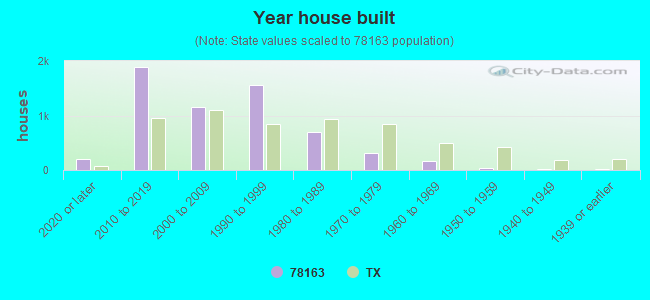


 Based on the data from the years 2002 - 2018 the average number of fire incidents per year is 55. The highest number of reported fires - 129 took place in 2007, and the least - 10 in 2002. The data has a growing trend.
 When looking into fire subcategories, the most reports belonged to: Outside Fires (52.3%), and Structure Fires (33.3%).