Estimated zip code population in 2022: 7,128 Zip code population in 2010: 5,205 Zip code population in 2000: 4,165
Houses and condos: 3,453 Renter-occupied apartments: 590
% of renters here:
21%
State:
38%
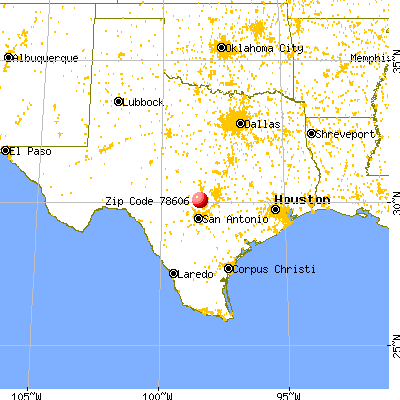
March 2022 cost of living index in zip code 78606: 80.2 (low, U.S. average is 100)
Land area: 244.6 sq. mi. Water area: 0.6 sq. mi.
Population density: 29 people per square mile
(very low).
OSM Map
General Map
Google Map
MSN Map
OSM Map
General Map
Google Map
MSN Map
OSM Map
General Map
Google Map
MSN Map
OSM Map
General Map
Google Map
MSN Map
Please wait while loading the map...
Real estate property taxes paid for housing units in 2022:
This zip code:
1.1% ($4,055)
Texas:
1.5% ($4,050)
Median real estate property taxes paid for housing units with mortgages in 2022: $5,452 (1.1%) Median real estate property taxes paid for housing units with no mortgage in 2022: $3,209 (1.2%)
Estimated median house/condo value in 2022: $377,460
78606:
$377,460
Texas:
$275,400
According to our research of Texas and other state lists, there were 12 registered sex offenders living in 78606 zip code as of May 28, 2024. The ratio of all residents to sex offenders in zip code 78606 is 463 to 1. The ratio of registered sex offenders to all residents in this zip code is near the state average.
Median resident age:
This zip code:
47.1 years
Texas median age:
35.6 years
Average household size:
This zip code:
2.5 people
Texas:
2.6 people
Averages for the 2020 tax year for zip code 78606, filed in 2021:
Average Adjusted Gross Income (AGI) in 2020: $87,953 (Individual Income Tax Returns)
Here:
$87,953
State:
$77,054
Salary/wage: $65,434 (reported on 71.8% of returns)
Here:
$65,434
State:
$62,766
(% of AGI for various income ranges: 1136.0% for AGIs below $25k, 3260.0% for AGIs $25k-50k, 5988.7% for AGIs $50k-75k, 8517.9% for AGIs $75k-100k, 16363.7% for AGIs $100k-200k, 59210.0% for AGIs over 200k)
Taxable interest for individuals: $2,559 (reported on 40.5% of returns)
This zip code:
$2,559
Texas:
$2,665
(% of AGI for various income ranges: 38.3% for AGIs below $25k, 51.7% for AGIs $25k-50k, 141.9% for AGIs $50k-75k, 255.3% for AGIs $75k-100k, 308.9% for AGIs $100k-200k, 1308.8% for AGIs over 200k)
Ordinary dividends: $10,854 (reported on 26.9% of returns)
Here:
$10,854
State:
$10,044
(% of AGI for various income ranges: 43.1% for AGIs below $25k, 89.6% for AGIs $25k-50k, 153.2% for AGIs $50k-75k, 338.4% for AGIs $75k-100k, 602.2% for AGIs $100k-200k, 7252.5% for AGIs over 200k)
Net capital gain/loss in AGI: +$32,891 (reported on 25.0% of returns)
Here:
+$32,891
State:
+$39,590
(% of AGI for various income ranges: 24.1% for AGIs below $25k, 90.6% for AGIs $25k-50k, 163.9% for AGIs $50k-75k, 332.6% for AGIs $75k-100k, 1446.3% for AGIs $100k-200k, 25455.0% for AGIs over 200k)
Profit/loss from business: +$14,482 (reported on 25.9% of returns)
Here:
+$14,482
State:
+$10,888
(% of AGI for various income ranges: 304.3% for AGIs below $25k, 354.0% for AGIs $25k-50k, 425.8% for AGIs $50k-75k, 617.4% for AGIs $75k-100k, 938.9% for AGIs $100k-200k, 4228.8% for AGIs over 200k)
Taxable individual retirement arrangement distribution: $27,264 (reported on 14.2% of returns)
78606:
$27,264
Texas:
$24,740
(% of AGI for various income ranges: 94.8% for AGIs below $25k, 154.2% for AGIs $25k-50k, 373.2% for AGIs $50k-75k, 683.2% for AGIs $75k-100k, 1640.0% for AGIs $100k-200k, 5120.0% for AGIs over 200k)
Total itemized deductions: $35,630 (reported on 9.5% of returns)
Here:
$35,630
State:
$40,428
(% of AGI for various income ranges: 95.5% for AGIs below $25k, 174.6% for AGIs $25k-50k, 281.3% for AGIs $50k-75k, 503.7% for AGIs $75k-100k, 1020.7% for AGIs $100k-200k, 5890.0% for AGIs over 200k)
Charity contributions: $11,446 (reported on 7.6% of returns)
Here:
$11,446
State:
$18,201
(% of AGI for various income ranges: 7.6% for AGIs below $25k, 89.4% for AGIs $50k-75k, 181.1% for AGIs $100k-200k, 2421.2% for AGIs over 200k)
Taxes paid: $7,520 (reported on 9.5% of returns)
78606:
$7,520
State:
$7,821
(% of AGI for various income ranges: 15.7% for AGIs below $25k, 23.3% for AGIs $25k-50k, 49.4% for AGIs $50k-75k, 94.7% for AGIs $75k-100k, 266.7% for AGIs $100k-200k, 1250.0% for AGIs over 200k)
Earned income credit: $2,195 (reported on 12.3% of returns)
Here:
$2,195
State:
$2,584
(% of AGI for various income ranges: 95.5% for AGIs below $25k, 62.9% for AGIs $25k-50k)
Percentage of individuals using paid preparers for their 2020 taxes: 89.9%
Here:
90%
State:
92%
(% for various income ranges: 88.0% for AGIs below $25k, 87.7% for AGIs $25k-50k, 91.5% for AGIs $50k-75k, 90.3% for AGIs $75k-100k, 92.7% for AGIs $100k-200k, 92.3% for AGIs over 200k)
Averages for the 2012 tax year for zip code 78606, filed in 2013:
Average Adjusted Gross Income (AGI) in 2012: $67,291 (Individual Income Tax Returns)
Here:
$67,291
State:
$65,384
Salary/wage: $47,162 (reported on 74.6% of returns)
Here:
$47,162
State:
$52,524
(% of AGI for various income ranges: 66.3% for AGIs below $25k, 72.7% for AGIs $25k-50k, 68.5% for AGIs $50k-75k, 62.0% for AGIs $75k-100k, 57.5% for AGIs $100k-200k, 30.2% for AGIs over 200k)
Taxable interest for individuals: $2,535 (reported on 37.1% of returns)
This zip code:
$2,535
Texas:
$2,372
(% of AGI for various income ranges: 2.7% for AGIs below $25k, 1.0% for AGIs $25k-50k, 0.9% for AGIs $50k-75k, 1.8% for AGIs $75k-100k, 1.1% for AGIs $100k-200k, 1.5% for AGIs over 200k)
Ordinary dividends: $7,685 (reported on 19.4% of returns)
Here:
$7,685
State:
$9,721
(% of AGI for various income ranges: 1.6% for AGIs below $25k, 0.9% for AGIs $25k-50k, 1.1% for AGIs $50k-75k, 2.1% for AGIs $75k-100k, 2.1% for AGIs $100k-200k, 3.3% for AGIs over 200k)
Net capital gain/loss in AGI: +$19,650 (reported on 17.7% of returns)
Here:
+$19,650
State:
+$35,319
(% of AGI for various income ranges: 0.1% for AGIs $25k-50k, 1.4% for AGIs $50k-75k, 2.6% for AGIs $75k-100k, 4.0% for AGIs $100k-200k, 10.9% for AGIs over 200k)
Profit/loss from business: +$14,223 (reported on 26.6% of returns)
Here:
+$14,223
State:
+$13,732
(% of AGI for various income ranges: 14.1% for AGIs below $25k, 5.7% for AGIs $25k-50k, 4.7% for AGIs $50k-75k, 5.8% for AGIs $75k-100k, 7.6% for AGIs $100k-200k, 2.9% for AGIs over 200k)
Taxable individual retirement arrangement distribution: $21,900 (reported on 11.7% of returns)
78606:
$21,900
Texas:
$19,511
(% of AGI for various income ranges: 4.7% for AGIs below $25k, 2.4% for AGIs $25k-50k, 1.9% for AGIs $50k-75k, 4.0% for AGIs $75k-100k, 5.3% for AGIs $100k-200k, 3.9% for AGIs over 200k)
Total itemized deductions: $24,685 (17% of AGI, reported on 26.2% of returns)
Here:
$24,685
State:
$24,724
Here:
16.6% of AGI
State:
15.9% of AGI
(% of AGI for various income ranges: 9.1% for AGIs below $25k, 7.9% for AGIs $25k-50k, 11.3% for AGIs $50k-75k, 10.9% for AGIs $75k-100k, 13.5% for AGIs $100k-200k, 7.0% for AGIs over 200k)
Charity contributions: $5,304 (reported on 19.8% of returns)
Here:
$5,304
State:
$6,808
(% of AGI for various income ranges: 0.6% for AGIs below $25k, 0.8% for AGIs $25k-50k, 1.1% for AGIs $50k-75k, 1.7% for AGIs $75k-100k, 1.8% for AGIs $100k-200k, 2.0% for AGIs over 200k)
Taxes paid: $6,783 (reported on 25.8% of returns)
78606:
$6,783
State:
$6,921
(% of AGI for various income ranges: 1.6% for AGIs below $25k, 1.7% for AGIs $25k-50k, 2.7% for AGIs $50k-75k, 2.9% for AGIs $75k-100k, 3.6% for AGIs $100k-200k, 2.3% for AGIs over 200k)
Earned income credit: $2,184 (reported on 17.7% of returns)
Here:
$2,184
State:
$2,570
(% of AGI for various income ranges: 6.0% for AGIs below $25k, 1.2% for AGIs $25k-50k)
Percentage of individuals using paid preparers for their 2012 taxes: 51.6%
Here:
52%
State:
51%
(% for various income ranges: 48.5% for AGIs below $25k, 50.0% for AGIs $25k-50k, 48.6% for AGIs $50k-75k, 52.2% for AGIs $75k-100k, 53.8% for AGIs $100k-200k, 90.9% for AGIs over 200k)
Averages for the 2004 tax year for zip code 78606, filed in 2005:
Average Adjusted Gross Income (AGI) in 2004: $43,825 (Individual Income Tax Returns)
Here:
$43,825
State:
$47,881
Salary/wage: $37,215 (reported on 75.3% of returns)
Here:
$37,215
State:
$41,947
(% of AGI for various income ranges: 398.6% for AGIs below $10k, 72.0% for AGIs $10k-25k, 75.7% for AGIs $25k-50k, 74.8% for AGIs $50k-75k, 69.1% for AGIs $75k-100k, 44.5% for AGIs over 100k)
Taxable interest for individuals: $3,167 (reported on 44.4% of returns)
This zip code:
$3,167
Texas:
$2,255
(% of AGI for various income ranges: 70.2% for AGIs below $10k, 3.3% for AGIs $10k-25k, 2.2% for AGIs $25k-50k, 2.3% for AGIs $50k-75k, 1.8% for AGIs $75k-100k, 3.6% for AGIs over 100k)
Taxable dividends: $2,526 (reported on 23.1% of returns)
Here:
$2,526
State:
$4,261
(% of AGI for various income ranges: 27.8% for AGIs below $10k, 0.9% for AGIs $10k-25k, 0.8% for AGIs $25k-50k, 0.8% for AGIs $50k-75k, 0.9% for AGIs $75k-100k, 1.7% for AGIs over 100k)
Net capital gain/loss: +$16,847 (reported on 20.7% of returns)
Here:
+$16,847
State:
+$16,110
(% of AGI for various income ranges: -8.7% for AGIs below $10k, -0.0% for AGIs $10k-25k, 1.2% for AGIs $25k-50k, 2.3% for AGIs $50k-75k, 3.2% for AGIs $75k-100k, 17.9% for AGIs over 100k)
Profit/loss from business: +$10,907 (reported on 26.9% of returns)
Here:
+$10,907
State:
+$11,013
(% of AGI for various income ranges: 11.0% for AGIs below $10k, 8.5% for AGIs $10k-25k, 5.0% for AGIs $25k-50k, 3.9% for AGIs $50k-75k, 6.6% for AGIs $75k-100k, 8.5% for AGIs over 100k)
IRA payment deduction: $3,174 (reported on 2.1% of returns)
78606:
$3,174
Texas:
$3,120
(% of AGI for various income ranges: 3.0% for AGIs below $10k, 0.2% for AGIs $25k-50k, 0.2% for AGIs $50k-75k, 0.2% for AGIs over 100k)
Self-employed pension: $11,692 (reported on 0.6% of returns)
Here:
$11,692
Texas:
$16,401
Total itemized deductions: $18,444 (21% of AGI, reported on 23.2% of returns)
Here:
$18,444
State:
$19,631
Here:
21.3% of AGI
State:
18.9% of AGI
(% of AGI for various income ranges: 62.5% for AGIs below $10k, 7.9% for AGIs $10k-25k, 9.3% for AGIs $25k-50k, 10.3% for AGIs $50k-75k, 11.3% for AGIs $75k-100k, 9.1% for AGIs over 100k)
Charity contributions deductions: $4,552 (5% of AGI, reported on 17.6% of returns)
Here:
$4,552
State:
$4,753
Here:
4.8% of AGI
State:
4.2% of AGI
(% of AGI for various income ranges: 3.2% for AGIs below $10k, 0.5% for AGIs $10k-25k, 1.0% for AGIs $25k-50k, 1.5% for AGIs $50k-75k, 1.9% for AGIs $75k-100k, 2.7% for AGIs over 100k)
Total tax: $7,547 (reported on 73.0% of returns)
78606:
$7,547
State:
$9,058
(% of AGI for various income ranges: 15.8% for AGIs below $10k, 4.4% for AGIs $10k-25k, 6.7% for AGIs $25k-50k, 9.0% for AGIs $50k-75k, 11.4% for AGIs $75k-100k, 19.7% for AGIs over 100k)
Earned income credit: $1,799 (reported on 18.8% of returns)
Here:
$1,799
State:
$2,024
Percentage of individuals using paid preparers for their 2004 taxes: 61.5%
Here:
62%
State:
57%
(% for various income ranges: 56.0% for AGIs below $10k, 61.9% for AGIs $10k-25k, 62.9% for AGIs $25k-50k, 60.1% for AGIs $50k-75k, 61.3% for AGIs $75k-100k, 76.0% for AGIs over 100k)
Likely homosexual households (counted as self-reported same-sex unmarried-partner households)
Lesbian couples: 0.4% of all households
Gay men: 0.0% of all households
Household received Food Stamps/SNAP in the past 12 months: 144 Household did not receive Food Stamps/SNAP in the past 12 months: 2,647
Women who had a birth in the past 12 months: 72 (73 now married, 0 unmarried) Women who did not have a birth in the past 12 months: 1,244 (736 now married, 502 unmarried)
Housing units in zip code 78606 with a mortgage: 1,178 (57 second mortgage, 58 both second mortgage and home equity loan) Houses without a mortgage: 25
Median monthly owner costs for units with a mortgage: $1,856 Median monthly owner costs for units without a mortgage: $653
Residents with income below the poverty level in 2022:
This zip code:
8.0%
Whole state:
14.0%
Residents with income below 50% of the poverty level in 2022:
This zip code:
5.2%
Whole state:
7.4%
Median number of rooms in houses and condos:
Here:
6.5
State:
6.3
Median number of rooms in apartments:
Here:
3.9
State:
4.0
Notable locations in this zip code not listed on our city pages
Notable locations in zip code 78606: Harvey Ranch (A), Blanco Historic District (B), Hereford Hills Ranch (C), Lindendale Community Hall (D), WE Four Ranch (E), Blanco Volunteer Fire Department (F), Blanco Volunteer Ambulance (G), Adrian Edwards Conn House (H). Display/hide their locations on the map
Cemeteries: Blanco Cemetery (1), Wegner Cemetery (2), Payton Cemetery (3), Givens-Bindseil Cemetery (4), McKinney Cemetery (5), Jonas Cemetery (6), Twin Sisters Cemetery (7). Display/hide their locations on the map
Reservoirs: Wayne Smith Lake (A), Soil Conservation Service Site 1 Reservoir (B), Blanco City Lake Number 1 (C), Tatum Lake (D). Display/hide their locations on the map
Streams, rivers, and creeks: Blasingame Creek (A), Rogers Branch (B), Meier Creek (C), McKinney Creek (D), Durham Branch (E), South Fork Blanco River (F), Rocky Creek (G), Falls Creek (H), Flat Creek (I). Display/hide their locations on the map
In group quarters: 33 (-1 institutionalized population)
Size of family households: 1,171 2-persons, 248 3-persons, 405 4-persons, 144 5-persons, 49 6-persons, 44 7-or-more-persons
Size of nonfamily households: 483 1-person, 258 2-persons
1,065 married couples with children.
175 single-parent households (43 men, 132 women).
91.2% of residents of 78606 zip code speak English at home.
8.2% of residents speak Spanish at home (66% very well, 14% well, 7% not well, 13% not at all).
0.6% of residents speak other Indo-European language at home (100% very well).
0.2% of residents speak Asian or Pacific Island language at home (50% very well, 50% well).
Foreign born population: 556 (7.8%) (37.2% of them are naturalized citizens)
This zip code:
7.8%
Whole state:
17.2%
80%Honduras
5%United Kingdom, excluding England and Scotland
5%Sweden
4%France
3%Guyana
2%Guatemala
22%German
16%English
8%American
4%Irish
2%Scotch-Irish
2%Scottish
2%French
Year of entry for the foreign-born population
252010 or later
2312000 to 2009
1701990 to 1999
223Before 1990
Housing units lacking complete plumbing facilities: 0.8% Housing units lacking complete kitchen facilities: 1.0%
82.4%Electricity
14.7%Bottled, tank, or LP gas
1.2%Wood
1.1%Utility gas
Population in 1990: 3,152. Population change in the 1990s: +1,013 (+32.1%).
Place of birth for U.S.-born residents:
This state: 4,675
Northeast: 219
Midwest: 604
South: 450
West: 464
55% of the 78606 zip code residents lived in the same house 5 years ago. Out of people who lived in different houses, 32% lived in this county. Out of people who lived in different counties, 50% lived in Texas.
92% of the 78606 zip code residents lived in the same house 1 year ago. Out of people who lived in different houses, 29% moved from this county. Out of people who lived in different houses, 50% moved from different county within same state. Out of people who lived in different houses, 25% moved from different state. Out of people who lived in different houses, 1% moved from abroad.
Private vs. public school enrollment:
Students in private schools in grades 1 to 8 (elementary and middle school): 132
Here:
14.9%
Texas:
8.8%
Students in private schools in grades 9 to 12 (high school): 46
Here:
14.8%
Texas:
8.0%
Students in private undergraduate colleges: 11
Here:
10.1%
Texas:
16.2%
Occupation by median earnings in the past 12 months ($)
188,892Computer and mathematical occupations
122,754Transportation occupations
95,124Business and financial operations occupations
91,753Architecture and engineering occupations
78,847Health diagnosing and treating practitioners and other technical occupations
62,248Production occupations
Companies with federal contracts located in this zip code:
WET PUBLISHING (520 RANGELAND RD in BLANCO, TX; small business) : $192,120 in 27 contractsfrom 2005 to 2006
Contracts for Aircraft Ground Servicing Equipment, Airframe Structural Components, Hardware, Commercial by Defense Logistics Agency Signed by year:2000: $0; 2001: $0; 2002: $0; 2003: $0; 2004: $0; 2005: $120,591; 2006: $71,529.
Biggest contracts:
$25,000 with Defense Logistics Agency for Aircraft Ground Servicing Equipment. Signed on 2005-05-27. Completion date: 2005-11-23.
$25,000, same as above.Signed on 2005-05-24. Completion date: 2005-11-23.
$21,850 with Defense Logistics Agency for Airframe Structural Components. Signed on 2006-04-25. Completion date: 2007-02-22.
$14,400, same as above.Signed on 2006-03-03. Completion date: 2006-10-29.
MIDDLE CREEK CONSTRUCTION, INC (4693 MIDDLE CREEK RD in BLANCO, TX; small business) : $59,962 in 10 contractsfrom 2004 to 2005
Contracts for Aircraft Landing Gear Components, Airframe Structural Components by Air Force, Defense Logistics Agency Signed by year:2000: $0; 2001: $0; 2002: $0; 2003: $0; 2004: $224,061; 2005: -$164,099; 2006: $0.
Biggest contracts:
$195,155 with Air Force for Aircraft Landing Gear Components. Signed on 2004-11-23. Completion date: 2005-12-31.
$18,500 with Defense Logistics Agency for Airframe Structural Components. Signed on 2005-02-10. Completion date: 2005-11-28.
$12,500, same as above.Signed on 2004-11-26. Completion date: 2005-11-08.
$8,512, same as above.Signed on 2004-11-26. Completion date: 2005-11-07.
PHOTOGRAPHIC TECHNICAL SERVICE (595 N BRASS TOWN DR in BLANCO, TX; small business) : $12,000 in 2 contractsfrom 2004 to 2005
$6,000 with Army for Maintenance, Repair and Rebuilding of Equipment -- Office Machines, Text Processing Systems and Visible Record Equipment. Signed on 2004-12-14. Completion date: 2005-09-30.
$6,000 with Army for Adhesives. Signed on 2005-08-17. Completion date: 2006-09-30.
Top industries in this zip code by the number of employees in 2005:
Construction: Highway, Street, and Bridge Construction (50-99 employees: 1 establishment, 10-19 employees: 2 establishments, 5-9 employees: 1 establishment)
Construction: Site Preparation Contractors (20-49: 1, 1-4: 1)
Accommodation and Food Services: Limited-Service Restaurants (20-49: 1, 1-4: 1)
Other Services (except Public Administration): Religious Organizations (10-19: 1, 5-9: 1, 1-4: 4)
People in group quarters in 2010:
48 people in nursing facilities/skilled-nursing facilities
People in group quarters in 2000:
86 people in nursing homes
12 people in college dormitories (includes college quarters off campus)
Fatal accident statistics in 2014:
Fatal accident count: 3
Vehicles involved in fatal accidents: 5
Fatal accidents caused by drunken drivers: 3
Fatalities: 4
Persons involved in fatal accidents: 8
Pedestrians involved in fatal accidents: 0
Fatal accident statistics in 2013:
Fatal accident count: 2
Vehicles involved in fatal accidents: 2
Fatal accidents caused by drunken drivers: 2
Fatalities: 2
Persons involved in fatal accidents: 2
Pedestrians involved in fatal accidents: 0
2004 - 2018 National Fire Incident Reporting System (NFIRS) incidents
According to the data from the years 2004 - 2018 the average number of fires per year is 57. The highest number of fire incidents - 95 took place in 2017, and the least - 5 in 2004. The data has an increasing trend.
When looking into fire subcategories, the most incidents belonged to: Outside Fires (73.2%), and Structure Fires (15.6%).
Fire incident types reported to NFIRS in Zip Code 78606


 Nearest zip codes: 78027, 78635, 78004, 78671, 78070, 78636.


 : $192,120 in 27 contracts from 2005 to 2006


 According to the data from the years 2004 - 2018 the average number of fires per year is 57. The highest number of fire incidents - 95 took place in 2017, and the least - 5 in 2004. The data has an increasing trend.
 When looking into fire subcategories, the most incidents belonged to: Outside Fires (73.2%), and Structure Fires (15.6%).