Estimated zip code population in 2022: 19,027 Zip code population in 2010: 14,618 Zip code population in 2000: 7,283
Houses and condos: 8,125 Renter-occupied apartments: 619
% of renters here:
8%
State:
38%
March 2022 cost of living index in zip code 78070: 82.6 (low, U.S. average is 100)
Land area: 137.7 sq. mi. Water area: 1.4 sq. mi.
Population density: 138 people per square mile
(very low).
OSM Map
General Map
Google Map
MSN Map
OSM Map
General Map
Google Map
MSN Map
OSM Map
General Map
Google Map
MSN Map
OSM Map
General Map
Google Map
MSN Map
Please wait while loading the map...
Real estate property taxes paid for housing units in 2022:
This zip code:
1.1% ($5,254)
Texas:
1.5% ($4,050)
Median real estate property taxes paid for housing units with mortgages in 2022: $6,508 (1.1%) Median real estate property taxes paid for housing units with no mortgage in 2022: $4,388 (1.3%)
Estimated median house/condo value in 2022: $500,349
78070:
$500,349
Texas:
$275,400
According to our research of Texas and other state lists, there were 36 registered sex offenders living in 78070 zip code as of May 28, 2024. The ratio of all residents to sex offenders in zip code 78070 is 432 to 1. The ratio of registered sex offenders to all residents in this zip code is near the state average.
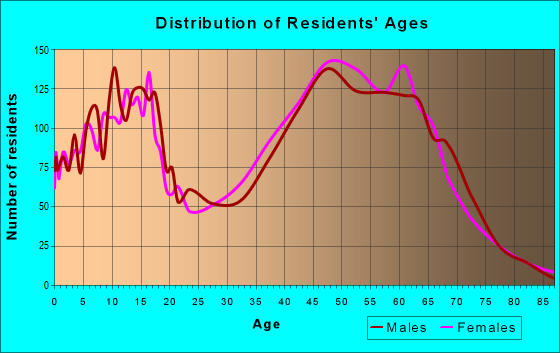
Median resident age:
This zip code:
48.4 years
Texas median age:
35.6 years
Average household size:
This zip code:
2.5 people
Texas:
2.6 people
Averages for the 2020 tax year for zip code 78070, filed in 2021:
Average Adjusted Gross Income (AGI) in 2020: $104,566 (Individual Income Tax Returns)
Here:
$104,566
State:
$77,054
Salary/wage: $81,107 (reported on 74.7% of returns)
Here:
$81,107
State:
$62,766
(% of AGI for various income ranges: 1087.9% for AGIs below $25k, 3322.6% for AGIs $25k-50k, 5912.7% for AGIs $50k-75k, 8273.5% for AGIs $75k-100k, 16793.5% for AGIs $100k-200k, 62285.2% for AGIs over 200k)
Taxable interest for individuals: $2,015 (reported on 41.5% of returns)
This zip code:
$2,015
Texas:
$2,665
(% of AGI for various income ranges: 18.5% for AGIs below $25k, 44.5% for AGIs $25k-50k, 72.9% for AGIs $50k-75k, 103.2% for AGIs $75k-100k, 168.6% for AGIs $100k-200k, 1080.0% for AGIs over 200k)
Ordinary dividends: $4,268 (reported on 50.9% of returns)
Here:
$4,268
State:
$10,044
(% of AGI for various income ranges: 36.5% for AGIs below $25k, 54.7% for AGIs $25k-50k, 202.4% for AGIs $50k-75k, 295.0% for AGIs $75k-100k, 422.3% for AGIs $100k-200k, 3048.0% for AGIs over 200k)
Net capital gain/loss in AGI: +$30,049 (reported on 25.2% of returns)
Here:
+$30,049
State:
+$39,590
(% of AGI for various income ranges: 18.8% for AGIs below $25k, 63.7% for AGIs $25k-50k, 167.0% for AGIs $50k-75k, 224.8% for AGIs $75k-100k, 776.5% for AGIs $100k-200k, 16118.2% for AGIs over 200k)
Profit/loss from business: +$16,463 (reported on 23.2% of returns)
Here:
+$16,463
State:
+$10,888
(% of AGI for various income ranges: 210.9% for AGIs below $25k, 262.9% for AGIs $25k-50k, 366.2% for AGIs $50k-75k, 435.3% for AGIs $75k-100k, 642.8% for AGIs $100k-200k, 4489.0% for AGIs over 200k)
Taxable individual retirement arrangement distribution: $35,716 (reported on 13.2% of returns)
78070:
$35,716
Texas:
$24,740
(% of AGI for various income ranges: 47.4% for AGIs below $25k, 133.4% for AGIs $25k-50k, 377.0% for AGIs $50k-75k, 659.8% for AGIs $75k-100k, 1531.4% for AGIs $100k-200k, 4899.5% for AGIs over 200k)
Self-employed (Keogh) retirement plans: $30,467 (reported on 0.6% of returns)
78070:
$30,467
Texas:
$29,298
(% of AGI for various income ranges: 35.0% for AGIs $50k-75k, 383.5% for AGIs over 200k)
Total itemized deductions: $36,769 (reported on 13.7% of returns)
Here:
$36,769
State:
$40,428
(% of AGI for various income ranges: 75.0% for AGIs below $25k, 152.6% for AGIs $25k-50k, 396.4% for AGIs $50k-75k, 676.6% for AGIs $75k-100k, 1249.3% for AGIs $100k-200k, 6326.2% for AGIs over 200k)
Charity contributions: $12,317 (reported on 11.2% of returns)
Here:
$12,317
State:
$18,201
(% of AGI for various income ranges: 4.3% for AGIs below $25k, 23.4% for AGIs $25k-50k, 51.2% for AGIs $50k-75k, 101.1% for AGIs $75k-100k, 262.5% for AGIs $100k-200k, 2363.0% for AGIs over 200k)
Taxes paid: $8,191 (reported on 13.5% of returns)
78070:
$8,191
State:
$7,821
(% of AGI for various income ranges: 10.4% for AGIs below $25k, 26.3% for AGIs $25k-50k, 89.4% for AGIs $50k-75k, 168.5% for AGIs $75k-100k, 308.5% for AGIs $100k-200k, 1301.5% for AGIs over 200k)
Earned income credit: $2,243 (reported on 10.7% of returns)
Here:
$2,243
State:
$2,584
(% of AGI for various income ranges: 83.5% for AGIs below $25k, 62.9% for AGIs $25k-50k)
Percentage of individuals using paid preparers for their 2020 taxes: 90.8%
Here:
91%
State:
92%
(% for various income ranges: 88.4% for AGIs below $25k, 90.4% for AGIs $25k-50k, 91.2% for AGIs $50k-75k, 91.9% for AGIs $75k-100k, 92.2% for AGIs $100k-200k, 92.7% for AGIs over 200k)
Averages for the 2012 tax year for zip code 78070, filed in 2013:
Average Adjusted Gross Income (AGI) in 2012: $88,804 (Individual Income Tax Returns)
Here:
$88,804
State:
$65,384
Salary/wage: $70,709 (reported on 78.8% of returns)
Here:
$70,709
State:
$52,524
(% of AGI for various income ranges: 69.0% for AGIs below $25k, 70.0% for AGIs $25k-50k, 66.7% for AGIs $50k-75k, 65.8% for AGIs $75k-100k, 71.2% for AGIs $100k-200k, 52.7% for AGIs over 200k)
Taxable interest for individuals: $2,036 (reported on 41.9% of returns)
This zip code:
$2,036
Texas:
$2,372
(% of AGI for various income ranges: 1.3% for AGIs below $25k, 1.0% for AGIs $25k-50k, 1.1% for AGIs $50k-75k, 0.7% for AGIs $75k-100k, 0.7% for AGIs $100k-200k, 1.2% for AGIs over 200k)
Ordinary dividends: $6,173 (reported on 24.3% of returns)
Here:
$6,173
State:
$9,721
(% of AGI for various income ranges: 1.9% for AGIs below $25k, 1.5% for AGIs $25k-50k, 1.3% for AGIs $50k-75k, 1.6% for AGIs $75k-100k, 1.0% for AGIs $100k-200k, 2.3% for AGIs over 200k)
Net capital gain/loss in AGI: +$26,547 (reported on 21.6% of returns)
Here:
+$26,547
State:
+$35,319
(% of AGI for various income ranges: 0.3% for AGIs below $25k, 0.5% for AGIs $25k-50k, 0.5% for AGIs $50k-75k, 0.8% for AGIs $75k-100k, 1.5% for AGIs $100k-200k, 14.9% for AGIs over 200k)
Profit/loss from business: +$19,172 (reported on 23.0% of returns)
Here:
+$19,172
State:
+$13,732
(% of AGI for various income ranges: 13.2% for AGIs below $25k, 5.0% for AGIs $25k-50k, 5.3% for AGIs $50k-75k, 3.8% for AGIs $75k-100k, 4.5% for AGIs $100k-200k, 4.7% for AGIs over 200k)
Taxable individual retirement arrangement distribution: $25,239 (reported on 12.4% of returns)
78070:
$25,239
Texas:
$19,511
(% of AGI for various income ranges: 2.6% for AGIs below $25k, 3.5% for AGIs $25k-50k, 3.6% for AGIs $50k-75k, 5.0% for AGIs $75k-100k, 4.3% for AGIs $100k-200k, 2.6% for AGIs over 200k)
Self-employment retirement plans: $17,843 (reported on 1.0% of returns)
78070:
$17,843
Texas:
$23,938
Total itemized deductions: $26,212 (17% of AGI, reported on 41.2% of returns)
Here:
$26,212
State:
$24,724
Here:
16.9% of AGI
State:
15.9% of AGI
(% of AGI for various income ranges: 12.8% for AGIs below $25k, 12.0% for AGIs $25k-50k, 16.4% for AGIs $50k-75k, 13.9% for AGIs $75k-100k, 14.7% for AGIs $100k-200k, 8.7% for AGIs over 200k)
Charity contributions: $4,953 (reported on 33.5% of returns)
Here:
$4,953
State:
$6,808
(% of AGI for various income ranges: 0.7% for AGIs below $25k, 1.1% for AGIs $25k-50k, 1.6% for AGIs $50k-75k, 1.8% for AGIs $75k-100k, 2.2% for AGIs $100k-200k, 2.0% for AGIs over 200k)
Taxes paid: $7,476 (reported on 41.1% of returns)
78070:
$7,476
State:
$6,921
(% of AGI for various income ranges: 2.9% for AGIs below $25k, 2.9% for AGIs $25k-50k, 4.5% for AGIs $50k-75k, 3.6% for AGIs $75k-100k, 4.4% for AGIs $100k-200k, 2.6% for AGIs over 200k)
Earned income credit: $2,167 (reported on 11.6% of returns)
Here:
$2,167
State:
$2,570
(% of AGI for various income ranges: 5.4% for AGIs below $25k, 1.0% for AGIs $25k-50k)
Percentage of individuals using paid preparers for their 2012 taxes: 44.7%
Here:
45%
State:
51%
(% for various income ranges: 36.9% for AGIs below $25k, 40.7% for AGIs $25k-50k, 46.2% for AGIs $50k-75k, 44.7% for AGIs $75k-100k, 49.6% for AGIs $100k-200k, 69.0% for AGIs over 200k)
Averages for the 2004 tax year for zip code 78070, filed in 2005:
Average Adjusted Gross Income (AGI) in 2004: $62,153 (Individual Income Tax Returns)
Here:
$62,153
State:
$47,881
Salary/wage: $55,544 (reported on 83.3% of returns)
Here:
$55,544
State:
$41,947
(% of AGI for various income ranges: 206.2% for AGIs below $10k, 74.1% for AGIs $10k-25k, 75.9% for AGIs $25k-50k, 77.4% for AGIs $50k-75k, 78.8% for AGIs $75k-100k, 70.6% for AGIs over 100k)
Taxable interest for individuals: $2,340 (reported on 48.7% of returns)
This zip code:
$2,340
Texas:
$2,255
(% of AGI for various income ranges: 14.5% for AGIs below $10k, 1.6% for AGIs $10k-25k, 1.6% for AGIs $25k-50k, 1.2% for AGIs $50k-75k, 1.0% for AGIs $75k-100k, 2.2% for AGIs over 100k)
Taxable dividends: $2,811 (reported on 27.0% of returns)
Here:
$2,811
State:
$4,261
(% of AGI for various income ranges: 6.5% for AGIs below $10k, 1.2% for AGIs $10k-25k, 1.0% for AGIs $25k-50k, 0.5% for AGIs $50k-75k, 0.9% for AGIs $75k-100k, 1.5% for AGIs over 100k)
Net capital gain/loss: +$9,830 (reported on 23.0% of returns)
Here:
+$9,830
State:
+$16,110
(% of AGI for various income ranges: -1.2% for AGIs below $10k, -0.2% for AGIs $10k-25k, 0.7% for AGIs $25k-50k, 1.3% for AGIs $50k-75k, 1.7% for AGIs $75k-100k, 5.9% for AGIs over 100k)
Profit/loss from business: +$13,675 (reported on 21.6% of returns)
Here:
+$13,675
State:
+$11,013
(% of AGI for various income ranges: -28.3% for AGIs below $10k, 8.5% for AGIs $10k-25k, 4.7% for AGIs $25k-50k, 4.6% for AGIs $50k-75k, 3.8% for AGIs $75k-100k, 5.1% for AGIs over 100k)
IRA payment deduction: $3,061 (reported on 3.7% of returns)
78070:
$3,061
Texas:
$3,120
(% of AGI for various income ranges: 0.2% for AGIs $10k-25k, 0.3% for AGIs $25k-50k, 0.2% for AGIs $50k-75k, 0.3% for AGIs $75k-100k, 0.1% for AGIs over 100k)
Self-employed pension: $12,463 (reported on 0.8% of returns)
Here:
$12,463
Texas:
$16,401
Total itemized deductions: $21,235 (20% of AGI, reported on 40.2% of returns)
Here:
$21,235
State:
$19,631
Here:
19.9% of AGI
State:
18.9% of AGI
(% of AGI for various income ranges: 33.8% for AGIs below $10k, 12.4% for AGIs $10k-25k, 12.6% for AGIs $25k-50k, 13.5% for AGIs $50k-75k, 16.4% for AGIs $75k-100k, 13.2% for AGIs over 100k)
Charity contributions deductions: $3,799 (3% of AGI, reported on 34.7% of returns)
Here:
$3,799
State:
$4,753
Here:
3.4% of AGI
State:
4.2% of AGI
(% of AGI for various income ranges: 1.7% for AGIs below $10k, 0.9% for AGIs $10k-25k, 1.2% for AGIs $25k-50k, 1.5% for AGIs $50k-75k, 2.3% for AGIs $75k-100k, 2.6% for AGIs over 100k)
Total tax: $10,610 (reported on 79.9% of returns)
78070:
$10,610
State:
$9,058
(% of AGI for various income ranges: 7.4% for AGIs below $10k, 4.8% for AGIs $10k-25k, 6.7% for AGIs $25k-50k, 8.6% for AGIs $50k-75k, 10.3% for AGIs $75k-100k, 18.3% for AGIs over 100k)
Earned income credit: $1,801 (reported on 11.4% of returns)
Here:
$1,801
State:
$2,024
Percentage of individuals using paid preparers for their 2004 taxes: 48.0%
Here:
48%
State:
57%
(% for various income ranges: 39.5% for AGIs below $10k, 47.6% for AGIs $10k-25k, 47.7% for AGIs $25k-50k, 46.8% for AGIs $50k-75k, 50.2% for AGIs $75k-100k, 57.3% for AGIs over 100k)
Likely homosexual households (counted as self-reported same-sex unmarried-partner households)
Lesbian couples: 0.1% of all households
Gay men: 0.4% of all households
Household received Food Stamps/SNAP in the past 12 months: 410 Household did not receive Food Stamps/SNAP in the past 12 months: 7,042
Women who had a birth in the past 12 months: 231 (151 now married, 79 unmarried) Women who did not have a birth in the past 12 months: 3,501 (1,986 now married, 1,500 unmarried)
Housing units in zip code 78070 with a mortgage: 4,186 (208 second mortgage, 180 both second mortgage and home equity loan) Houses without a mortgage: 49
Median monthly owner costs for units with a mortgage: $2,461 Median monthly owner costs for units without a mortgage: $620
Residents with income below the poverty level in 2022:
This zip code:
7.4%
Whole state:
14.0%
Residents with income below 50% of the poverty level in 2022:
This zip code:
2.1%
Whole state:
7.4%
Median number of rooms in houses and condos:
Here:
7.0
State:
6.3
Median number of rooms in apartments:
Here:
3.4
State:
4.0
Notable locations in this zip code not listed on our city pages
Notable locations in zip code 78070: Spring Branch Volunteer Fire Department Station 2 (A), Spring Branch Volunteer Fire Department Central Station (B), Bulverde - Spring Branch Emergency Medical Service (C). Display/hide their locations on the map
Cemeteries: Beierle Cemetery (1), Weidner Cemetery (2), Wehe Cemetery (3), Bremer Cemetery (4), Rust Cemetery (5), Letsch Cemetery (6), Krause Cemetery (7). Display/hide their locations on the map
Streams, rivers, and creeks: Ahern Creek (A), Schuetz Creek (B), Spring Branch (C), Simmons Creek (D), Schultz Creek (E), Puter Creek (F), Swine Creek (G), Cypress Creek (H), Curry Creek (I). Display/hide their locations on the map
In group quarters: 30 (-1 institutionalized population)
Size of family households: 3,412 2-persons, 991 3-persons, 998 4-persons, 446 5-persons, 128 6-persons, 57 7-or-more-persons
Size of nonfamily households: 1,152 1-person, 281 2-persons
3,524 married couples with children.
245 single-parent households (245 women).
87.0% of residents of 78070 zip code speak English at home.
11.9% of residents speak Spanish at home (78% very well, 10% well, 9% not well, 3% not at all).
1.0% of residents speak other Indo-European language at home (92% very well, 8% well).
0.1% of residents speak Asian or Pacific Island language at home (92% very well, 8% well).
Foreign born population: 1,302 (6.8%) (62.7% of them are naturalized citizens)
This zip code:
6.8%
Whole state:
17.2%
42%Honduras
11%Belgium
8%Grenada
5%Eritrea
4%Costa Rica
4%France
3%Sweden
16%English
14%German
13%American
4%Irish
3%Italian
2%French
2%Polish
Year of entry for the foreign-born population
3422010 or later
5742000 to 2009
2231990 to 1999
445Before 1990
Facilities with environmental interests located in this zip code:
ARLON R SEAY INT (20911 HWY 46 W in SPRING BRANCH, TX)
(National Center for Education Statistics) - STATE ID-046902110 Organizations: COMAL ISD (SCHOOL DISTRICT)
Housing units lacking complete plumbing facilities: 1.4% Housing units lacking complete kitchen facilities: 1.7%
75.1%Electricity
18.4%Bottled, tank, or LP gas
4.5%Utility gas
1.1%Wood
0.7%Other fuel
Population in 1990: 1,544. Population change in the 1990s: +5,739 (+371.7%).
Place of birth for U.S.-born residents:
This state: 10,560
Northeast: 837
Midwest: 1,810
South: 2,152
West: 2,094
47% of the 78070 zip code residents lived in the same house 5 years ago. Out of people who lived in different houses, 18% lived in this county. Out of people who lived in different counties, 50% lived in Texas.
91% of the 78070 zip code residents lived in the same house 1 year ago. Out of people who lived in different houses, 8% moved from this county. Out of people who lived in different houses, 52% moved from different county within same state. Out of people who lived in different houses, 49% moved from different state.
Private vs. public school enrollment:
Students in private schools in grades 1 to 8 (elementary and middle school): 194
Here:
10.8%
Texas:
8.8%
Students in private schools in grades 9 to 12 (high school): 213
Here:
17.5%
Texas:
8.0%
Students in private undergraduate colleges: 62
Here:
15.2%
Texas:
16.2%
Occupation by median earnings in the past 12 months ($)
141,981Health technologists and technicians
118,114Architecture and engineering occupations
115,705Computer and mathematical occupations
111,823Law enforcement workers including supervisors
98,276Business and financial operations occupations
84,100Health diagnosing and treating practitioners and other technical occupations
Companies with federal contracts located in this zip code (SPRING BRANCH, TX):
GREENTEK UNLIMITED CONCEPTS, I (238 FARHILLS DR; small business) : $602,144 in 7 contractsfrom 1999 to 2004
Contracts for Other ADP and Telecommunications Services (includes data storage on tapes, compact disks, etc.) by Army Signed by year:2000: $370,114; 2001: $0; 2002: $97,346; 2003: $99,299; 2004: -$54,615; 2005: $0; 2006: $0.
Biggest contracts:
$370,114 with Army for Other ADP and Telecommunications Services (includes data storage on tapes, compact disks, etc.). Signed on 2000-12-14. Completion date: 2005-09-30.
$99,299, same as above.Signed on 2003-11-03. Completion date: 2003-09-30.
$97,346, same as above.Signed on 2002-11-06. Completion date: 2003-09-30.
$90,000, same as above.Signed on 1999-10-18. Completion date: 2000-09-30.
WEINBERG, THOMAS J (1281 CHERRY CREEK BLVD; small business) : $214,056 in 2 contractsin 2005
$214,056 with Army for Gynecology Services. Signed on 2005-10-05. Completion date: 2006-09-30.
$0, same as above.Signed on 2005-10-05. Completion date: 2006-09-30.
WINDY AIR, INC (105 KENDALIA CIR; small business) : $184,016 in 5 contractsfrom 2001 to 2005
Contracts for Sets, Kits, and Outfits of Hand Tools, Hose, Pipe, Tube, Lubrication, and Railing Fittings, Packing and Gasket Materials, Fuzing and Firing Devices, Nuclear Ordnance by Army, Navy, Air Force Signed by year:2000: $0; 2001: $37,408; 2002: $66,679; 2003: $0; 2004: $90,443; 2005: -$10,514; 2006: $0.
Biggest contracts:
$90,443 with Army for Sets, Kits, and Outfits of Hand Tools. Signed on 2004-07-01. Completion date: 2004-08-13.
$66,679 with Navy for Hose, Pipe, Tube, Lubrication, and Railing Fittings. Signed on 2002-12-11. Completion date: 2003-01-07.
$37,408, same as above.Signed on 2001-11-19. Completion date: 2001-12-26.
$4,870 with Navy for Packing and Gasket Materials. Signed on 2005-05-09. Completion date: 2005-05-25.
BENTON, RON (27152 TRITON DR; small business) : $102,212 in 4 contractsfrom 2004 to 2006
$49,796 with Army for Recreational Services. Taking place in KY. Signed on 2004-11-09. Completion date: 2005-11-21.
$48,760 with Army for Recreational Services. Signed on 2005-11-18. Completion date: 2006-11-22.
$3,656 with Army for Recreational Services. Taking place in KY. Signed on 2006-02-15. Completion date: 2005-11-21.
$0, same as above.Signed on 2006-02-15. Completion date: 2005-11-21.
PORTAMIX CO (6248 YORKSHIRE DR; small business) : $28,198 in 2 contractsfrom 2003 to 2006
$23,400 with Army for Miscellaneous Construction Equipment. Signed on 2006-05-11. Completion date: 2006-06-02.
$4,798 with Army for Clay and Concrete Products Industries Machinery. Taking place in VA. Signed on 2003-09-25. Completion date: 2003-10-31.
SPRING BRANCH WATERWELL SERVIC (8567 US HWY 281 NORTH; small business) : $21,503 in 2 contractsfrom 2003 to 2004
$13,469 with Army for Power and Hand Pumps. Signed on 2004-08-04. Completion date: 2004-08-05.
$8,034 with Army for Maintenance, Repair or Alteration of Real Property -- Restoration of real property. Signed on 2003-08-01. Completion date: 2003-08-29.
JERALD BOYCE (179 WHITETAIL RUN; small business) : $14,631 in 4 contractsfrom 2003 to 2004
$8,058 with Army for Miscellaneous Service and Trade Equipment. Signed on 2004-03-18. Completion date: 2004-02-27.
$8,058 with U.S. Army Corps of Engineers - civil program financing only for Miscellaneous Service and Trade Equipment. Signed on 2004-03-18. Completion date: 2004-02-27.
$0 with Army for Landscaping/Groundskeeping Services. Signed on 2003-12-18. Completion date: 2004-09-30.
-$1,485, same as above.Signed on 2003-12-18. Completion date: 2004-09-30.
WORLDWIDE CANINE INC (185 MITCHELL DR; small business)
$9,000 with Air Force for Modification of Equipment -- Live Animals. Signed on 2005-04-27. Completion date: 2005-04-30.
AMERICAN AVIATION SUPPORT GROU (8603 HWY 281N, #104; small business) : $0 in 2 contractsin 2003
$30,000 with Air Force for Refrigeration and Air Conditioning Components. Signed on 2003-04-02. Completion date: 2003-04-30.
-$30,000, same as above.Signed on 2003-08-06. Completion date: 2003-08-06.
Top industries in this zip code by the number of employees in 2005:
Detailed PMIC statistics for the following Tracts:3106.01
, 3107.00
2002 - 2018 National Fire Incident Reporting System (NFIRS) incidents
According to the data from the years 2002 - 2018 the average number of fire incidents per year is 93. The highest number of reported fire incidents - 144 took place in 2005, and the least - 35 in 2016. The data has an increasing trend.
When looking into fire subcategories, the most incidents belonged to: Outside Fires (66.8%), and Structure Fires (20.5%).
Fire incident types reported to NFIRS in Zip Code 78070
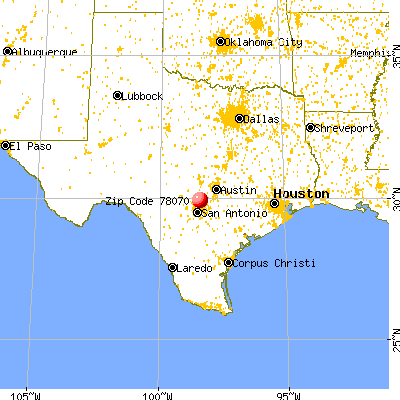


 Nearest zip codes: 78163, 78133, 78004, 78027, 78623, 78261.


 According to the data from the years 2002 - 2018 the average number of fire incidents per year is 93. The highest number of reported fire incidents - 144 took place in 2005, and the least - 35 in 2016. The data has an increasing trend.
 When looking into fire subcategories, the most incidents belonged to: Outside Fires (66.8%), and Structure Fires (20.5%).