Averages for the 2020 tax year for zip code 78632, filed in 2021:
Average Adjusted Gross Income (AGI) in 2020: $59,663 (Individual Income Tax Returns)
Here:
$59,663
State:
$77,054
Salary/wage: $51,656 (reported on 78.3% of returns)
Here:
$51,656
State:
$62,766
(% of AGI for various income ranges: 1092.2% for AGIs below $25k, 4271.1% for AGIs $25k-50k, 6412.0% for AGIs $50k-75k, 7813.3% for AGIs $75k-100k, 16438.0% for AGIs $100k-200k)
Taxable interest for individuals: $750 (reported on 34.8% of returns)
This zip code:
$750
Texas:
$2,665
(% of AGI for various income ranges: 8.9% for AGIs below $25k, 10.0% for AGIs $25k-50k, 32.0% for AGIs $50k-75k, 174.0% for AGIs $100k-200k)
Ordinary dividends: $1,385 (reported on 28.3% of returns)
Here:
$1,385
State:
$10,044
(% of AGI for various income ranges: 53.3% for AGIs below $25k, 20.0% for AGIs $25k-50k, 58.0% for AGIs $50k-75k, 170.0% for AGIs $100k-200k)
Net capital gain/loss in AGI: +$5,267 (reported on 13.0% of returns)
Here:
+$5,267
State:
+$39,590
(% of AGI for various income ranges: 60.0% for AGIs $25k-50k, 524.0% for AGIs $100k-200k)
Profit/loss from business: +$6,017 (reported on 13.0% of returns)
Here:
+$6,017
State:
+$10,888
(% of AGI for various income ranges: 157.8% for AGIs $25k-50k, 438.0% for AGIs $100k-200k)
Taxable individual retirement arrangement distribution: $18,367 (reported on 6.5% of returns)
78632:
$18,367
Texas:
$24,740
(% of AGI for various income ranges: 1102.0% for AGIs $50k-75k)
Earned income credit: $2,820 (reported on 10.9% of returns)
Here:
$2,820
State:
$2,584
(% of AGI for various income ranges: 54.4% for AGIs below $25k, 102.2% for AGIs $25k-50k)
Percentage of individuals using paid preparers for their 2020 taxes: 91.3%
Here:
91%
State:
92%
(% for various income ranges: 92.3% for AGIs below $25k, 92.3% for AGIs $25k-50k, 100.0% for AGIs $50k-75k, 75.0% for AGIs $75k-100k, 88.9% for AGIs $100k-200k)
Averages for the 2012 tax year for zip code 78632, filed in 2013:
Average Adjusted Gross Income (AGI) in 2012: $51,017 (Individual Income Tax Returns)
Here:
$51,017
State:
$65,384
Salary/wage: $45,239 (reported on 80.5% of returns)
Here:
$45,239
State:
$52,524
(% of AGI for various income ranges: 66.9% for AGIs below $25k, 75.5% for AGIs $25k-50k, 75.0% for AGIs $50k-75k, 79.6% for AGIs $75k-100k, 65.6% for AGIs $100k-200k)
Taxable interest for individuals: $807 (reported on 34.1% of returns)
This zip code:
$807
Texas:
$2,372
(% of AGI for various income ranges: 0.7% for AGIs below $25k, 0.5% for AGIs $25k-50k, 1.5% for AGIs $50k-75k, 0.2% for AGIs $100k-200k)
Ordinary dividends: $2,800 (reported on 12.2% of returns)
Here:
$2,800
State:
$9,721
Net capital gain/loss in AGI: +$7,267 (reported on 14.6% of returns)
Here:
+$7,267
State:
+$35,319
Profit/loss from business: +$5,129 (reported on 17.1% of returns)
Here:
+$5,129
State:
+$13,732
Taxable individual retirement arrangement distribution: $8,750 (reported on 9.8% of returns)
78632:
$8,750
Texas:
$19,511
Total itemized deductions: $18,925 (22% of AGI, reported on 19.5% of returns)
Here:
$18,925
State:
$24,724
Here:
22.4% of AGI
State:
15.9% of AGI
(% of AGI for various income ranges: 26.4% for AGIs below $25k, 9.4% for AGIs $50k-75k, 8.3% for AGIs $100k-200k)
Charity contributions: $4,020 (reported on 12.2% of returns)
Here:
$4,020
State:
$6,808
(% of AGI for various income ranges: 2.5% for AGIs below $25k, 1.9% for AGIs $100k-200k)
Taxes paid: $4,029 (reported on 17.1% of returns)
78632:
$4,029
State:
$6,921
Earned income credit: $2,029 (reported on 17.1% of returns)
Here:
$2,029
State:
$2,570
(% of AGI for various income ranges: 5.9% for AGIs below $25k, 0.9% for AGIs $25k-50k)
Percentage of individuals using paid preparers for their 2012 taxes: 61.0%
Here:
61%
State:
51%
(% for various income ranges: 57.1% for AGIs below $25k, 58.3% for AGIs $25k-50k, 85.7% for AGIs $50k-75k, 80.0% for AGIs $100k-200k)
Averages for the 2004 tax year for zip code 78632, filed in 2005:
Average Adjusted Gross Income (AGI) in 2004: $38,390 (Individual Income Tax Returns)
Here:
$38,390
State:
$47,881
Salary/wage: $35,840 (reported on 76.4% of returns)
Here:
$35,840
State:
$41,947
(% of AGI for various income ranges: 108.4% for AGIs below $10k, 72.8% for AGIs $10k-25k, 75.8% for AGIs $25k-50k, 74.0% for AGIs $50k-75k, 73.7% for AGIs $75k-100k, 57.5% for AGIs over 100k)
Taxable interest for individuals: $1,076 (reported on 44.7% of returns)
This zip code:
$1,076
Texas:
$2,255
(% of AGI for various income ranges: 12.4% for AGIs below $10k, 1.9% for AGIs $10k-25k, 1.6% for AGIs $25k-50k, 0.4% for AGIs $50k-75k, 0.5% for AGIs $75k-100k, 1.2% for AGIs over 100k)
Taxable dividends: $1,529 (reported on 19.4% of returns)
Here:
$1,529
State:
$4,261
(% of AGI for various income ranges: 7.1% for AGIs below $10k, 2.0% for AGIs $25k-50k, 0.3% for AGIs $50k-75k, 0.3% for AGIs $75k-100k)
Net capital gain/loss: +$9,702 (reported on 16.2% of returns)
Here:
+$9,702
State:
+$16,110
(% of AGI for various income ranges: -0.5% for AGIs $10k-25k, 0.5% for AGIs $50k-75k, 18.6% for AGIs over 100k)
Profit/loss from business: +$7,891 (reported on 15.7% of returns)
Here:
+$7,891
State:
+$11,013
(% of AGI for various income ranges: 9.7% for AGIs below $10k, 6.6% for AGIs $10k-25k, 3.3% for AGIs $25k-50k, 6.6% for AGIs $50k-75k)
Total itemized deductions: $16,118 (23% of AGI, reported on 14.5% of returns)
Here:
$16,118
State:
$19,631
Here:
23.5% of AGI
State:
18.9% of AGI
Charity contributions deductions: $3,512 (5% of AGI, reported on 12.3% of returns)
Here:
$3,512
State:
$4,753
Here:
5.1% of AGI
State:
4.2% of AGI
Total tax: $5,492 (reported on 72.9% of returns)
78632:
$5,492
State:
$9,058
(% of AGI for various income ranges: 5.8% for AGIs below $10k, 4.2% for AGIs $10k-25k, 6.7% for AGIs $25k-50k, 9.9% for AGIs $50k-75k, 11.0% for AGIs $75k-100k, 18.4% for AGIs over 100k)
Earned income credit: $1,639 (reported on 20.5% of returns)
Here:
$1,639
State:
$2,024
Percentage of individuals using paid preparers for their 2004 taxes: 61.3%
Here:
61%
State:
57%
(% for various income ranges: 50.6% for AGIs below $10k, 58.5% for AGIs $10k-25k, 66.0% for AGIs $25k-50k, 64.7% for AGIs $50k-75k, 63.0% for AGIs $75k-100k, 82.4% for AGIs over 100k)
Household received Food Stamps/SNAP in the past 12 months: 45 Household did not receive Food Stamps/SNAP in the past 12 months: 514
Women who did not have a birth in the past 12 months: 240 (131 now married, 108 unmarried)
Housing units in zip code 78632 with a mortgage: 329 Median monthly owner costs for units with a mortgage: $1,306 Median monthly owner costs for units without a mortgage: $571
Residents with income below the poverty level in 2022:
This zip code:
9.9%
Whole state:
14.0%
Residents with income below 50% of the poverty level in 2022:
This zip code:
6.3%
Whole state:
7.4%
Median number of rooms in houses and condos:
Here:
5.5
State:
6.3
Median number of rooms in apartments:
Here:
1.3
State:
4.0
Notable locations in this zip code not listed on our city pages
Size of family households: 95 2-persons, 60 3-persons, 189 4-persons, 12 6-persons
Size of nonfamily households: 175 1-person, 25 2-persons
190 married couples with children.
25 single-parent households (25 women).
90.7% of residents of 78632 zip code speak English at home.
3.9% of residents speak Spanish at home (45% very well, 55% not well).
4.7% of residents speak Asian or Pacific Island language at home (100% not well).
Foreign born population: 25 (2.1%) (0.0% of them are naturalized citizens)
:
2.1%
Whole state:
17.2%
96%Honduras
44%American
17%German
12%Irish
11%English
7%French
1%Scotch-Irish
1%Norwegian
Year of entry for the foreign-born population
02010 or later
02000 to 2009
251990 to 1999
31Before 1990
Housing units lacking complete plumbing facilities: 17.7% Housing units lacking complete kitchen facilities: 8.0%
81.9%Electricity
14.6%No fuel used
2.6%Bottled, tank, or LP gas
1.3%Utility gas
Population in 1990: 295. Population change in the 1990s: +339 (+114.9%).
Place of birth for U.S.-born residents:
This state: 977
Northeast: 31
Midwest: 5
South: 98
West: 35
57% of the 78632 zip code residents lived in the same house 5 years ago. Out of people who lived in different houses, 42% lived in this county. Out of people who lived in different counties, 50% lived in Texas.
97% of the 78632 zip code residents lived in the same house 1 year ago. Out of people who lived in different houses, 45% moved from this county. Out of people who lived in different houses, 61% moved from different county within same state.
Private vs. public school enrollment:
Students in private schools in grades 1 to 8 (elementary and middle school):
Here:
0.0%
Texas:
8.8%
Students in private schools in grades 9 to 12 (high school):
Here:
0.0%
Texas:
8.0%
Students in private undergraduate colleges:
Here:
0.0%
Texas:
16.2%
Occupation by median earnings in the past 12 months ($)
117,512Management occupations
27,020Transportation occupations
25,267Office and administrative support occupations
Top industries in this zip code by the number of employees in 2005:
Other Services (except Public Administration): Religious Organizations (1-4 employees: 1 establishment)
Administrative and Support and Waste Management and Remediation Services: Professional Employer Organizations (1-4: 1)
Construction: Plumbing, Heating, and Air-Conditioning Contractors (1-4: 1)
Professional, Scientific, and Technical Services: Administrative Management and General Management Consulting Services (1-4: 1)
Professional, Scientific, and Technical Services: Process, Physical Distribution, and Logistics Consulting Services (1-4: 1)
Fatal accident statistics in 2014:
Fatal accident count: 1
Vehicles involved in fatal accidents: 2
Fatal accidents caused by drunken drivers: 0
Fatalities: 1
Persons involved in fatal accidents: 4
Pedestrians involved in fatal accidents: 1
Fatal accident statistics in 2013:
Fatal accident count: 3
Vehicles involved in fatal accidents: 3
Fatal accidents caused by drunken drivers: 0
Fatalities: 3
Persons involved in fatal accidents: 4
Pedestrians involved in fatal accidents: 1
Home Mortgage Disclosure Act Aggregated Statistics For Year 2009 (Based on 2 partial tracts)
A) FHA, FSA/RHS & VA Home Purchase Loans
B) Conventional Home Purchase Loans
C) Refinancings
D) Home Improvement Loans
F) Non-occupant Loans on < 5 Family Dwellings (A B C & D)
G) Loans On Manufactured Home Dwelling (A B C & D)
Number
Average Value
Number
Average Value
Number
Average Value
Number
Average Value
Number
Average Value
Number
Average Value
LOANS ORIGINATED
1
$226,140
2
$133,970
8
$146,405
0
$0
0
$0
1
$238,680
APPLICATIONS APPROVED, NOT ACCEPTED
0
$0
0
$0
2
$151,525
0
$0
0
$0
0
$0
APPLICATIONS DENIED
0
$0
3
$94,887
0
$0
2
$72,940
1
$174,720
3
$41,800
APPLICATIONS WITHDRAWN
1
$146,300
0
$0
1
$190,610
0
$0
0
$0
0
$0
FILES CLOSED FOR INCOMPLETENESS
0
$0
0
$0
0
$0
0
$0
0
$0
0
$0
Aggregated Statistics For Year 2008 (Based on 2 partial tracts)
B) Conventional Home Purchase Loans
C) Refinancings
D) Home Improvement Loans
F) Non-occupant Loans on < 5 Family Dwellings (A B C & D)
G) Loans On Manufactured Home Dwelling (A B C & D)
Number
Average Value
Number
Average Value
Number
Average Value
Number
Average Value
Number
Average Value
LOANS ORIGINATED
7
$194,967
6
$133,482
2
$20,275
2
$173,680
3
$52,947
APPLICATIONS APPROVED, NOT ACCEPTED
3
$145,603
0
$0
1
$12,120
0
$0
2
$97,185
APPLICATIONS DENIED
2
$96,975
5
$129,412
3
$72,313
1
$191,440
3
$75,380
APPLICATIONS WITHDRAWN
2
$134,180
1
$140,030
1
$84,440
0
$0
0
$0
FILES CLOSED FOR INCOMPLETENESS
0
$0
0
$0
0
$0
0
$0
0
$0
Aggregated Statistics For Year 2007 (Based on 2 partial tracts)
A) FHA, FSA/RHS & VA Home Purchase Loans
B) Conventional Home Purchase Loans
C) Refinancings
D) Home Improvement Loans
F) Non-occupant Loans on < 5 Family Dwellings (A B C & D)
G) Loans On Manufactured Home Dwelling (A B C & D)
Number
Average Value
Number
Average Value
Number
Average Value
Number
Average Value
Number
Average Value
Number
Average Value
LOANS ORIGINATED
1
$86,940
11
$121,980
2
$184,340
2
$23,615
2
$115,575
3
$76,217
APPLICATIONS APPROVED, NOT ACCEPTED
0
$0
2
$100,110
0
$0
0
$0
0
$0
2
$100,110
APPLICATIONS DENIED
0
$0
2
$120,385
8
$115,055
3
$46,537
0
$0
3
$71,477
APPLICATIONS WITHDRAWN
1
$90,710
1
$91,540
2
$114,740
1
$36,780
0
$0
0
$0
FILES CLOSED FOR INCOMPLETENESS
0
$0
0
$0
0
$0
0
$0
0
$0
0
$0
Aggregated Statistics For Year 2006 (Based on 2 partial tracts)
A) FHA, FSA/RHS & VA Home Purchase Loans
B) Conventional Home Purchase Loans
C) Refinancings
D) Home Improvement Loans
F) Non-occupant Loans on < 5 Family Dwellings (A B C & D)
G) Loans On Manufactured Home Dwelling (A B C & D)
Number
Average Value
Number
Average Value
Number
Average Value
Number
Average Value
Number
Average Value
Number
Average Value
LOANS ORIGINATED
2
$109,100
10
$105,587
3
$93,910
2
$15,255
2
$92,585
3
$84,297
APPLICATIONS APPROVED, NOT ACCEPTED
0
$0
3
$73,567
1
$245,780
0
$0
1
$92,800
2
$53,085
APPLICATIONS DENIED
1
$55,590
4
$81,615
5
$121,722
1
$13,790
1
$89,450
3
$60,330
APPLICATIONS WITHDRAWN
0
$0
2
$114,530
6
$90,427
0
$0
1
$145,460
1
$50,160
FILES CLOSED FOR INCOMPLETENESS
0
$0
0
$0
0
$0
0
$0
0
$0
0
$0
Aggregated Statistics For Year 2005 (Based on 2 partial tracts)
A) FHA, FSA/RHS & VA Home Purchase Loans
B) Conventional Home Purchase Loans
C) Refinancings
D) Home Improvement Loans
F) Non-occupant Loans on < 5 Family Dwellings (A B C & D)
G) Loans On Manufactured Home Dwelling (A B C & D)
Number
Average Value
Number
Average Value
Number
Average Value
Number
Average Value
Number
Average Value
Number
Average Value
LOANS ORIGINATED
1
$106,170
10
$86,108
9
$116,529
1
$47,230
2
$75,240
5
$70,558
APPLICATIONS APPROVED, NOT ACCEPTED
0
$0
4
$63,850
3
$128,187
0
$0
0
$0
3
$73,707
APPLICATIONS DENIED
0
$0
7
$71,896
6
$90,078
1
$54,340
1
$57,270
6
$56,638
APPLICATIONS WITHDRAWN
0
$0
1
$80,670
6
$77,400
2
$65,835
0
$0
0
$0
FILES CLOSED FOR INCOMPLETENESS
0
$0
0
$0
1
$92,800
0
$0
0
$0
0
$0
Aggregated Statistics For Year 2004 (Based on 2 partial tracts)
A) FHA, FSA/RHS & VA Home Purchase Loans
B) Conventional Home Purchase Loans
C) Refinancings
D) Home Improvement Loans
F) Non-occupant Loans on < 5 Family Dwellings (A B C & D)
G) Loans On Manufactured Home Dwelling (A B C & D)
Number
Average Value
Number
Average Value
Number
Average Value
Number
Average Value
Number
Average Value
Number
Average Value
LOANS ORIGINATED
1
$125,820
6
$105,615
7
$94,229
0
$0
1
$104,920
3
$84,713
APPLICATIONS APPROVED, NOT ACCEPTED
0
$0
3
$56,290
2
$95,720
0
$0
0
$0
2
$54,965
APPLICATIONS DENIED
0
$0
5
$65,626
13
$97,587
0
$0
0
$0
8
$53,034
APPLICATIONS WITHDRAWN
0
$0
1
$71,060
5
$95,806
1
$43,890
0
$0
1
$61,450
FILES CLOSED FOR INCOMPLETENESS
0
$0
0
$0
3
$92,517
0
$0
0
$0
0
$0
Aggregated Statistics For Year 2003 (Based on 2 partial tracts)
A) FHA, FSA/RHS & VA Home Purchase Loans
B) Conventional Home Purchase Loans
C) Refinancings
D) Home Improvement Loans
F) Non-occupant Loans on < 5 Family Dwellings (A B C & D)

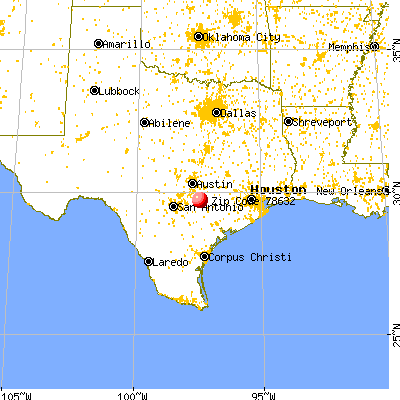


 Nearest zip codes: 78648, 78959, 78953, 78629, 78662, 78616.


