Estimated zip code population in 2022: 6,994 Zip code population in 2010: 6,139 Zip code population in 2000: 5,903
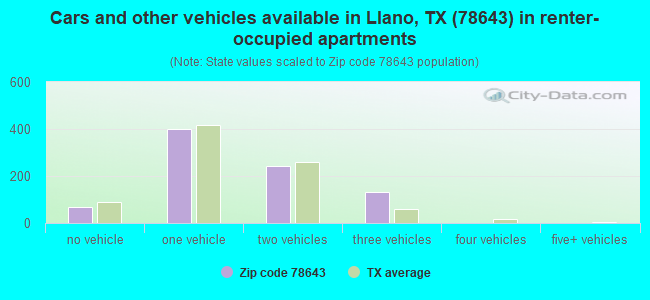
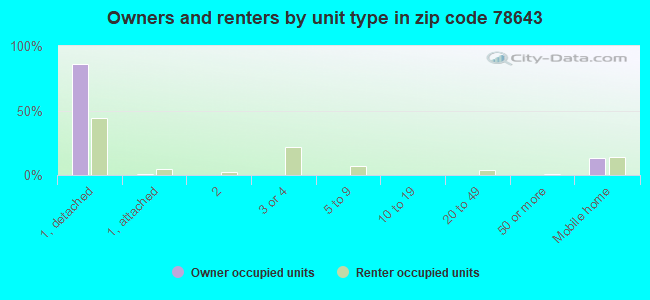
Houses and condos: 4,454 Renter-occupied apartments: 845
% of renters here:
27%
State:
38%
March 2022 cost of living index in zip code 78643: 81.5 (low, U.S. average is 100)
Land area: 704.1 sq. mi. Water area: 5.7 sq. mi.
Population density: 10 people per square mile
(very low).
OSM Map
General Map
Google Map
MSN Map
OSM Map
General Map
Google Map
MSN Map
OSM Map
General Map
Google Map
MSN Map
OSM Map
General Map
Google Map
MSN Map
Please wait while loading the map...
Real estate property taxes paid for housing units in 2022:
This zip code:
0.7% ($2,344)
Texas:
1.5% ($4,050)
Median real estate property taxes paid for housing units with mortgages in 2022: $2,717 (0.7%) Median real estate property taxes paid for housing units with no mortgage in 2022: $1,633 (0.6%)
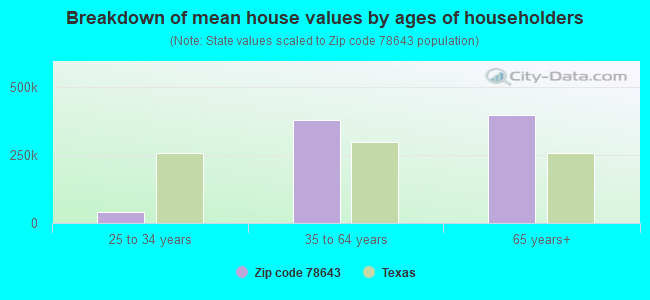
Estimated median house/condo value in 2022: $316,594
78643:
$316,594
Texas:
$275,400
According to our research of Texas and other state lists, there were 13 registered sex offenders living in 78643 zip code as of May 28, 2024. The ratio of all residents to sex offenders in zip code 78643 is 453 to 1. The ratio of registered sex offenders to all residents in this zip code is near the state average.
Median resident age:
This zip code:
53.0 years
Texas median age:
35.6 years
Average household size:
This zip code:
2.2 people
Texas:
2.6 people
Averages for the 2020 tax year for zip code 78643, filed in 2021:
Average Adjusted Gross Income (AGI) in 2020: $72,262 (Individual Income Tax Returns)
Here:
$72,262
State:
$77,054
Salary/wage: $55,049 (reported on 68.9% of returns)
Here:
$55,049
State:
$62,766
(% of AGI for various income ranges: 1149.0% for AGIs below $25k, 3264.4% for AGIs $25k-50k, 5691.3% for AGIs $50k-75k, 8708.8% for AGIs $75k-100k, 16757.4% for AGIs $100k-200k, 75170.0% for AGIs over 200k)
Taxable interest for individuals: $2,472 (reported on 33.3% of returns)
This zip code:
$2,472
Texas:
$2,665
(% of AGI for various income ranges: 35.4% for AGIs below $25k, 33.3% for AGIs $25k-50k, 66.0% for AGIs $50k-75k, 121.8% for AGIs $75k-100k, 312.6% for AGIs $100k-200k, 2922.5% for AGIs over 200k)
Ordinary dividends: $7,656 (reported on 23.8% of returns)
Here:
$7,656
State:
$10,044
(% of AGI for various income ranges: 59.6% for AGIs below $25k, 64.4% for AGIs $25k-50k, 143.3% for AGIs $50k-75k, 304.7% for AGIs $75k-100k, 803.2% for AGIs $100k-200k, 6257.5% for AGIs over 200k)
Net capital gain/loss in AGI: +$27,430 (reported on 23.2% of returns)
Here:
+$27,430
State:
+$39,590
(% of AGI for various income ranges: 34.6% for AGIs below $25k, 70.7% for AGIs $25k-50k, 147.0% for AGIs $50k-75k, 510.6% for AGIs $75k-100k, 1640.5% for AGIs $100k-200k, 37435.0% for AGIs over 200k)
Profit/loss from business: +$12,385 (reported on 22.5% of returns)
Here:
+$12,385
State:
+$10,888
(% of AGI for various income ranges: 164.0% for AGIs below $25k, 241.7% for AGIs $25k-50k, 377.3% for AGIs $50k-75k, 217.6% for AGIs $75k-100k, 1255.8% for AGIs $100k-200k, 6130.0% for AGIs over 200k)
Taxable individual retirement arrangement distribution: $26,884 (reported on 14.3% of returns)
78643:
$26,884
Texas:
$24,740
(% of AGI for various income ranges: 116.1% for AGIs below $25k, 205.6% for AGIs $25k-50k, 513.0% for AGIs $50k-75k, 777.6% for AGIs $75k-100k, 1817.9% for AGIs $100k-200k, 9650.0% for AGIs over 200k)
Total itemized deductions: $34,525 (reported on 6.3% of returns)
Here:
$34,525
State:
$40,428
(% of AGI for various income ranges: 177.0% for AGIs $25k-50k, 165.0% for AGIs $50k-75k, 511.2% for AGIs $75k-100k, 1019.5% for AGIs $100k-200k, 6620.0% for AGIs over 200k)
Charity contributions: $11,639 (reported on 5.7% of returns)
Here:
$11,639
State:
$18,201
(% of AGI for various income ranges: 14.7% for AGIs below $25k, 114.3% for AGIs $50k-75k, 272.6% for AGIs $100k-200k, 2827.5% for AGIs over 200k)
Taxes paid: $6,595 (reported on 6.3% of returns)
78643:
$6,595
State:
$7,821
(% of AGI for various income ranges: 27.6% for AGIs $25k-50k, 29.0% for AGIs $50k-75k, 75.9% for AGIs $75k-100k, 231.6% for AGIs $100k-200k, 1285.0% for AGIs over 200k)
Earned income credit: $2,156 (reported on 15.2% of returns)
Here:
$2,156
State:
$2,584
(% of AGI for various income ranges: 92.0% for AGIs below $25k, 72.4% for AGIs $25k-50k)
Percentage of individuals using paid preparers for their 2020 taxes: 91.7%
Here:
92%
State:
92%
(% for various income ranges: 89.7% for AGIs below $25k, 94.5% for AGIs $25k-50k, 91.3% for AGIs $50k-75k, 89.7% for AGIs $75k-100k, 93.0% for AGIs $100k-200k, 94.1% for AGIs over 200k)
Averages for the 2012 tax year for zip code 78643, filed in 2013:
Average Adjusted Gross Income (AGI) in 2012: $53,871 (Individual Income Tax Returns)
Here:
$53,871
State:
$65,384
Salary/wage: $40,194 (reported on 70.7% of returns)
Here:
$40,194
State:
$52,524
(% of AGI for various income ranges: 67.5% for AGIs below $25k, 67.7% for AGIs $25k-50k, 56.0% for AGIs $50k-75k, 58.5% for AGIs $75k-100k, 56.2% for AGIs $100k-200k, 29.9% for AGIs over 200k)
Taxable interest for individuals: $2,261 (reported on 36.0% of returns)
This zip code:
$2,261
Texas:
$2,372
(% of AGI for various income ranges: 2.6% for AGIs below $25k, 1.1% for AGIs $25k-50k, 1.4% for AGIs $50k-75k, 1.1% for AGIs $75k-100k, 1.9% for AGIs $100k-200k, 1.4% for AGIs over 200k)
Ordinary dividends: $5,050 (reported on 21.9% of returns)
Here:
$5,050
State:
$9,721
(% of AGI for various income ranges: 1.9% for AGIs below $25k, 1.6% for AGIs $25k-50k, 2.7% for AGIs $50k-75k, 1.9% for AGIs $75k-100k, 2.1% for AGIs $100k-200k, 2.1% for AGIs over 200k)
Net capital gain/loss in AGI: +$23,153 (reported on 18.0% of returns)
Here:
+$23,153
State:
+$35,319
(% of AGI for various income ranges: 0.8% for AGIs below $25k, 0.7% for AGIs $25k-50k, 2.6% for AGIs $50k-75k, 1.1% for AGIs $75k-100k, 4.1% for AGIs $100k-200k, 24.3% for AGIs over 200k)
Profit/loss from business: +$11,796 (reported on 24.0% of returns)
Here:
+$11,796
State:
+$13,732
(% of AGI for various income ranges: 13.2% for AGIs below $25k, 7.1% for AGIs $25k-50k, 3.7% for AGIs $50k-75k, 2.9% for AGIs $75k-100k, 5.8% for AGIs $100k-200k, 3.0% for AGIs over 200k)
Taxable individual retirement arrangement distribution: $19,878 (reported on 14.5% of returns)
78643:
$19,878
Texas:
$19,511
(% of AGI for various income ranges: 5.0% for AGIs below $25k, 3.9% for AGIs $25k-50k, 4.3% for AGIs $50k-75k, 4.7% for AGIs $75k-100k, 7.7% for AGIs $100k-200k, 5.7% for AGIs over 200k)
Total itemized deductions: $22,866 (20% of AGI, reported on 19.8% of returns)
Here:
$22,866
State:
$24,724
Here:
20.2% of AGI
State:
15.9% of AGI
(% of AGI for various income ranges: 11.0% for AGIs below $25k, 7.5% for AGIs $25k-50k, 8.5% for AGIs $50k-75k, 9.0% for AGIs $75k-100k, 10.2% for AGIs $100k-200k, 6.3% for AGIs over 200k)
Charity contributions: $6,319 (reported on 14.8% of returns)
Here:
$6,319
State:
$6,808
(% of AGI for various income ranges: 0.5% for AGIs below $25k, 1.1% for AGIs $25k-50k, 1.3% for AGIs $50k-75k, 1.8% for AGIs $75k-100k, 1.9% for AGIs $100k-200k, 2.7% for AGIs over 200k)
Taxes paid: $5,104 (reported on 19.8% of returns)
78643:
$5,104
State:
$6,921
(% of AGI for various income ranges: 1.5% for AGIs below $25k, 1.4% for AGIs $25k-50k, 1.8% for AGIs $50k-75k, 2.1% for AGIs $75k-100k, 3.0% for AGIs $100k-200k, 1.4% for AGIs over 200k)
Earned income credit: $2,170 (reported on 20.1% of returns)
Here:
$2,170
State:
$2,570
(% of AGI for various income ranges: 6.8% for AGIs below $25k, 1.1% for AGIs $25k-50k)
Percentage of individuals using paid preparers for their 2012 taxes: 58.0%
Here:
58%
State:
51%
(% for various income ranges: 55.5% for AGIs below $25k, 55.7% for AGIs $25k-50k, 58.5% for AGIs $50k-75k, 60.9% for AGIs $75k-100k, 63.6% for AGIs $100k-200k, 87.5% for AGIs over 200k)
Averages for the 2004 tax year for zip code 78643, filed in 2005:
Average Adjusted Gross Income (AGI) in 2004: $43,326 (Individual Income Tax Returns)
Here:
$43,326
State:
$47,881
Salary/wage: $31,384 (reported on 70.8% of returns)
Here:
$31,384
State:
$41,947
(% of AGI for various income ranges: 125.9% for AGIs below $10k, 66.7% for AGIs $10k-25k, 69.4% for AGIs $25k-50k, 58.9% for AGIs $50k-75k, 54.5% for AGIs $75k-100k, 28.7% for AGIs over 100k)
Taxable interest for individuals: $2,314 (reported on 47.4% of returns)
This zip code:
$2,314
Texas:
$2,255
(% of AGI for various income ranges: 18.3% for AGIs below $10k, 3.0% for AGIs $10k-25k, 2.5% for AGIs $25k-50k, 2.8% for AGIs $50k-75k, 2.9% for AGIs $75k-100k, 1.6% for AGIs over 100k)
Taxable dividends: $3,618 (reported on 25.6% of returns)
Here:
$3,618
State:
$4,261
(% of AGI for various income ranges: 4.7% for AGIs below $10k, 1.8% for AGIs $10k-25k, 1.3% for AGIs $25k-50k, 1.8% for AGIs $50k-75k, 2.1% for AGIs $75k-100k, 2.9% for AGIs over 100k)
Net capital gain/loss: +$11,316 (reported on 23.6% of returns)
Here:
+$11,316
State:
+$16,110
(% of AGI for various income ranges: -1.6% for AGIs below $10k, 1.3% for AGIs $10k-25k, 1.2% for AGIs $25k-50k, 3.1% for AGIs $50k-75k, 6.0% for AGIs $75k-100k, 12.4% for AGIs over 100k)
Profit/loss from business: +$8,345 (reported on 23.4% of returns)
Here:
+$8,345
State:
+$11,013
(% of AGI for various income ranges: 8.8% for AGIs below $10k, 8.3% for AGIs $10k-25k, 4.7% for AGIs $25k-50k, 4.5% for AGIs $50k-75k, 6.3% for AGIs $75k-100k, 2.5% for AGIs over 100k)
IRA payment deduction: $3,268 (reported on 2.6% of returns)
78643:
$3,268
Texas:
$3,120
(% of AGI for various income ranges: 0.2% for AGIs $10k-25k, 0.3% for AGIs $25k-50k, 0.2% for AGIs $50k-75k, 0.5% for AGIs $75k-100k)
Self-employed pension: $10,056 (reported on 0.7% of returns)
Here:
$10,056
Texas:
$16,401
Total itemized deductions: $18,335 (18% of AGI, reported on 19.1% of returns)
Here:
$18,335
State:
$19,631
Here:
17.7% of AGI
State:
18.9% of AGI
(% of AGI for various income ranges: 17.4% for AGIs below $10k, 6.2% for AGIs $10k-25k, 8.7% for AGIs $25k-50k, 9.3% for AGIs $50k-75k, 12.1% for AGIs $75k-100k, 5.9% for AGIs over 100k)
Charity contributions deductions: $3,932 (3% of AGI, reported on 15.9% of returns)
Here:
$3,932
State:
$4,753
Here:
3.5% of AGI
State:
4.2% of AGI
(% of AGI for various income ranges: 1.6% for AGIs below $10k, 0.7% for AGIs $10k-25k, 0.9% for AGIs $25k-50k, 1.8% for AGIs $50k-75k, 2.0% for AGIs $75k-100k, 1.6% for AGIs over 100k)
Total tax: $6,939 (reported on 72.8% of returns)
78643:
$6,939
State:
$9,058
(% of AGI for various income ranges: 5.8% for AGIs below $10k, 4.1% for AGIs $10k-25k, 6.7% for AGIs $25k-50k, 9.2% for AGIs $50k-75k, 11.7% for AGIs $75k-100k, 18.2% for AGIs over 100k)
Earned income credit: $1,791 (reported on 18.1% of returns)
Here:
$1,791
State:
$2,024
Percentage of individuals using paid preparers for their 2004 taxes: 64.6%
Here:
65%
State:
57%
(% for various income ranges: 60.1% for AGIs below $10k, 64.2% for AGIs $10k-25k, 65.6% for AGIs $25k-50k, 66.6% for AGIs $50k-75k, 66.5% for AGIs $75k-100k, 75.0% for AGIs over 100k)
Likely homosexual households (counted as self-reported same-sex unmarried-partner households)
Lesbian couples: 0.1% of all households
Gay men: 0.0% of all households
Household received Food Stamps/SNAP in the past 12 months: 291 Household did not receive Food Stamps/SNAP in the past 12 months: 2,883
Women who had a birth in the past 12 months: 33 (33 now married, 0 unmarried) Women who did not have a birth in the past 12 months: 1,114 (405 now married, 711 unmarried)
Housing units in zip code 78643 with a mortgage: 1,054 (20 second mortgage, 19 both second mortgage and home equity loan) Houses without a mortgage: 144
Median monthly owner costs for units with a mortgage: $1,478 Median monthly owner costs for units without a mortgage: $543
Residents with income below the poverty level in 2022:
This zip code:
9.0%
Whole state:
14.0%
Residents with income below 50% of the poverty level in 2022:
This zip code:
5.6%
Whole state:
7.4%
Median number of rooms in houses and condos:
Here:
5.8
State:
6.3
Median number of rooms in apartments:
Here:
4.6
State:
4.0
Notable locations in this zip code not listed on our city pages
Notable locations in zip code 78643: Duncan Community Center (A), Fowler Ranch (B), Granite Hills Ranch (C), Llano County Courthouse Historic District (D), Llano County Courthouse (E), Llano Volunteer Fire Department Station 2 (F), Castell Volunteer Fire Department (G), Llano County Museum (H), Hill Country Wildlife Museum (I), Llano Volunteer Fire Department Station 1 (J), Llano County Emergency Medical Service (K), Badu Building (L), Southern Hotel (M), Sunrise Beach Volunteer Fire Department (N), Sunrise Beach Police Station (O), Sunrise Beach Village Hall (P). Display/hide their locations on the map
Churches in zip code 78643 include: Our Lady of the Lake Church (A), Shiloh Church (B), Sunrise Beach Baptist Church (C), Sunrise Beach Federated Church (D), First Presbyterian Church (E), United Methodist Church (F), Saint James Lutheran Church (G), Grace Episcopal Church (H), Holy Trinity Catholic Church (I). Display/hide their locations on the map
Cemeteries: Martin Cemetery (1), Cap Mountain Cemetery (2), Mayes Chapel Cemetery (3), Schneider Cemetery (4), Sixmile Cemetery (5), Tow Cemetery (6), Rossberg Cemetery (7). Display/hide their locations on the map
Reservoirs: Llano City Lake (A), Freight Development Company Lake (B), Ratliff Lake (C), Llano River Lake (D), Llano Park Lake (E), Moss Lake 2 (F). Display/hide their locations on the map
Streams, rivers, and creeks: Board Branch (A), Blockhouse Creek (B), Bernst Creek (C), Bennett Creek (D), Bedford Creek (E), Barnett Branch (F), Bailey Branch (G), Babyhead Creek (H), West Walnut Creek (I). Display/hide their locations on the map
In group quarters: 128 (-1 institutionalized population)
Size of family households: 1,311 2-persons, 376 3-persons, 204 4-persons, 240 5-persons, 15 6-persons, 3 7-or-more-persons
Size of nonfamily households: 930 1-person, 109 2-persons, 2 3-persons
490 married couples with children.
506 single-parent households (58 men, 448 women).
94.8% of residents of 78643 zip code speak English at home.
4.6% of residents speak Spanish at home (51% very well, 5% well, 34% not well, 10% not at all).
1.1% of residents speak other Indo-European language at home (92% very well, 8% not well).
0.1% of residents speak Asian or Pacific Island language at home (60% very well, 40% well).
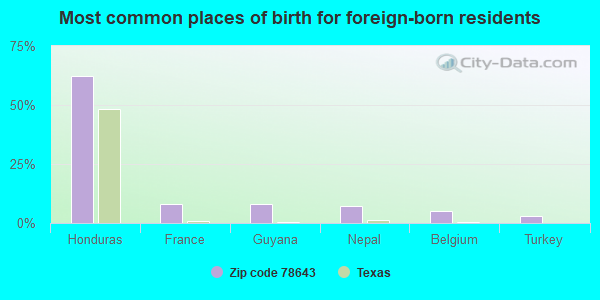
Foreign born population: 178 (2.6%) (46.2% of them are naturalized citizens)
This zip code:
2.6%
Whole state:
17.2%
62%Honduras
8%France
8%Guyana
7%Nepal
5%Belgium
3%Turkey
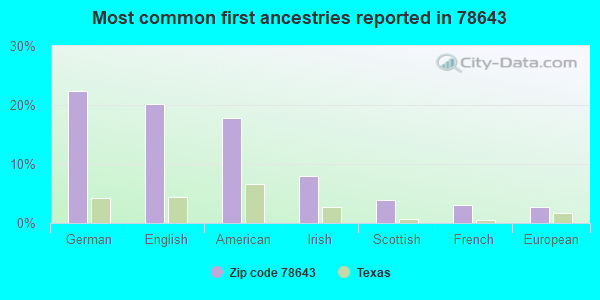
22%German
20%English
18%American
8%Irish
4%Scottish
3%French
3%European
Year of entry for the foreign-born population
922010 or later
172000 to 2009
121990 to 1999
127Before 1990
Housing units lacking complete plumbing facilities: 3.0% Housing units lacking complete kitchen facilities: 3.5%
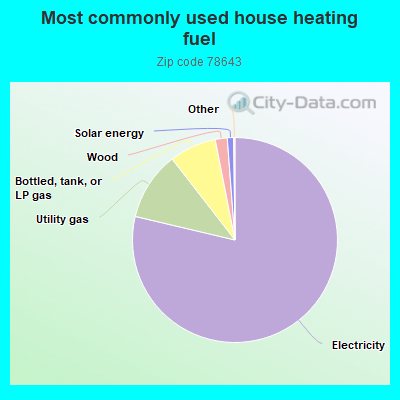
78.7%Electricity
10.8%Utility gas
7.4%Bottled, tank, or LP gas
1.9%Wood
1.0%Solar energy
Population in 1990: 4,802. Population change in the 1990s: +1,101 (+22.9%).
Place of birth for U.S.-born residents:
This state: 4,832
Northeast: 242
Midwest: 382
South: 693
West: 579
58% of the 78643 zip code residents lived in the same house 5 years ago. Out of people who lived in different houses, 50% lived in this county. Out of people who lived in different counties, 50% lived in Texas.
90% of the 78643 zip code residents lived in the same house 1 year ago. Out of people who lived in different houses, 24% moved from this county. Out of people who lived in different houses, 64% moved from different county within same state. Out of people who lived in different houses, 8% moved from different state. Out of people who lived in different houses, 7% moved from abroad.
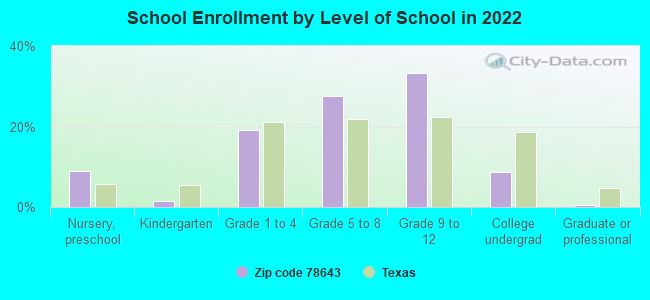
Private vs. public school enrollment:
Students in private schools in grades 1 to 8 (elementary and middle school): 54
Here:
9.7%
Texas:
8.8%
Students in private schools in grades 9 to 12 (high school): 25
Here:
6.3%
Texas:
8.0%
Students in private undergraduate colleges: 3
Here:
3.7%
Texas:
16.2%
Occupation by median earnings in the past 12 months ($)
152,166Architecture and engineering occupations
90,600Health diagnosing and treating practitioners and other technical occupations
73,907Management occupations
65,396Computer and mathematical occupations
62,934Transportation occupations
54,404Education, training, and library occupations
Top industries in this zip code by the number of employees in 2005:
Health Care and Social Assistance: General Medical and Surgical Hospitals (100-249 employees: 1 establishment)
Wholesale Trade: Beer and Ale Merchant Wholesalers (50-99: 1)
Health Care and Social Assistance: Offices of Physicians (except Mental Health Specialists) (20-49: 1, 5-9: 1, 1-4: 2)
Health Care and Social Assistance: Outpatient Mental Health and Substance Abuse Centers (20-49: 1, 1-4: 1)
People in group quarters in 2010:
93 people in nursing facilities/skilled-nursing facilities
6 people in group homes intended for adults
People in group quarters in 2000:
109 people in nursing homes
17 people in local jails and other confinement facilities (including police lockups)
15 people in homes for the mentally retarded
Fatal accident statistics in 2014:
Fatal accident count: 2
Vehicles involved in fatal accidents: 2
Fatal accidents caused by drunken drivers: 1
Fatalities: 2
Persons involved in fatal accidents: 3
Pedestrians involved in fatal accidents: 0
Fatal accident statistics in 2013:
Fatal accident count: 3
Vehicles involved in fatal accidents: 3
Fatal accidents caused by drunken drivers: 1
Fatalities: 3
Persons involved in fatal accidents: 4
Pedestrians involved in fatal accidents: 0
2002 - 2018 National Fire Incident Reporting System (NFIRS) incidents
Based on the data from the years 2002 - 2018 the average number of fire incidents per year is 24. The highest number of fires - 87 took place in 2008, and the least - 0 in 2011. The data has a dropping trend.
When looking into fire subcategories, the most incidents belonged to: Outside Fires (73.5%), and Structure Fires (14.6%).
Fire incident types reported to NFIRS in Zip Code 78643

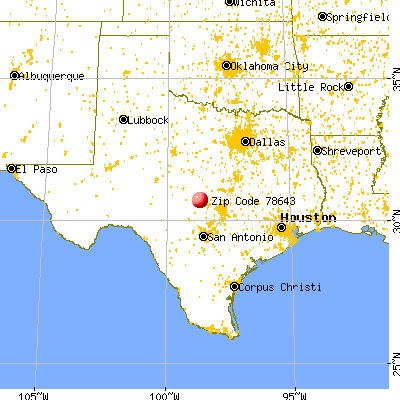


 Nearest zip codes: 76831, 76885, 78639, 78607, 78675, 78609.


 Based on the data from the years 2002 - 2018 the average number of fire incidents per year is 24. The highest number of fires - 87 took place in 2008, and the least - 0 in 2011. The data has a dropping trend.
 When looking into fire subcategories, the most incidents belonged to: Outside Fires (73.5%), and Structure Fires (14.6%).