Estimated zip code population in 2022: 23,268 Zip code population in 2010: 19,277 Zip code population in 2000: 16,527
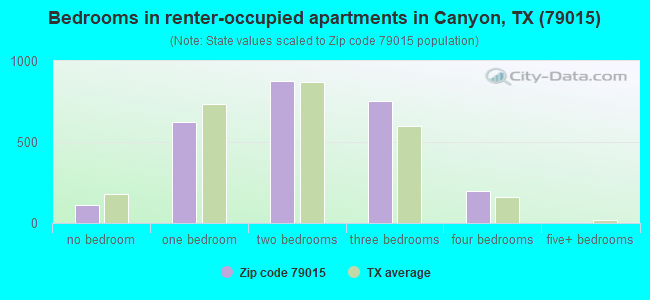
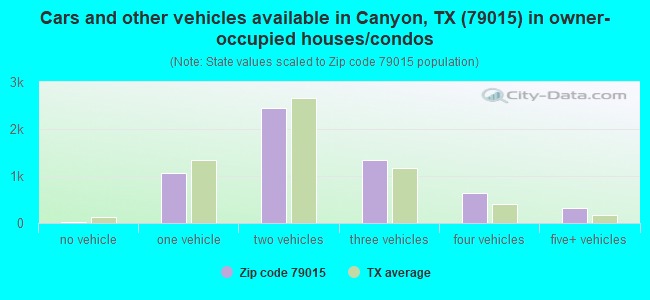
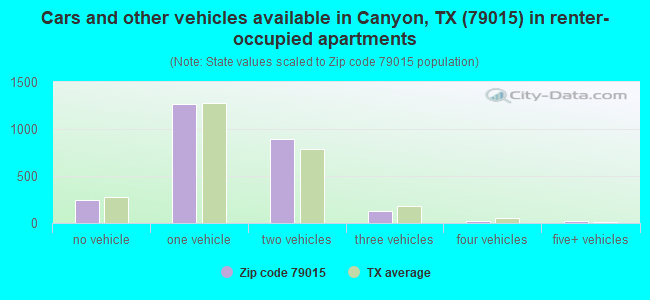
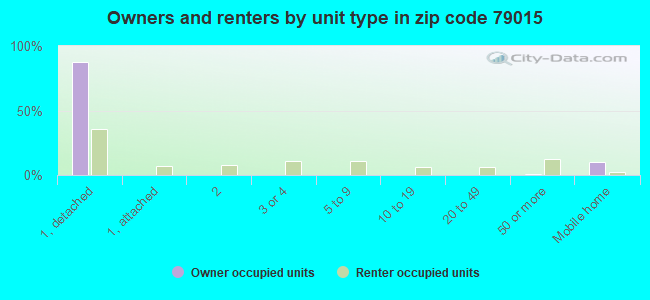
Houses and condos: 9,522 Renter-occupied apartments: 2,580
% of renters here:
31%
State:
38%
March 2022 cost of living index in zip code 79015: 83.8 (less than average, U.S. average is 100)
Land area: 383.7 sq. mi. Water area: 1.8 sq. mi.
Population density: 61 people per square mile
(very low).
OSM Map
General Map
Google Map
MSN Map
OSM Map
General Map
Google Map
MSN Map
OSM Map
General Map
Google Map
MSN Map
OSM Map
General Map
Google Map
MSN Map
Please wait while loading the map...
Real estate property taxes paid for housing units in 2022:
This zip code:
1.3% ($3,962)
Texas:
1.5% ($4,050)
Median real estate property taxes paid for housing units with mortgages in 2022: $4,128 (1.2%) Median real estate property taxes paid for housing units with no mortgage in 2022: $3,704 (1.4%)
Business Search- 14 Million verified businesses
Males: 11,428
(49.1%)
Females: 11,839
(50.9%)
For population 25 years and over in 79015:
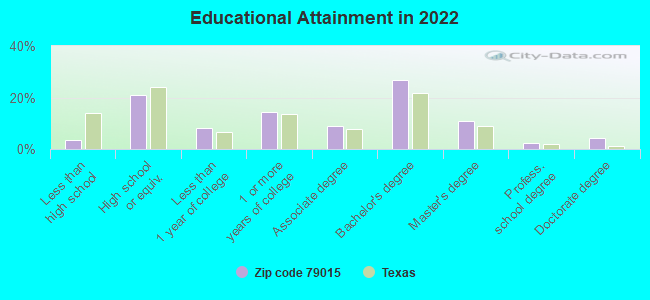
High school or higher: 97.2%
Bachelor's degree or higher: 44.6%
Graduate or professional degree: 17.5%
Unemployed: 1.8%
Mean travel time to work (commute): 23.4 minutes
For population 15 years and over in 79015:
Never married: 32.5%
Now married: 55.1%
Separated: 0.5%
Widowed: 3.1%
Divorced: 8.8%
Zip code 79015 compared to state average:
Unemployed percentage below state average.
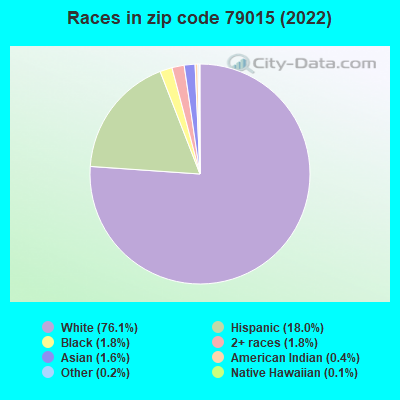
Black race population percentage significantly below state average.
Hispanic race population percentage below state average.
Foreign-born population percentage significantly below state average.
Length of stay since moving in above state average.
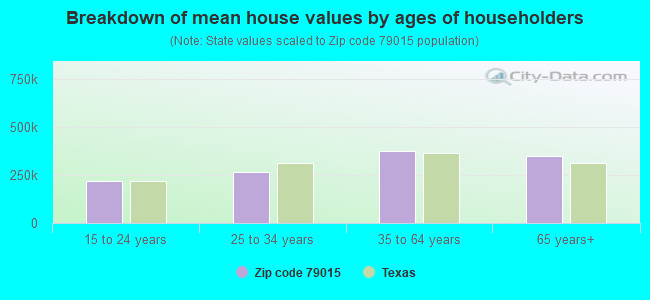
Estimated median house/condo value in 2022: $310,461
79015:
$310,461
Texas:
$275,400
According to our research of Texas and other state lists, there were 49 registered sex offenders living in 79015 zip code as of May 17, 2024. The ratio of all residents to sex offenders in zip code 79015 is 449 to 1. The ratio of registered sex offenders to all residents in this zip code is near the state average.
Median resident age:
This zip code:
34.5 years
Texas median age:
35.6 years
Average household size:
This zip code:
2.6 people
Texas:
2.6 people
Averages for the 2020 tax year for zip code 79015, filed in 2021:
Average Adjusted Gross Income (AGI) in 2020: $79,402 (Individual Income Tax Returns)
Here:
$79,402
State:
$77,054
Salary/wage: $64,561 (reported on 84.1% of returns)
Here:
$64,561
State:
$62,766
(% of AGI for various income ranges: 1281.9% for AGIs below $25k, 3592.3% for AGIs $25k-50k, 6541.6% for AGIs $50k-75k, 9465.8% for AGIs $75k-100k, 18818.8% for AGIs $100k-200k, 71234.4% for AGIs over 200k)
Taxable interest for individuals: $2,074 (reported on 31.2% of returns)
This zip code:
$2,074
Texas:
$2,665
(% of AGI for various income ranges: 17.7% for AGIs below $25k, 17.9% for AGIs $25k-50k, 42.2% for AGIs $50k-75k, 61.3% for AGIs $75k-100k, 121.5% for AGIs $100k-200k, 2155.6% for AGIs over 200k)
Ordinary dividends: $6,131 (reported on 17.1% of returns)
Here:
$6,131
State:
$10,044
(% of AGI for various income ranges: 22.9% for AGIs below $25k, 31.9% for AGIs $25k-50k, 77.2% for AGIs $50k-75k, 100.4% for AGIs $75k-100k, 219.9% for AGIs $100k-200k, 3346.2% for AGIs over 200k)
Net capital gain/loss in AGI: +$25,974 (reported on 17.4% of returns)
Here:
+$25,974
State:
+$39,590
(% of AGI for various income ranges: 13.2% for AGIs below $25k, 32.2% for AGIs $25k-50k, 115.8% for AGIs $50k-75k, 204.9% for AGIs $75k-100k, 529.5% for AGIs $100k-200k, 21611.9% for AGIs over 200k)
Profit/loss from business: +$14,487 (reported on 19.3% of returns)
Here:
+$14,487
State:
+$10,888
(% of AGI for various income ranges: 75.4% for AGIs below $25k, 139.6% for AGIs $25k-50k, 236.4% for AGIs $50k-75k, 461.5% for AGIs $75k-100k, 563.4% for AGIs $100k-200k, 7333.8% for AGIs over 200k)
Taxable individual retirement arrangement distribution: $22,417 (reported on 8.8% of returns)
79015:
$22,417
Texas:
$24,740
(% of AGI for various income ranges: 36.9% for AGIs below $25k, 99.3% for AGIs $25k-50k, 181.4% for AGIs $50k-75k, 361.5% for AGIs $75k-100k, 641.1% for AGIs $100k-200k, 3503.8% for AGIs over 200k)
Self-employed (Keogh) retirement plans: $21,767 (reported on 0.3% of returns)
79015:
$21,767
Texas:
$29,298
(% of AGI for various income ranges: 61.6% for AGIs $100k-200k)
Total itemized deductions: $42,842 (reported on 7.2% of returns)
Here:
$42,842
State:
$40,428
(% of AGI for various income ranges: 25.1% for AGIs below $25k, 92.2% for AGIs $25k-50k, 249.2% for AGIs $50k-75k, 284.2% for AGIs $75k-100k, 795.2% for AGIs $100k-200k, 9393.8% for AGIs over 200k)
Charity contributions: $23,478 (reported on 6.6% of returns)
Here:
$23,478
State:
$18,201
(% of AGI for various income ranges: 29.4% for AGIs $25k-50k, 49.3% for AGIs $50k-75k, 100.3% for AGIs $75k-100k, 301.1% for AGIs $100k-200k, 6266.2% for AGIs over 200k)
Taxes paid: $7,144 (reported on 7.1% of returns)
79015:
$7,144
State:
$7,821
(% of AGI for various income ranges: 2.3% for AGIs below $25k, 13.9% for AGIs $25k-50k, 38.5% for AGIs $50k-75k, 51.2% for AGIs $75k-100k, 175.1% for AGIs $100k-200k, 1282.5% for AGIs over 200k)
Earned income credit: $2,222 (reported on 11.8% of returns)
Here:
$2,222
State:
$2,584
(% of AGI for various income ranges: 67.5% for AGIs below $25k, 59.4% for AGIs $25k-50k, 1.4% for AGIs $50k-75k)
Percentage of individuals using paid preparers for their 2020 taxes: 94.2%
Here:
94%
State:
92%
(% for various income ranges: 93.9% for AGIs below $25k, 94.0% for AGIs $25k-50k, 93.2% for AGIs $50k-75k, 94.0% for AGIs $75k-100k, 94.7% for AGIs $100k-200k, 96.4% for AGIs over 200k)
Averages for the 2012 tax year for zip code 79015, filed in 2013:
Average Adjusted Gross Income (AGI) in 2012: $64,003 (Individual Income Tax Returns)
Here:
$64,003
State:
$65,384
Salary/wage: $50,093 (reported on 85.5% of returns)
Here:
$50,093
State:
$52,524
(% of AGI for various income ranges: 82.6% for AGIs below $25k, 78.1% for AGIs $25k-50k, 77.0% for AGIs $50k-75k, 76.4% for AGIs $75k-100k, 77.3% for AGIs $100k-200k, 35.9% for AGIs over 200k)
Taxable interest for individuals: $2,030 (reported on 29.7% of returns)
This zip code:
$2,030
Texas:
$2,372
(% of AGI for various income ranges: 1.1% for AGIs below $25k, 0.9% for AGIs $25k-50k, 0.8% for AGIs $50k-75k, 0.6% for AGIs $75k-100k, 0.6% for AGIs $100k-200k, 1.6% for AGIs over 200k)
Ordinary dividends: $4,848 (reported on 17.2% of returns)
Here:
$4,848
State:
$9,721
(% of AGI for various income ranges: 1.3% for AGIs below $25k, 0.9% for AGIs $25k-50k, 0.9% for AGIs $50k-75k, 0.6% for AGIs $75k-100k, 0.9% for AGIs $100k-200k, 2.5% for AGIs over 200k)
Net capital gain/loss in AGI: +$16,534 (reported on 15.0% of returns)
Here:
+$16,534
State:
+$35,319
(% of AGI for various income ranges: 0.2% for AGIs below $25k, 0.2% for AGIs $25k-50k, 0.7% for AGIs $50k-75k, 1.1% for AGIs $75k-100k, 1.8% for AGIs $100k-200k, 12.0% for AGIs over 200k)
Profit/loss from business: +$14,008 (reported on 19.7% of returns)
Here:
+$14,008
State:
+$13,732
(% of AGI for various income ranges: 5.6% for AGIs below $25k, 4.7% for AGIs $25k-50k, 3.9% for AGIs $50k-75k, 2.9% for AGIs $75k-100k, 3.1% for AGIs $100k-200k, 6.2% for AGIs over 200k)
Taxable individual retirement arrangement distribution: $17,196 (reported on 9.1% of returns)
79015:
$17,196
Texas:
$19,511
(% of AGI for various income ranges: 1.7% for AGIs below $25k, 2.4% for AGIs $25k-50k, 2.5% for AGIs $50k-75k, 2.8% for AGIs $75k-100k, 2.5% for AGIs $100k-200k, 2.4% for AGIs over 200k)
Self-employment retirement plans: $22,025 (reported on 0.5% of returns)
79015:
$22,025
Texas:
$23,938
Total itemized deductions: $22,008 (17% of AGI, reported on 27.6% of returns)
Here:
$22,008
State:
$24,724
Here:
17.4% of AGI
State:
15.9% of AGI
(% of AGI for various income ranges: 7.3% for AGIs below $25k, 8.1% for AGIs $25k-50k, 9.4% for AGIs $50k-75k, 10.4% for AGIs $75k-100k, 11.2% for AGIs $100k-200k, 8.3% for AGIs over 200k)
Charity contributions: $7,401 (reported on 22.9% of returns)
Here:
$7,401
State:
$6,808
(% of AGI for various income ranges: 0.7% for AGIs below $25k, 1.4% for AGIs $25k-50k, 2.0% for AGIs $50k-75k, 2.5% for AGIs $75k-100k, 3.2% for AGIs $100k-200k, 3.5% for AGIs over 200k)
Taxes paid: $5,476 (reported on 27.3% of returns)
79015:
$5,476
State:
$6,921
(% of AGI for various income ranges: 1.2% for AGIs below $25k, 1.7% for AGIs $25k-50k, 2.2% for AGIs $50k-75k, 2.6% for AGIs $75k-100k, 3.1% for AGIs $100k-200k, 2.1% for AGIs over 200k)
Earned income credit: $2,133 (reported on 14.5% of returns)
Here:
$2,133
State:
$2,570
(% of AGI for various income ranges: 5.1% for AGIs below $25k, 1.1% for AGIs $25k-50k)
Percentage of individuals using paid preparers for their 2012 taxes: 47.7%
Here:
48%
State:
51%
(% for various income ranges: 38.9% for AGIs below $25k, 44.7% for AGIs $25k-50k, 51.9% for AGIs $50k-75k, 51.2% for AGIs $75k-100k, 59.3% for AGIs $100k-200k, 86.2% for AGIs over 200k)
Averages for the 2004 tax year for zip code 79015, filed in 2005:
Average Adjusted Gross Income (AGI) in 2004: $43,199 (Individual Income Tax Returns)
Here:
$43,199
State:
$47,881
Salary/wage: $38,321 (reported on 84.7% of returns)
Here:
$38,321
State:
$41,947
(% of AGI for various income ranges: 196.8% for AGIs below $10k, 77.4% for AGIs $10k-25k, 82.0% for AGIs $25k-50k, 78.6% for AGIs $50k-75k, 79.6% for AGIs $75k-100k, 61.0% for AGIs over 100k)
Taxable interest for individuals: $2,135 (reported on 38.8% of returns)
This zip code:
$2,135
Texas:
$2,255
(% of AGI for various income ranges: 9.8% for AGIs below $10k, 2.6% for AGIs $10k-25k, 1.6% for AGIs $25k-50k, 1.5% for AGIs $50k-75k, 1.1% for AGIs $75k-100k, 2.4% for AGIs over 100k)
Taxable dividends: $2,231 (reported on 20.4% of returns)
Here:
$2,231
State:
$4,261
(% of AGI for various income ranges: 4.3% for AGIs below $10k, 1.0% for AGIs $10k-25k, 0.7% for AGIs $25k-50k, 0.7% for AGIs $50k-75k, 0.8% for AGIs $75k-100k, 1.6% for AGIs over 100k)
Net capital gain/loss: +$6,939 (reported on 18.3% of returns)
Here:
+$6,939
State:
+$16,110
(% of AGI for various income ranges: 3.6% for AGIs below $10k, 0.7% for AGIs $10k-25k, 0.7% for AGIs $25k-50k, 0.7% for AGIs $50k-75k, 1.8% for AGIs $75k-100k, 7.0% for AGIs over 100k)
Profit/loss from business: +$8,790 (reported on 20.6% of returns)
Here:
+$8,790
State:
+$11,013
(% of AGI for various income ranges: -3.6% for AGIs below $10k, 6.6% for AGIs $10k-25k, 3.0% for AGIs $25k-50k, 3.0% for AGIs $50k-75k, 2.9% for AGIs $75k-100k, 6.1% for AGIs over 100k)
IRA payment deduction: $3,351 (reported on 1.6% of returns)
79015:
$3,351
Texas:
$3,120
(% of AGI for various income ranges: 0.1% for AGIs $10k-25k, 0.1% for AGIs $25k-50k, 0.2% for AGIs $50k-75k, 0.1% for AGIs $75k-100k, 0.1% for AGIs over 100k)
Self-employed pension: $17,409 (reported on 0.6% of returns)
Here:
$17,409
Texas:
$16,401
Total itemized deductions: $17,076 (21% of AGI, reported on 27.2% of returns)
Here:
$17,076
State:
$19,631
Here:
21.3% of AGI
State:
18.9% of AGI
(% of AGI for various income ranges: 17.9% for AGIs below $10k, 7.7% for AGIs $10k-25k, 9.9% for AGIs $25k-50k, 11.1% for AGIs $50k-75k, 12.3% for AGIs $75k-100k, 10.7% for AGIs over 100k)
Charity contributions deductions: $5,235 (6% of AGI, reported on 23.5% of returns)
Here:
$5,235
State:
$4,753
Here:
6.2% of AGI
State:
4.2% of AGI
(% of AGI for various income ranges: 1.3% for AGIs below $10k, 1.2% for AGIs $10k-25k, 2.0% for AGIs $25k-50k, 2.5% for AGIs $50k-75k, 3.3% for AGIs $75k-100k, 3.9% for AGIs over 100k)
Total tax: $6,414 (reported on 74.5% of returns)
79015:
$6,414
State:
$9,058
(% of AGI for various income ranges: 6.6% for AGIs below $10k, 4.2% for AGIs $10k-25k, 6.4% for AGIs $25k-50k, 8.5% for AGIs $50k-75k, 10.4% for AGIs $75k-100k, 18.0% for AGIs over 100k)
Earned income credit: $1,718 (reported on 14.4% of returns)
Here:
$1,718
State:
$2,024
Percentage of individuals using paid preparers for their 2004 taxes: 52.8%
Here:
53%
State:
57%
(% for various income ranges: 46.5% for AGIs below $10k, 51.8% for AGIs $10k-25k, 52.5% for AGIs $25k-50k, 52.5% for AGIs $50k-75k, 56.5% for AGIs $75k-100k, 69.7% for AGIs over 100k)
Household received Food Stamps/SNAP in the past 12 months: 474 Household did not receive Food Stamps/SNAP in the past 12 months: 7,951
Women who had a birth in the past 12 months: 309 (270 now married, 41 unmarried) Women who did not have a birth in the past 12 months: 5,591 (2,581 now married, 3,005 unmarried)
Housing units in zip code 79015 with a mortgage: 3,227 (90 second mortgage, 91 both second mortgage and home equity loan) Houses without a mortgage: 25
Median monthly owner costs for units with a mortgage: $1,881 Median monthly owner costs for units without a mortgage: $759
Residents with income below the poverty level in 2022:
This zip code:
12.3%
Whole state:
14.0%
Residents with income below 50% of the poverty level in 2022:
This zip code:
3.6%
Whole state:
7.4%
Median number of rooms in houses and condos:
Here:
6.6
State:
6.3
Median number of rooms in apartments:
Here:
4.3
State:
4.0
Notable locations in this zip code not listed on our city pages
Notable locations in zip code 79015: Cottonwood Trap Windmill (A), Currie Ranch (B), East Pasture Windmill (C), Flying Mare Ranch (D), Forrester Ranch (E), North Cottonwood Windmill (F), Oil Well Windmill (G), Reynolds Ranch (H), Schoolhouse Windmill (I), Seven B Ranch (J), South Pasture Windmill (K), Canyon Pumping Station (L), McSpadden Pumping Station (M), Nanace Ranch (N), Canyon City Club (O), L T Lester House (P), Canyon Fire Department Station 2 (Q), Panhandle-Plains Historical Museum (R), Canyon Fire Department Station 1 (S). Display/hide their locations on the map
Churches in zip code 79015 include: Grace Baptist Church (A), First Baptist Church of Canyon (B), Presbyterian Church of Canyon (C), United Pentecostal Church of Canyon (D), Saint Paul Lutheran Church (E), Saint Georges Episcopal Church (F), Church of Christ - University (G). Display/hide their locations on the map
Lakes and reservoirs: McSpadden Lake (A), Palo Duro Club Lake (B), Frog Lake (C), McSpadden Lake (D), Bivins Lake (E). Display/hide their locations on the map
Streams, rivers, and creeks: Tierra Blanca Creek (A), Sunday Creek (B), South Cita Creek (C), Spring Branch (D), Palo Duro Creek (E), Hackberry Creek (F), Dry Creek (G). Display/hide their locations on the map
Parks in zip code 79015 include: Southeast Park (1), Buffalo Stadium (2), Mesquite Park (3), Palo Duro State Park (4), Conner Park (5). Display/hide their locations on the map
3,742 married couples with children.
1,160 single-parent households (847 men, 313 women).
89.9% of residents of 79015 zip code speak English at home.
6.8% of residents speak Spanish at home (86% very well, 4% well, 7% not well, 3% not at all).
1.9% of residents speak other Indo-European language at home (94% very well, 6% well).
1.0% of residents speak Asian or Pacific Island language at home (86% very well, 14% well).
0.5% of residents speak other language at home (35% very well, 65% well).
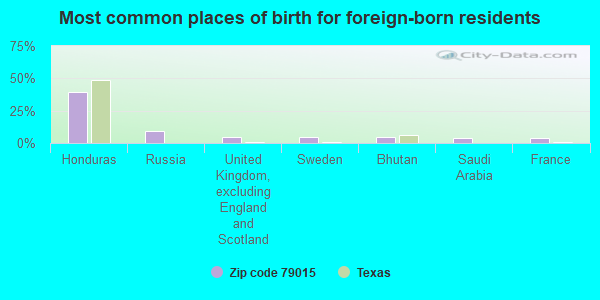
Foreign born population: 1,282 (5.5%) (25.7% of them are naturalized citizens)
This zip code:
5.5%
Whole state:
17.2%
39%Honduras
9%Russia
5%United Kingdom, excluding England and Scotland
4%Sweden
4%Bhutan
4%Saudi Arabia
4%France
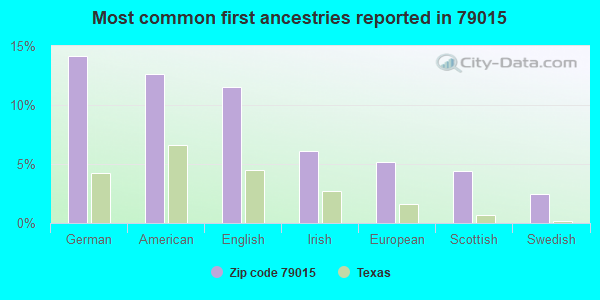
14%German
13%American
12%English
6%Irish
5%European
4%Scottish
2%Swedish
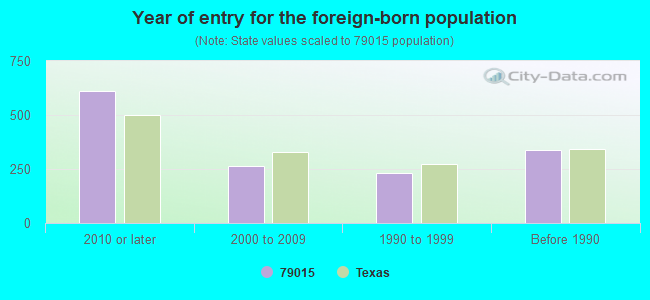
Year of entry for the foreign-born population
6122010 or later
2632000 to 2009
2301990 to 1999
340Before 1990
Facilities with environmental interests located in this zip code:
AGRI RESEARCH CENTER (16851 HOPE RD in CANYON, TX)
National Pollutant Discharge Elimination System NON-MAJOR (Tracking pollutant discharge elimination systems) - permit Business SIC classification: BEEF CATTLE FEEDLOTS Organizations: AGRI RESEARCH CENTER INC (CONTACT/OWNER)
Housing units lacking complete plumbing facilities: 2.2% Housing units lacking complete kitchen facilities: 4.0%
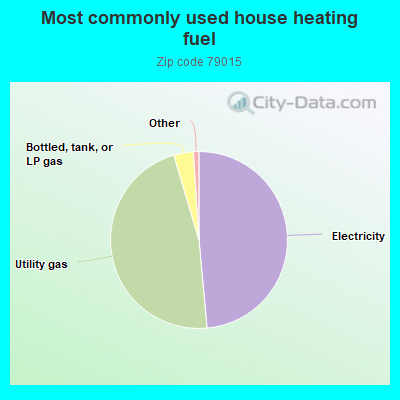
48.6%Electricity
46.9%Utility gas
3.6%Bottled, tank, or LP gas
Population in 1990: 14,389. Population change in the 1990s: +2,138 (+14.9%).
Place of birth for U.S.-born residents:
This state: 15,269
Northeast: 362
Midwest: 1,971
South: 1,995
West: 2,243
41% of the 79015 zip code residents lived in the same house 5 years ago. Out of people who lived in different houses, 44% lived in this county. Out of people who lived in different counties, 50% lived in Texas.
91% of the 79015 zip code residents lived in the same house 1 year ago. Out of people who lived in different houses, 49% moved from this county. Out of people who lived in different houses, 27% moved from different county within same state. Out of people who lived in different houses, 24% moved from different state. Out of people who lived in different houses, 2% moved from abroad.
Private vs. public school enrollment:
Students in private schools in grades 1 to 8 (elementary and middle school): 279
Here:
10.4%
Texas:
8.8%
Students in private schools in grades 9 to 12 (high school): 112
Here:
8.9%
Texas:
8.0%
Students in private undergraduate colleges: 143
Here:
5.7%
Texas:
16.2%
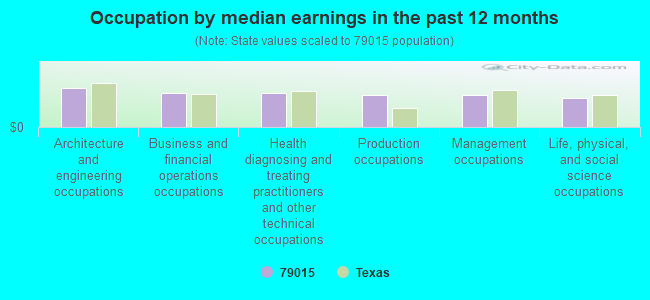
Occupation by median earnings in the past 12 months ($)
102,395Architecture and engineering occupations
90,694Business and financial operations occupations
90,275Health diagnosing and treating practitioners and other technical occupations
85,122Production occupations
84,373Management occupations
77,547Life, physical, and social science occupations
Companies with federal contracts located in this zip code:
ART CARE, INC (17 WINDY MEADOW LANE in CANYON, TX; small business) : $114,005 in 12 contractsfrom 2003 to 2005
Contracts for Lease or Rental of Facilities -- Restoration of real property, Construction of Structures and Facilities -- Restoration of real property, Restoration, Miscellaneous Fabricated Nonmetallic Materials, and moreby Army Signed by year:2000: $0; 2001: $0; 2002: $0; 2003: $38,495; 2004: $43,285; 2005: $32,225; 2006: $0.
Biggest contracts:
$38,035 with Army for Lease or Rental of Facilities -- Restoration of real property. Signed on 2004-05-17. Completion date: 2004-09-30.
$14,425 with Army for Construction of Structures and Facilities -- Restoration of real property. Signed on 2003-09-27. Completion date: 2003-12-05.
$12,350 with Army for Restoration. Signed on 2005-03-14. Completion date: 2006-01-31.
$11,525 with Army for Miscellaneous Fabricated Nonmetallic Materials. Signed on 2005-08-18. Completion date: 2005-10-21.
MC MAHAN SPORTS INC (2306 4TH AVE in CANYON, TX; small business) : $38,783 in 3 contractsfrom 2003 to 2004
$38,783 with Air Force for Athletic and Sporting Equipment. Taking place in CO. Signed on 2003-04-18. Completion date: 2003-04-30.
$12,900 with Army for Athletic and Sporting Equipment. Signed on 2004-05-25. Completion date: 2004-06-25.
-$12,900, same as above.Signed on 2004-06-02. Completion date: 2004-06-25.
Top industries in this zip code by the number of employees in 2005:
2002 - 2018 National Fire Incident Reporting System (NFIRS) incidents
Based on the data from the years 2002 - 2018 the average number of fire incidents per year is 108. The highest number of reported fire incidents - 165 took place in 2016, and the least - 68 in 2014. The data has a rising trend.
When looking into fire subcategories, the most incidents belonged to: Outside Fires (58.1%), and Structure Fires (22.2%).
Fire incident types reported to NFIRS in Zip Code 79015


 Nearest zip codes: 79016, 79042, 79119, 79110, 79091, 79109.
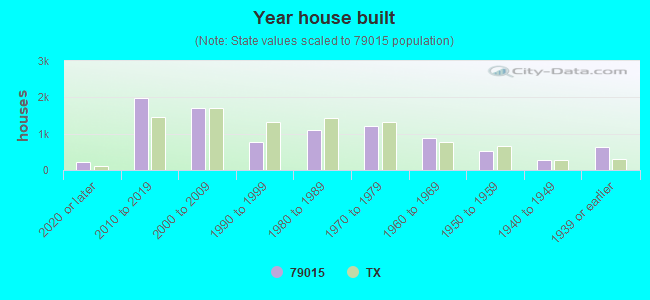


 Based on the data from the years 2002 - 2018 the average number of fire incidents per year is 108. The highest number of reported fire incidents - 165 took place in 2016, and the least - 68 in 2014. The data has a rising trend.
 When looking into fire subcategories, the most incidents belonged to: Outside Fires (58.1%), and Structure Fires (22.2%).