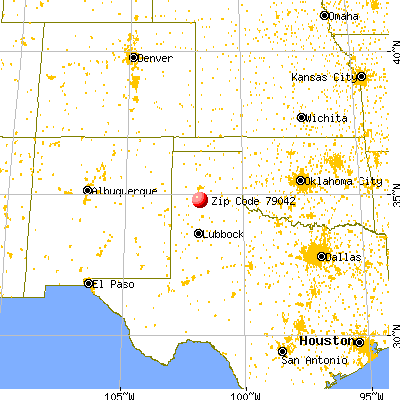
Estimated zip code population in 2022: 1,132 Zip code population in 2010: 1,169 Zip code population in 2000: 1,196
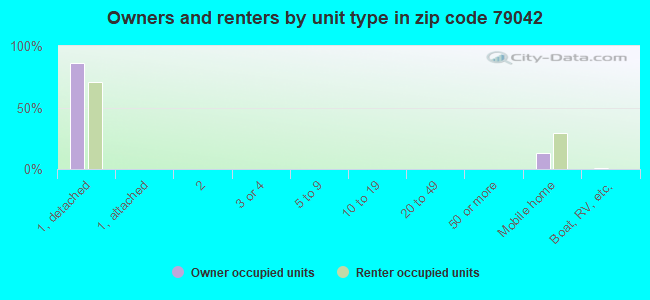
Houses and condos: 601 Renter-occupied apartments: 110
% of renters here:
25%
State:
38%
March 2022 cost of living index in zip code 79042: 78.9 (low, U.S. average is 100)
Land area: 429.0 sq. mi. Water area: 2.5 sq. mi.
Population density: 3 people per square mile
(very low).
OSM Map
General Map
Google Map
MSN Map
OSM Map
General Map
Google Map
MSN Map
OSM Map
General Map
Google Map
MSN Map
OSM Map
General Map
Google Map
MSN Map
Please wait while loading the map...
Real estate property taxes paid for housing units in 2022:
This zip code:
1.3% ($1,486)
Texas:
1.5% ($4,050)
Median real estate property taxes paid for housing units with mortgages in 2022: $2,115 (1.4%) Median real estate property taxes paid for housing units with no mortgage in 2022: $1,383 (1.2%)
Business Search- 14 Million verified businesses
Males: 571
(50.4%)
Females: 561
(49.6%)
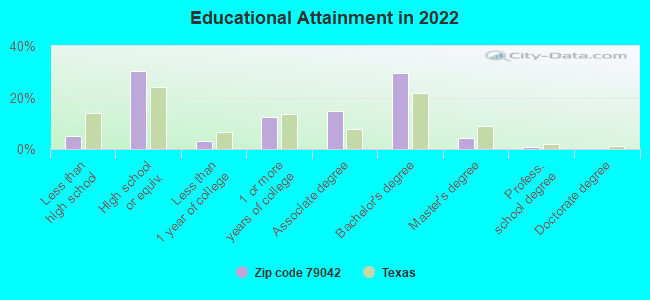
For population 25 years and over in 79042:
High school or higher: 94.7%
Bachelor's degree or higher: 34.4%
Graduate or professional degree: 5.0%
Unemployed: 0.7%
Mean travel time to work (commute): 24.8 minutes
For population 15 years and over in 79042:
Never married: 21.6%
Now married: 55.2%
Separated: 4.4%
Widowed: 8.2%
Divorced: 10.7%
Zip code 79042 compared to state average:
Median house value significantly below state average.
Unemployed percentage significantly below state average.
Black race population percentage significantly below state average.
Hispanic race population percentage below state average.
Median age below state average.
Foreign-born population percentage below state average.
Renting percentage below state average.
Length of stay since moving in significantly above state average.
Averages for the 2020 tax year for zip code 79042, filed in 2021:
Average Adjusted Gross Income (AGI) in 2020: $59,194 (Individual Income Tax Returns)
Here:
$59,194
State:
$77,054
Salary/wage: $54,153 (reported on 77.6% of returns)
Here:
$54,153
State:
$62,766
(% of AGI for various income ranges: 1625.6% for AGIs below $25k, 3733.8% for AGIs $25k-50k, 6774.3% for AGIs $50k-75k, 10320.0% for AGIs $75k-100k, 16580.0% for AGIs $100k-200k)
Taxable interest for individuals: $1,500 (reported on 32.7% of returns)
This zip code:
$1,500
Texas:
$2,665
(% of AGI for various income ranges: 16.7% for AGIs below $25k, 20.0% for AGIs $25k-50k, 30.0% for AGIs $50k-75k, 376.0% for AGIs $100k-200k)
Ordinary dividends: $2,267 (reported on 12.2% of returns)
Here:
$2,267
State:
$10,044
(% of AGI for various income ranges: 35.6% for AGIs below $25k, 346.7% for AGIs $75k-100k)
Net capital gain/loss in AGI: +$4,560 (reported on 10.2% of returns)
Here:
+$4,560
State:
+$39,590
(% of AGI for various income ranges: 21.1% for AGIs below $25k, 696.7% for AGIs $75k-100k)
Profit/loss from business: +$3,530 (reported on 20.4% of returns)
Here:
+$3,530
State:
+$10,888
(% of AGI for various income ranges: 187.8% for AGIs below $25k, 242.5% for AGIs $25k-50k)
Taxable individual retirement arrangement distribution: $8,175 (reported on 8.2% of returns)
79042:
$8,175
Texas:
$24,740
(% of AGI for various income ranges: 467.1% for AGIs $50k-75k)
Earned income credit: $2,557 (reported on 14.3% of returns)
Here:
$2,557
State:
$2,584
(% of AGI for various income ranges: 117.8% for AGIs below $25k, 91.2% for AGIs $25k-50k)
Percentage of individuals using paid preparers for their 2020 taxes: 87.8%
Here:
88%
State:
92%
(% for various income ranges: 86.7% for AGIs below $25k, 90.9% for AGIs $25k-50k, 80.0% for AGIs $50k-75k, 100.0% for AGIs $75k-100k, 87.5% for AGIs $100k-200k)
Averages for the 2012 tax year for zip code 79042, filed in 2013:
Average Adjusted Gross Income (AGI) in 2012: $49,043 (Individual Income Tax Returns)
Here:
$49,043
State:
$65,384
Salary/wage: $40,145 (reported on 77.6% of returns)
Here:
$40,145
State:
$52,524
(% of AGI for various income ranges: 70.0% for AGIs below $25k, 72.2% for AGIs $25k-50k, 82.2% for AGIs $50k-75k, 73.7% for AGIs $75k-100k, 43.2% for AGIs $100k-200k)
Taxable interest for individuals: $1,893 (reported on 28.6% of returns)
This zip code:
$1,893
Texas:
$2,372
(% of AGI for various income ranges: 1.2% for AGIs below $25k, 0.4% for AGIs $25k-50k, 0.7% for AGIs $50k-75k, 2.1% for AGIs $100k-200k)
Ordinary dividends: $1,817 (reported on 12.2% of returns)
Here:
$1,817
State:
$9,721
Net capital gain/loss in AGI: +$1,129 (reported on 14.3% of returns)
Here:
+$1,129
State:
+$35,319
Profit/loss from business: +$6,267 (reported on 24.5% of returns)
Here:
+$6,267
State:
+$13,732
(% of AGI for various income ranges: 14.5% for AGIs below $25k, 7.9% for AGIs $25k-50k, 2.3% for AGIs $75k-100k)
Taxable individual retirement arrangement distribution: $14,060 (reported on 10.2% of returns)
79042:
$14,060
Texas:
$19,511
Total itemized deductions: $20,800 (25% of AGI, reported on 16.3% of returns)
Here:
$20,800
State:
$24,724
Here:
25.0% of AGI
State:
15.9% of AGI
(% of AGI for various income ranges: 25.0% for AGIs below $25k, 13.1% for AGIs $50k-75k, 5.8% for AGIs $100k-200k)
Charity contributions: $6,250 (reported on 12.2% of returns)
Here:
$6,250
State:
$6,808
Taxes paid: $2,588 (reported on 16.3% of returns)
79042:
$2,588
State:
$6,921
(% of AGI for various income ranges: 2.3% for AGIs below $25k, 1.9% for AGIs $50k-75k, 0.8% for AGIs $100k-200k)
Earned income credit: $2,260 (reported on 20.4% of returns)
Here:
$2,260
State:
$2,570
(% of AGI for various income ranges: 7.4% for AGIs below $25k, 1.5% for AGIs $25k-50k)
Percentage of individuals using paid preparers for their 2012 taxes: 65.3%
Here:
65%
State:
51%
(% for various income ranges: 63.2% for AGIs below $25k, 66.7% for AGIs $25k-50k, 62.5% for AGIs $50k-75k, 60.0% for AGIs $75k-100k, 80.0% for AGIs $100k-200k)
Averages for the 2004 tax year for zip code 79042, filed in 2005:
Average Adjusted Gross Income (AGI) in 2004: $37,075 (Individual Income Tax Returns)
Here:
$37,075
State:
$47,881
Salary/wage: $29,589 (reported on 75.9% of returns)
Here:
$29,589
State:
$41,947
(% of AGI for various income ranges: 94.7% for AGIs below $10k, 65.5% for AGIs $10k-25k, 76.5% for AGIs $25k-50k, 71.5% for AGIs $50k-75k, 95.0% for AGIs $75k-100k)
Taxable interest for individuals: $2,172 (reported on 44.7% of returns)
This zip code:
$2,172
Texas:
$2,255
(% of AGI for various income ranges: 14.0% for AGIs below $10k, 5.9% for AGIs $10k-25k, 1.0% for AGIs $25k-50k, 1.3% for AGIs $50k-75k, 2.0% for AGIs $75k-100k, 4.0% for AGIs over 100k)
Taxable dividends: $1,209 (reported on 17.4% of returns)
Here:
$1,209
State:
$4,261
(% of AGI for various income ranges: 2.2% for AGIs below $10k, 0.6% for AGIs $10k-25k, 0.5% for AGIs $25k-50k, 0.7% for AGIs $50k-75k, 1.1% for AGIs $75k-100k)
Net capital gain/loss: +$1,701 (reported on 15.6% of returns)
Here:
+$1,701
State:
+$16,110
(% of AGI for various income ranges: 3.6% for AGIs below $10k, -0.4% for AGIs $10k-25k, 0.9% for AGIs $25k-50k, 0.7% for AGIs $50k-75k, 1.9% for AGIs $75k-100k)
Profit/loss from business: +$5,758 (reported on 18.4% of returns)
Here:
+$5,758
State:
+$11,013
Total itemized deductions: $16,417 (26% of AGI, reported on 14.6% of returns)
Here:
$16,417
State:
$19,631
Here:
26.5% of AGI
State:
18.9% of AGI
(% of AGI for various income ranges: 12.2% for AGIs $10k-25k, 6.3% for AGIs $25k-50k, 6.8% for AGIs $50k-75k, 13.6% for AGIs $75k-100k)
Charity contributions deductions: $4,661 (7% of AGI, reported on 11.3% of returns)
Here:
$4,661
State:
$4,753
Here:
6.8% of AGI
State:
4.2% of AGI
Total tax: $5,695 (reported on 70.4% of returns)
79042:
$5,695
State:
$9,058
(% of AGI for various income ranges: 4.1% for AGIs below $10k, 4.8% for AGIs $10k-25k, 5.9% for AGIs $25k-50k, 9.1% for AGIs $50k-75k, 11.7% for AGIs $75k-100k, 22.6% for AGIs over 100k)
Earned income credit: $1,582 (reported on 16.0% of returns)
Here:
$1,582
State:
$2,024
Percentage of individuals using paid preparers for their 2004 taxes: 65.8%
Here:
66%
State:
57%
(% for various income ranges: 63.6% for AGIs below $10k, 59.5% for AGIs $10k-25k, 64.1% for AGIs $25k-50k, 72.5% for AGIs $50k-75k, 76.9% for AGIs $75k-100k, 92.9% for AGIs over 100k)
Household received Food Stamps/SNAP in the past 12 months: 20 Household did not receive Food Stamps/SNAP in the past 12 months: 422
Women who had a birth in the past 12 months: 3 (3 now married, 0 unmarried) Women who did not have a birth in the past 12 months: 243 (129 now married, 113 unmarried)
Housing units in zip code 79042 with a mortgage: 118 Median monthly owner costs for units with a mortgage: $1,168 Median monthly owner costs for units without a mortgage: $387
Residents with income below the poverty level in 2022:
This zip code:
12.7%
Whole state:
14.0%
Residents with income below 50% of the poverty level in 2022:
This zip code:
8.9%
Whole state:
7.4%
Median number of rooms in houses and condos:
Here:
6.3
State:
6.3
Median number of rooms in apartments:
Here:
6.5
State:
4.0
Notable locations in this zip code not listed on our city pages
Notable locations in zip code 79042: Cita Canyon Methodist Camp (A), Cita Glen Christian Camp (B), Happy Hereford Ranch (C), Black Camp (D), Happy Volunteer Fire Department (E). Display/hide their locations on the map
Size of family households: 130 2-persons, 44 3-persons, 55 4-persons, 13 5-persons, 10 6-persons, 11 7-or-more-persons
Size of nonfamily households: 166 1-person, 14 2-persons
279 married couples with children.
47 single-parent households (13 men, 34 women).
85.0% of residents of 79042 zip code speak English at home.
14.8% of residents speak Spanish at home (86% very well, 2% well, 5% not well, 6% not at all).
0.1% of residents speak Asian or Pacific Island language at home (100% well).
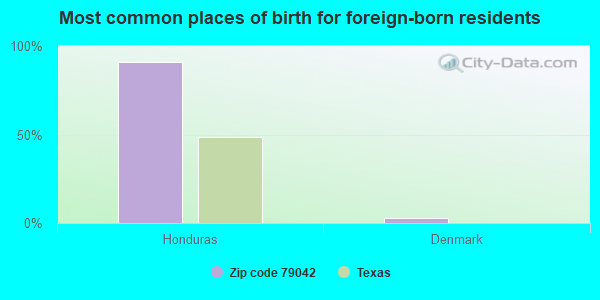
Foreign born population: 97 (8.6%) (25.9% of them are naturalized citizens)
This zip code:
8.6%
Whole state:
17.2%
91%Honduras
3%Denmark
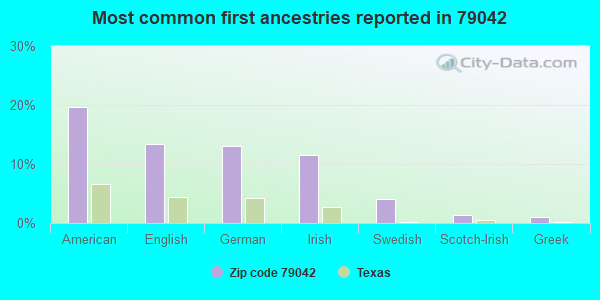
20%American
13%English
13%German
12%Irish
4%Swedish
1%Scotch-Irish
1%Greek
Year of entry for the foreign-born population
02010 or later
462000 to 2009
11990 to 1999
54Before 1990
Facilities with environmental interests located in this zip code:
AMERICAN TELEPHONE AND TELEGRAPH LONG DI (9.8 MI W NW L436270 in HAPPY, TX)
(Resource Conservation and Recovery Act (tracking hazardous waste)) Alternative names: AMERICAN TEL & TEL CO LONG LINES
Housing units lacking complete plumbing facilities: 10.4% Housing units lacking complete kitchen facilities: 13.6%
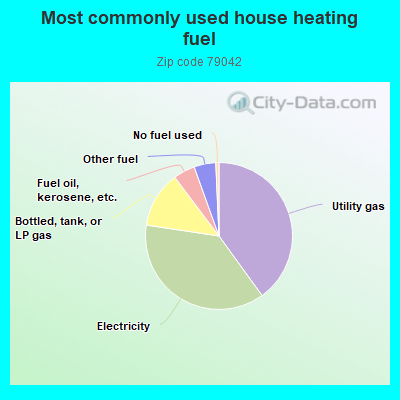
40.2%Utility gas
37.5%Electricity
12.4%Bottled, tank, or LP gas
4.8%Fuel oil, kerosene, etc.
4.8%Other fuel
0.7%No fuel used
Population in 1990: 839. Population change in the 1990s: +357 (+42.6%).
Place of birth for U.S.-born residents:
This state: 888
Midwest: 29
South: 47
West: 47
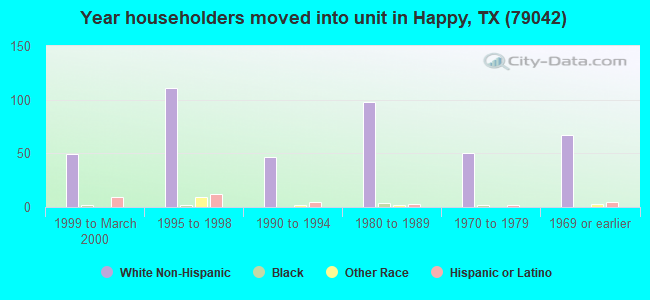
61% of the 79042 zip code residents lived in the same house 5 years ago. Out of people who lived in different houses, 45% lived in this county. Out of people who lived in different counties, 50% lived in Texas.
94% of the 79042 zip code residents lived in the same house 1 year ago. Out of people who lived in different houses, 32% moved from this county. Out of people who lived in different houses, 50% moved from different county within same state. Out of people who lived in different houses, 22% moved from different state.
Private vs. public school enrollment:
Students in private schools in grades 1 to 8 (elementary and middle school): 23
Here:
10.8%
Texas:
8.8%
Students in private schools in grades 9 to 12 (high school):
Here:
0.0%
Texas:
8.0%
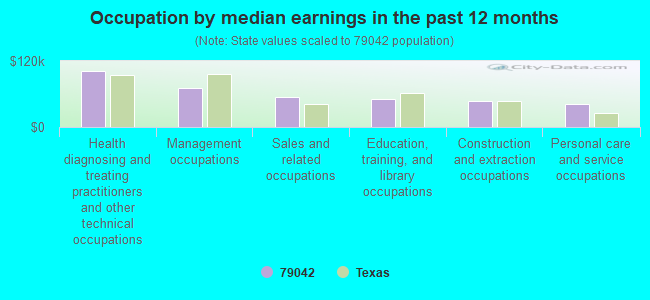
Occupation by median earnings in the past 12 months ($)
101,590Health diagnosing and treating practitioners and other technical occupations
70,564Management occupations
54,911Sales and related occupations
50,981Education, training, and library occupations
46,508Construction and extraction occupations
41,247Personal care and service occupations
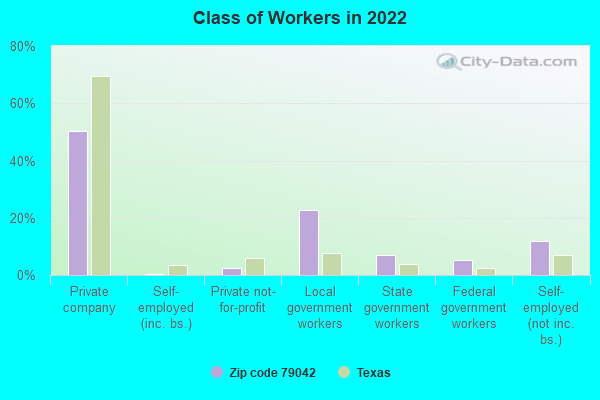
Top industries in this zip code by the number of employees in 2005:
Other Services (except Public Administration): Religious Organizations (20-49 employees: 1 establishment, 5-9 employees: 1 establishment, 1-4 employees: 1 establishment)
Wholesale Trade: Grain and Field Bean Merchant Wholesalers (5-9: 1, 1-4: 1)
Wholesale Trade: Other Electronic Parts and Equipment Merchant Wholesalers (1-4: 1)
Wholesale Trade: Metal Service Centers and Other Metal Merchant Wholesalers (1-4: 1)
Accommodation and Food Services: Full-Service Restaurants (1-4: 1)
Fatal accident statistics in 2014:
Fatal accident count: 2
Vehicles involved in fatal accidents: 4
Fatal accidents caused by drunken drivers: 2
Fatalities: 3
Persons involved in fatal accidents: 6
Pedestrians involved in fatal accidents: 0
Fatal accident statistics in 2013:
Fatal accident count: 1
Vehicles involved in fatal accidents: 1
Fatal accidents caused by drunken drivers: 1
Fatalities: 1
Persons involved in fatal accidents: 2
Pedestrians involved in fatal accidents: 0
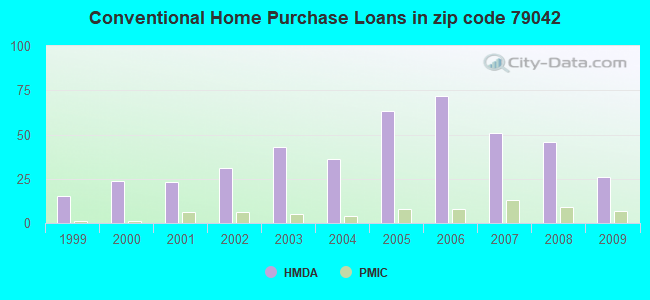
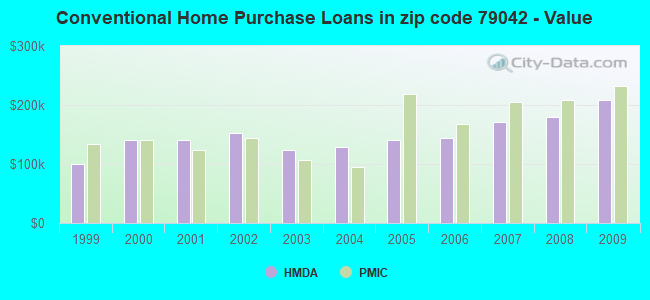
Home Mortgage Disclosure Act Aggregated Statistics For Year 2009 (Based on 2 partial tracts)
A) FHA, FSA/RHS & VA Home Purchase Loans
B) Conventional Home Purchase Loans
C) Refinancings
D) Home Improvement Loans
F) Non-occupant Loans on < 5 Family Dwellings (A B C & D)
G) Loans On Manufactured Home Dwelling (A B C & D)
Number
Average Value
Number
Average Value
Number
Average Value
Number
Average Value
Number
Average Value
Number
Average Value
LOANS ORIGINATED
17
$204,472
26
$208,525
63
$206,050
8
$34,569
6
$256,233
2
$82,200
APPLICATIONS APPROVED, NOT ACCEPTED
3
$284,447
5
$229,182
16
$161,350
0
$0
0
$0
1
$66,870
APPLICATIONS DENIED
3
$189,243
6
$172,292
15
$180,048
3
$14,397
0
$0
3
$77,090
APPLICATIONS WITHDRAWN
1
$73,140
3
$215,250
12
$156,735
0
$0
1
$84,990
2
$83,940
FILES CLOSED FOR INCOMPLETENESS
0
$0
0
$0
3
$222,217
0
$0
0
$0
0
$0
Aggregated Statistics For Year 2008 (Based on 2 partial tracts)
A) FHA, FSA/RHS & VA Home Purchase Loans
B) Conventional Home Purchase Loans
C) Refinancings
D) Home Improvement Loans
F) Non-occupant Loans on < 5 Family Dwellings (A B C & D)
G) Loans On Manufactured Home Dwelling (A B C & D)
Number
Average Value
Number
Average Value
Number
Average Value
Number
Average Value
Number
Average Value
Number
Average Value
LOANS ORIGINATED
8
$171,625
46
$180,086
42
$190,039
6
$75,930
9
$179,646
4
$70,182
APPLICATIONS APPROVED, NOT ACCEPTED
2
$126,085
7
$162,706
3
$168,810
0
$0
1
$145,590
1
$101,700
APPLICATIONS DENIED
2
$129,570
7
$158,924
10
$168,786
6
$87,192
1
$296,750
4
$60,952
APPLICATIONS WITHDRAWN
0
$0
2
$188,430
13
$198,745
2
$12,190
1
$144,200
1
$113,550
FILES CLOSED FOR INCOMPLETENESS
0
$0
0
$0
2
$500,505
1
$48,760
0
$0
0
$0
Aggregated Statistics For Year 2007 (Based on 2 partial tracts)
A) FHA, FSA/RHS & VA Home Purchase Loans
B) Conventional Home Purchase Loans
C) Refinancings
D) Home Improvement Loans
F) Non-occupant Loans on < 5 Family Dwellings (A B C & D)
G) Loans On Manufactured Home Dwelling (A B C & D)
Number
Average Value
Number
Average Value
Number
Average Value
Number
Average Value
Number
Average Value
Number
Average Value
LOANS ORIGINATED
9
$161,766
51
$170,394
31
$177,611
12
$38,603
9
$195,126
6
$48,762
APPLICATIONS APPROVED, NOT ACCEPTED
1
$62,690
12
$117,899
4
$129,568
1
$34,830
0
$0
3
$40,637
APPLICATIONS DENIED
3
$110,063
15
$123,763
10
$164,607
10
$48,205
3
$130,033
7
$82,497
APPLICATIONS WITHDRAWN
1
$132,350
2
$138,275
10
$140,713
1
$80,810
3
$62,693
0
$0
FILES CLOSED FOR INCOMPLETENESS
0
$0
1
$315,560
3
$194,817
0
$0
0
$0
0
$0
Aggregated Statistics For Year 2006 (Based on 2 partial tracts)
A) FHA, FSA/RHS & VA Home Purchase Loans
B) Conventional Home Purchase Loans
C) Refinancings
D) Home Improvement Loans
F) Non-occupant Loans on < 5 Family Dwellings (A B C & D)
G) Loans On Manufactured Home Dwelling (A B C & D)
Number
Average Value
Number
Average Value
Number
Average Value
Number
Average Value
Number
Average Value
Number
Average Value
LOANS ORIGINATED
6
$138,855
72
$143,635
29
$145,205
9
$28,406
8
$165,355
6
$77,672
APPLICATIONS APPROVED, NOT ACCEPTED
1
$219,430
10
$149,212
6
$131,657
1
$57,820
1
$334,370
3
$44,117
APPLICATIONS DENIED
2
$107,625
13
$112,903
15
$119,351
7
$36,323
1
$68,960
7
$77,124
APPLICATIONS WITHDRAWN
1
$119,820
4
$229,355
13
$146,072
2
$64,435
0
$0
1
$100,310
FILES CLOSED FOR INCOMPLETENESS
0
$0
2
$132,700
7
$167,681
1
$17,410
0
$0
0
$0
Aggregated Statistics For Year 2005 (Based on 2 partial tracts)
A) FHA, FSA/RHS & VA Home Purchase Loans
B) Conventional Home Purchase Loans
C) Refinancings
D) Home Improvement Loans
F) Non-occupant Loans on < 5 Family Dwellings (A B C & D)
G) Loans On Manufactured Home Dwelling (A B C & D)
Number
Average Value
Number
Average Value
Number
Average Value
Number
Average Value
Number
Average Value
Number
Average Value
LOANS ORIGINATED
4
$133,400
63
$141,509
31
$145,342
12
$49,749
9
$122,757
6
$62,810
APPLICATIONS APPROVED, NOT ACCEPTED
0
$0
7
$137,629
5
$111,456
1
$3,480
1
$30,650
2
$46,325
APPLICATIONS DENIED
2
$113,200
18
$84,559
19
$115,379
6
$48,530
3
$90,093
8
$67,919
APPLICATIONS WITHDRAWN
0
$0
2
$134,445
8
$130,264
3
$137,463
0
$0
0
$0
FILES CLOSED FOR INCOMPLETENESS
0
$0
3
$78,947
13
$131,818
0
$0
1
$97,520
0
$0
Aggregated Statistics For Year 2004 (Based on 2 partial tracts)
A) FHA, FSA/RHS & VA Home Purchase Loans
B) Conventional Home Purchase Loans
C) Refinancings
D) Home Improvement Loans
F) Non-occupant Loans on < 5 Family Dwellings (A B C & D)
G) Loans On Manufactured Home Dwelling (A B C & D)
Number
Average Value
Number
Average Value
Number
Average Value
Number
Average Value
Number
Average Value
Number
Average Value
LOANS ORIGINATED
6
$103,097
36
$129,645
36
$135,798
4
$46,672
4
$142,802
6
$61,068
APPLICATIONS APPROVED, NOT ACCEPTED
1
$55,730
8
$159,521
10
$145,520
1
$18,110
0
$0
1
$18,110
APPLICATIONS DENIED
1
$67,570
15
$89,769
22
$104,870
6
$35,875
1
$35,530
8
$54,944
APPLICATIONS WITHDRAWN
0
$0
1
$377,560
26
$115,877
3
$48,530
1
$76,630
0
$0
FILES CLOSED FOR INCOMPLETENESS
0
$0
1
$107,970
6
$105,303
0
$0
1
$93,340
0
$0
Aggregated Statistics For Year 2003 (Based on 2 partial tracts)
A) FHA, FSA/RHS & VA Home Purchase Loans
B) Conventional Home Purchase Loans
C) Refinancings
D) Home Improvement Loans
F) Non-occupant Loans on < 5 Family Dwellings (A B C & D)
Number
Average Value
Number
Average Value
Number
Average Value
Number
Average Value
Number
Average Value
LOANS ORIGINATED
6
$112,037
43
$122,958
79
$135,308
4
$56,600
9
$147,370
APPLICATIONS APPROVED, NOT ACCEPTED
0
$0
9
$94,196
4
$132,180
1
$68,960
1
$134,440
APPLICATIONS DENIED
3
$99,380
6
$76,045
26
$124,102
5
$21,456
5
$109,226
APPLICATIONS WITHDRAWN
0
$0
3
$146,517
14
$106,928
1
$15,330
1
$51,550
FILES CLOSED FOR INCOMPLETENESS
0
$0
1
$139,320
3
$131,193
0
$0
0
$0
Aggregated Statistics For Year 2002 (Based on 2 partial tracts)
A) FHA, FSA/RHS & VA Home Purchase Loans
B) Conventional Home Purchase Loans
C) Refinancings
D) Home Improvement Loans
F) Non-occupant Loans on < 5 Family Dwellings (A B C & D)
Number
Average Value
Number
Average Value
Number
Average Value
Number
Average Value
Number
Average Value
LOANS ORIGINATED
3
$115,403
31
$152,937
58
$129,544
8
$58,601
9
$141,564
APPLICATIONS APPROVED, NOT ACCEPTED
1
$162,310
6
$95,087
3
$154,180
3
$55,030
0
$0
APPLICATIONS DENIED
1
$208,280
5
$77,322
11
$71,180
1
$29,260
1
$16,720
APPLICATIONS WITHDRAWN
0
$0
1
$330,190
9
$102,478
0
$0
0
$0
FILES CLOSED FOR INCOMPLETENESS
0
$0
1
$181,810
4
$149,248
0
$0
1
$236,840
Aggregated Statistics For Year 2001 (Based on 2 partial tracts)
A) FHA, FSA/RHS & VA Home Purchase Loans
B) Conventional Home Purchase Loans
C) Refinancings
D) Home Improvement Loans
F) Non-occupant Loans on < 5 Family Dwellings (A B C & D)
Number
Average Value
Number
Average Value
Number
Average Value
Number
Average Value
Number
Average Value
LOANS ORIGINATED
5
$95,852
23
$139,835
41
$119,441
8
$30,650
5
$161,054
APPLICATIONS APPROVED, NOT ACCEPTED
1
$25,080
3
$95,203
5
$145,868
1
$63,390
1
$263,310
APPLICATIONS DENIED
1
$31,350
17
$56,056
10
$94,250
1
$10,450
2
$120,860
APPLICATIONS WITHDRAWN
1
$84,290
2
$169,620
8
$119,292
1
$2,090
1
$76,630
FILES CLOSED FOR INCOMPLETENESS
0
$0
0
$0
3
$71,517
0
$0
0
$0
Aggregated Statistics For Year 2000 (Based on 2 partial tracts)
A) FHA, FSA/RHS & VA Home Purchase Loans
B) Conventional Home Purchase Loans
C) Refinancings
D) Home Improvement Loans
F) Non-occupant Loans on < 5 Family Dwellings (A B C & D)
Number
Average Value
Number
Average Value
Number
Average Value
Number
Average Value
Number
Average Value
LOANS ORIGINATED
5
$92,648
24
$140,975
18
$146,324
2
$28,560
1
$67,570
APPLICATIONS APPROVED, NOT ACCEPTED
0
$0
7
$102,997
3
$76,627
0
$0
1
$26,470
APPLICATIONS DENIED
1
$59,210
16
$70,008
3
$47,600
1
$13,930
2
$35,525
APPLICATIONS WITHDRAWN
2
$88,815
4
$166,140
1
$55,730
1
$168,580
0
$0
FILES CLOSED FOR INCOMPLETENESS
0
$0
0
$0
1
$155,340
0
$0
0
$0
Aggregated Statistics For Year 1999 (Based on 1 partial tract)
A) FHA, FSA/RHS & VA Home Purchase Loans
B) Conventional Home Purchase Loans
C) Refinancings
D) Home Improvement Loans
F) Non-occupant Loans on < 5 Family Dwellings (A B C & D)


 Nearest zip codes: 79015, 79016, 79088, 79091, 79063, 79025.