Estimated zip code population in 2022: 2,473 Zip code population in 2010: 2,646 Zip code population in 2000: 2,796
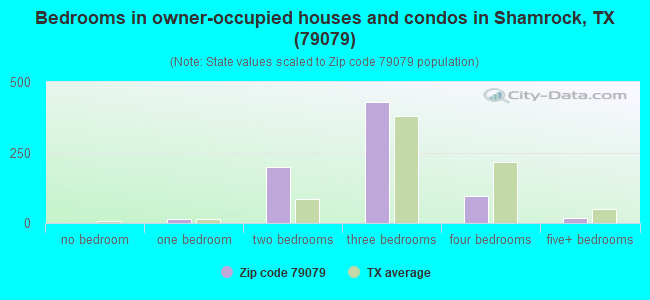
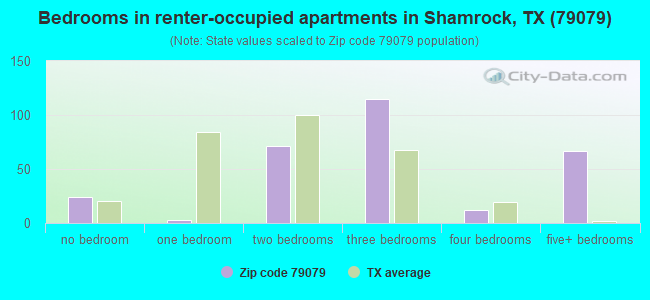
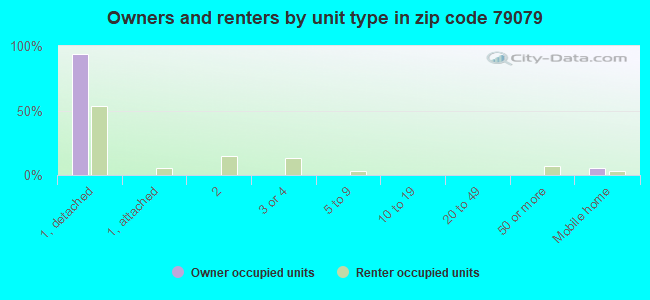
Houses and condos: 1,530 Renter-occupied apartments: 292
% of renters here:
28%
State:
38%
March 2022 cost of living index in zip code 79079: 78.3 (low, U.S. average is 100)
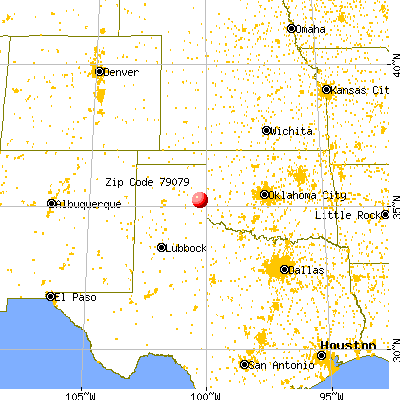
Land area: 535.7 sq. mi. Water area: 0.2 sq. mi.
Population density: 5 people per square mile
(very low).
OSM Map
General Map
Google Map
MSN Map
OSM Map
General Map
Google Map
MSN Map
OSM Map
General Map
Google Map
MSN Map
OSM Map
General Map
Google Map
MSN Map
Please wait while loading the map...
Real estate property taxes paid for housing units in 2022:
This zip code:
1.3% ($1,303)
Texas:
1.5% ($4,050)
Median real estate property taxes paid for housing units with mortgages in 2022: $1,412 (1.4%) Median real estate property taxes paid for housing units with no mortgage in 2022: $1,280 (1.6%)
Business Search- 14 Million verified businesses
Males: 1,264
(51.1%)
Females: 1,209
(48.9%)
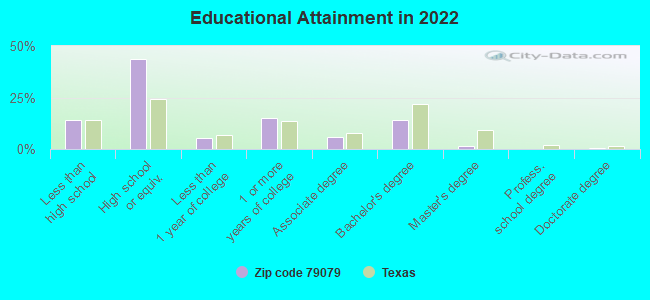
For population 25 years and over in 79079:
High school or higher: 83.9%
Bachelor's degree or higher: 15.8%
Graduate or professional degree: 2.2%
Unemployed: 6.1%
Mean travel time to work (commute): 25.1 minutes
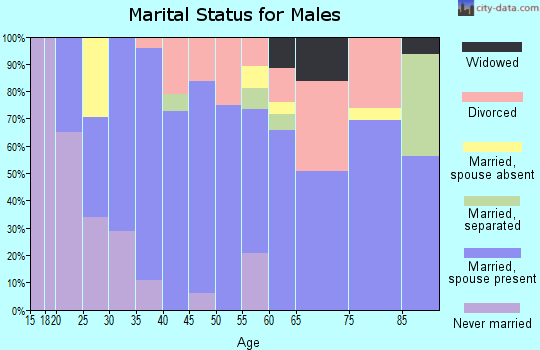
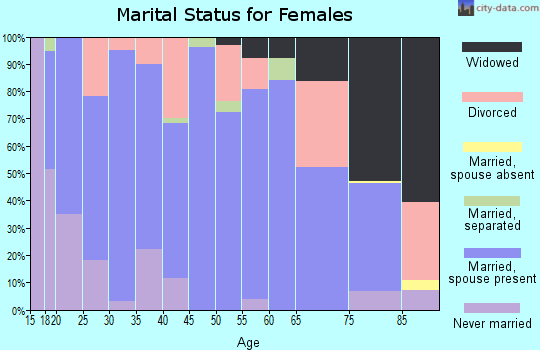
For population 15 years and over in 79079:
Never married: 19.8%
Now married: 59.7%
Separated: 0.0%
Widowed: 6.8%
Divorced: 13.7%
Zip code 79079 compared to state average:
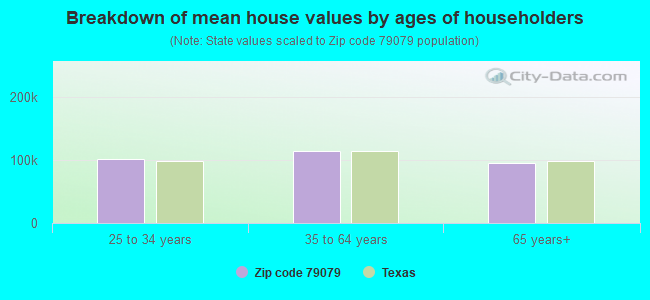
Median house value significantly below state average.
Black race population percentage significantly below state average.
Foreign-born population percentage below state average.
Length of stay since moving in significantly above state average.
House age above state average.
Number of college students significantly below state average.
Percentage of population with a bachelor's degree or higher below state average.
Averages for the 2020 tax year for zip code 79079, filed in 2021:
Average Adjusted Gross Income (AGI) in 2020: $50,797 (Individual Income Tax Returns)
Here:
$50,797
State:
$77,054
Salary/wage: $45,740 (reported on 77.7% of returns)
Here:
$45,740
State:
$62,766
(% of AGI for various income ranges: 1200.0% for AGIs below $25k, 3695.6% for AGIs $25k-50k, 6775.5% for AGIs $50k-75k, 9594.0% for AGIs $75k-100k, 20128.6% for AGIs $100k-200k)
Taxable interest for individuals: $1,219 (reported on 25.2% of returns)
This zip code:
$1,219
Texas:
$2,665
(% of AGI for various income ranges: 14.0% for AGIs below $25k, 22.2% for AGIs $25k-50k, 30.0% for AGIs $50k-75k, 288.6% for AGIs $100k-200k)
Ordinary dividends: $2,123 (reported on 12.6% of returns)
Here:
$2,123
State:
$10,044
(% of AGI for various income ranges: 10.3% for AGIs below $25k, 26.1% for AGIs $25k-50k, 58.2% for AGIs $50k-75k, 191.4% for AGIs $100k-200k)
Net capital gain/loss in AGI: +$16,092 (reported on 11.7% of returns)
Here:
+$16,092
State:
+$39,590
(% of AGI for various income ranges: 5.7% for AGIs below $25k, 73.9% for AGIs $25k-50k, 55.5% for AGIs $50k-75k, 2457.1% for AGIs $100k-200k)
Profit/loss from business: +$6,023 (reported on 21.4% of returns)
Here:
+$6,023
State:
+$10,888
(% of AGI for various income ranges: 137.0% for AGIs below $25k, 176.7% for AGIs $25k-50k, 55.5% for AGIs $50k-75k, 292.0% for AGIs $75k-100k, 555.7% for AGIs $100k-200k)
Taxable individual retirement arrangement distribution: $14,956 (reported on 8.7% of returns)
79079:
$14,956
Texas:
$24,740
(% of AGI for various income ranges: 83.3% for AGIs below $25k, 186.4% for AGIs $50k-75k, 1272.9% for AGIs $100k-200k)
Total itemized deductions: $42,925 (reported on 3.9% of returns)
Here:
$42,925
State:
$40,428
(% of AGI for various income ranges: 2452.9% for AGIs $100k-200k)
Charity contributions: $10,050 (reported on 1.9% of returns)
Here:
$10,050
State:
$18,201
(% of AGI for various income ranges: 182.7% for AGIs $50k-75k)
Taxes paid: $3,750 (reported on 3.9% of returns)
79079:
$3,750
State:
$7,821
(% of AGI for various income ranges: 214.3% for AGIs $100k-200k)
Earned income credit: $2,714 (reported on 21.4% of returns)
Here:
$2,714
State:
$2,584
(% of AGI for various income ranges: 141.7% for AGIs below $25k, 95.6% for AGIs $25k-50k)
Percentage of individuals using paid preparers for their 2020 taxes: 92.2%
Here:
92%
State:
92%
(% for various income ranges: 92.9% for AGIs below $25k, 91.7% for AGIs $25k-50k, 93.3% for AGIs $50k-75k, 100.0% for AGIs $75k-100k, 83.3% for AGIs $100k-200k, 100.0% for AGIs over 200k)
Averages for the 2012 tax year for zip code 79079, filed in 2013:
Average Adjusted Gross Income (AGI) in 2012: $55,809 (Individual Income Tax Returns)
Here:
$55,809
State:
$65,384
Salary/wage: $43,866 (reported on 82.1% of returns)
Here:
$43,866
State:
$52,524
(% of AGI for various income ranges: 75.1% for AGIs below $25k, 84.9% for AGIs $25k-50k, 88.5% for AGIs $50k-75k, 78.4% for AGIs $75k-100k, 86.6% for AGIs $100k-200k)
Taxable interest for individuals: $1,234 (reported on 24.8% of returns)
This zip code:
$1,234
Texas:
$2,372
(% of AGI for various income ranges: 1.5% for AGIs below $25k, 0.3% for AGIs $25k-50k, 0.2% for AGIs $50k-75k, 0.6% for AGIs $75k-100k, 0.6% for AGIs $100k-200k, 0.6% for AGIs over 200k)
Ordinary dividends: $2,930 (reported on 8.5% of returns)
Here:
$2,930
State:
$9,721
(% of AGI for various income ranges: 0.8% for AGIs below $25k, 0.6% for AGIs $50k-75k, 1.3% for AGIs $100k-200k)
Net capital gain/loss in AGI: +$18,290 (reported on 8.5% of returns)
Here:
+$18,290
State:
+$35,319
(% of AGI for various income ranges: 1.2% for AGIs below $25k, 1.2% for AGIs $50k-75k, 12.3% for AGIs $100k-200k)
Profit/loss from business: +$11,504 (reported on 22.2% of returns)
Here:
+$11,504
State:
+$13,732
(% of AGI for various income ranges: 9.3% for AGIs below $25k, 3.5% for AGIs $25k-50k, 2.6% for AGIs $50k-75k, 2.7% for AGIs $75k-100k, 11.9% for AGIs $100k-200k)
Taxable individual retirement arrangement distribution: $13,829 (reported on 6.0% of returns)
79079:
$13,829
Texas:
$19,511
Total itemized deductions: $23,282 (19% of AGI, reported on 14.5% of returns)
Here:
$23,282
State:
$24,724
Here:
19.5% of AGI
State:
15.9% of AGI
(% of AGI for various income ranges: 7.1% for AGIs below $25k, 6.3% for AGIs $25k-50k, 10.6% for AGIs $50k-75k, 12.3% for AGIs $100k-200k)
Charity contributions: $8,390 (reported on 8.5% of returns)
Here:
$8,390
State:
$6,808
(% of AGI for various income ranges: 2.9% for AGIs below $25k, 1.4% for AGIs $50k-75k, 3.8% for AGIs $100k-200k)
Taxes paid: $2,388 (reported on 14.5% of returns)
79079:
$2,388
State:
$6,921
(% of AGI for various income ranges: 0.5% for AGIs below $25k, 0.5% for AGIs $25k-50k, 1.1% for AGIs $50k-75k, 1.5% for AGIs $100k-200k)
Earned income credit: $2,208 (reported on 22.2% of returns)
Here:
$2,208
State:
$2,570
(% of AGI for various income ranges: 8.6% for AGIs below $25k, 1.0% for AGIs $25k-50k)
Percentage of individuals using paid preparers for their 2012 taxes: 65.0%
Here:
65%
State:
51%
(% for various income ranges: 60.0% for AGIs below $25k, 60.7% for AGIs $25k-50k, 70.0% for AGIs $50k-75k, 63.6% for AGIs $75k-100k, 80.0% for AGIs $100k-200k, 100.0% for AGIs over 200k)
Averages for the 2004 tax year for zip code 79079, filed in 2005:
Average Adjusted Gross Income (AGI) in 2004: $32,097 (Individual Income Tax Returns)
Here:
$32,097
State:
$47,881
Salary/wage: $27,846 (reported on 79.2% of returns)
Here:
$27,846
State:
$41,947
(% of AGI for various income ranges: 88.1% for AGIs below $10k, 78.3% for AGIs $10k-25k, 79.4% for AGIs $25k-50k, 73.9% for AGIs $50k-75k, 69.3% for AGIs $75k-100k, 39.9% for AGIs over 100k)
Taxable interest for individuals: $2,108 (reported on 35.9% of returns)
This zip code:
$2,108
Texas:
$2,255
(% of AGI for various income ranges: 5.1% for AGIs below $10k, 1.8% for AGIs $10k-25k, 2.2% for AGIs $25k-50k, 1.1% for AGIs $50k-75k, 1.4% for AGIs $75k-100k, 4.0% for AGIs over 100k)
Taxable dividends: $1,567 (reported on 13.4% of returns)
Here:
$1,567
State:
$4,261
(% of AGI for various income ranges: 0.4% for AGIs below $10k, 0.3% for AGIs $10k-25k, 0.7% for AGIs $25k-50k, 0.3% for AGIs $50k-75k, 0.1% for AGIs $75k-100k, 1.5% for AGIs over 100k)
Net capital gain/loss: +$5,068 (reported on 14.0% of returns)
Here:
+$5,068
State:
+$16,110
(% of AGI for various income ranges: -0.8% for AGIs below $10k, 1.1% for AGIs $10k-25k, 0.6% for AGIs $25k-50k, -0.1% for AGIs $50k-75k, 1.2% for AGIs $75k-100k, 8.2% for AGIs over 100k)
Profit/loss from business: +$6,352 (reported on 20.8% of returns)
Here:
+$6,352
State:
+$11,013
(% of AGI for various income ranges: 11.0% for AGIs below $10k, 6.3% for AGIs $10k-25k, 4.4% for AGIs $25k-50k, 0.5% for AGIs $50k-75k, -0.1% for AGIs $75k-100k, 6.2% for AGIs over 100k)
IRA payment deduction: $3,231 (reported on 2.5% of returns)
79079:
$3,231
Texas:
$3,120
Total itemized deductions: $18,152 (29% of AGI, reported on 12.5% of returns)
Here:
$18,152
State:
$19,631
Here:
29.0% of AGI
State:
18.9% of AGI
(% of AGI for various income ranges: 5.8% for AGIs $10k-25k, 7.3% for AGIs $25k-50k, 7.7% for AGIs $50k-75k, 7.0% for AGIs $75k-100k, 8.5% for AGIs over 100k)
Charity contributions deductions: $5,952 (9% of AGI, reported on 9.9% of returns)
Here:
$5,952
State:
$4,753
Here:
9.1% of AGI
State:
4.2% of AGI
(% of AGI for various income ranges: 0.8% for AGIs $10k-25k, 1.6% for AGIs $25k-50k, 1.6% for AGIs $50k-75k, 3.3% for AGIs $75k-100k, 2.6% for AGIs over 100k)
Total tax: $4,701 (reported on 67.8% of returns)
79079:
$4,701
State:
$9,058
(% of AGI for various income ranges: 3.1% for AGIs below $10k, 3.9% for AGIs $10k-25k, 6.3% for AGIs $25k-50k, 9.2% for AGIs $50k-75k, 12.5% for AGIs $75k-100k, 19.4% for AGIs over 100k)
Earned income credit: $1,953 (reported on 22.3% of returns)
Here:
$1,953
State:
$2,024
Percentage of individuals using paid preparers for their 2004 taxes: 76.0%
Here:
76%
State:
57%
(% for various income ranges: 70.4% for AGIs below $10k, 75.6% for AGIs $10k-25k, 77.5% for AGIs $25k-50k, 82.4% for AGIs $50k-75k, 75.5% for AGIs $75k-100k, 91.3% for AGIs over 100k)
Household received Food Stamps/SNAP in the past 12 months: 232 Household did not receive Food Stamps/SNAP in the past 12 months: 821
Women who had a birth in the past 12 months: 24 (25 now married, 0 unmarried) Women who did not have a birth in the past 12 months: 576 (246 now married, 330 unmarried)
Housing units in zip code 79079 with a mortgage: 245 (1 second mortgage, 2 both second mortgage and home equity loan) Median monthly owner costs for units with a mortgage: $1,160 Median monthly owner costs for units without a mortgage: $403
Residents with income below the poverty level in 2022:
This zip code:
23.1%
Whole state:
14.0%
Residents with income below 50% of the poverty level in 2022:
This zip code:
18.4%
Whole state:
7.4%
Median number of rooms in houses and condos:
Here:
5.8
State:
6.3
Median number of rooms in apartments:
Here:
5.1
State:
4.0
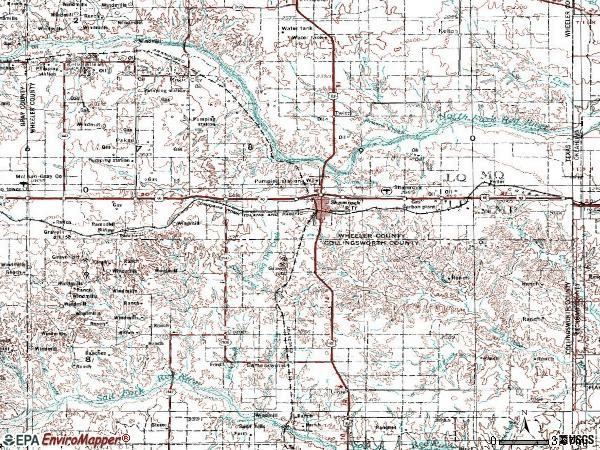
Notable locations in this zip code not listed on our city pages
Notable locations in zip code 79079: Sam Norwood Volunteer Fire Department (A), Shamrock Volunteer Fire Department (B), Wheeler County Ambulance Service (C), Pioneer West Museum (D), Tower Station (E). Display/hide their locations on the map
Churches in zip code 79079 include: Bethel Church (A), Lone Mound Church (B), Saint Michaels All Angels Episcopal Church (C), Church of God (D), Westside Church of Christ (E), Saint Patricks Catholic Church (F), First Baptist Church (G). Display/hide their locations on the map
Creeks: Bronco Creek (A), Sandy Creek (B), Sand Creek (C), Roundup Creek (D), Raven Creek (E), Long Dry Creek (F), Lake Creek (G), Hackberry Creek (H), Gyp Creek (I). Display/hide their locations on the map
Size of family households: 282 2-persons, 201 3-persons, 91 4-persons, 75 5-persons, 120 6-persons
Size of nonfamily households: 265 1-person, 8 2-persons
401 married couples with children.
53 single-parent households (40 men, 13 women).
80.9% of residents of 79079 zip code speak English at home.
17.9% of residents speak Spanish at home (47% very well, 22% well, 27% not well, 4% not at all).
0.4% of residents speak other Indo-European language at home (100% very well).
0.3% of residents speak other language at home (100% very well).
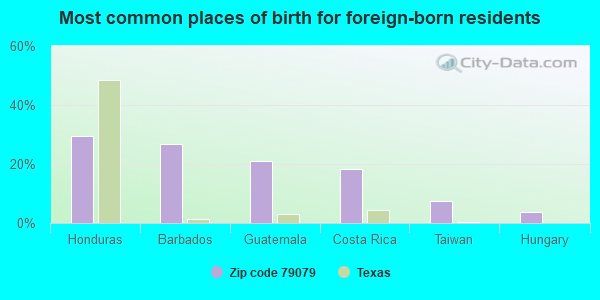
Foreign born population: 217 (8.8%) (10.6% of them are naturalized citizens)
This zip code:
8.8%
Whole state:
17.2%
29%Honduras
27%Barbados
21%Guatemala
18%Costa Rica
8%Taiwan
4%Hungary
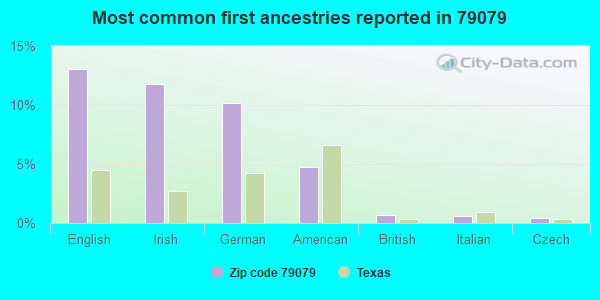
13%English
12%Irish
10%German
5%American
1%British
1%Italian
0%Czech
Year of entry for the foreign-born population
1602010 or later
362000 to 2009
551990 to 1999
31Before 1990
Housing units lacking complete plumbing facilities: 11.3% Housing units lacking complete kitchen facilities: 11.5%
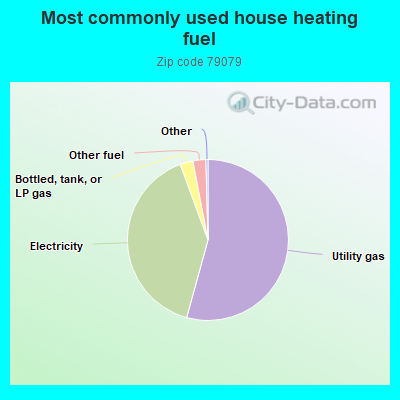
54.4%Utility gas
40.2%Electricity
2.6%Bottled, tank, or LP gas
2.6%Other fuel
Population in 1990: 2,927.
Place of birth for U.S.-born residents:
This state: 1,595
Midwest: 176
South: 220
West: 210
58% of the 79079 zip code residents lived in the same house 5 years ago. Out of people who lived in different houses, 40% lived in this county. Out of people who lived in different counties, 50% lived in Texas.
90% of the 79079 zip code residents lived in the same house 1 year ago. Out of people who lived in different houses, 44% moved from this county. Out of people who lived in different houses, 27% moved from different county within same state. Out of people who lived in different houses, 31% moved from different state.
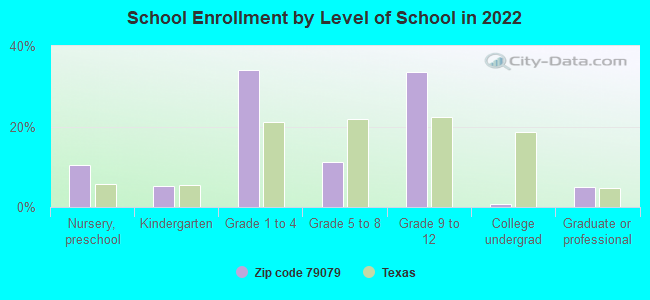
Private vs. public school enrollment:
Students in private schools in grades 1 to 8 (elementary and middle school): 22
Here:
9.8%
Texas:
8.8%
Students in private schools in grades 9 to 12 (high school): 5
Here:
3.2%
Texas:
8.0%
Students in private undergraduate colleges:
Here:
0.0%
Texas:
16.2%
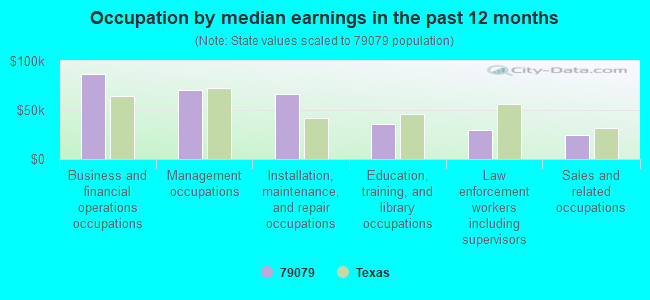
Occupation by median earnings in the past 12 months ($)
87,141Business and financial operations occupations
69,945Management occupations
66,144Installation, maintenance, and repair occupations
35,649Education, training, and library occupations
29,542Law enforcement workers including supervisors
24,882Sales and related occupations
Top industries in this zip code by the number of employees in 2005:
Wholesale Trade: Grain and Field Bean Merchant Wholesalers (20-49: 1)
Mining: Crude Petroleum and Natural Gas Extraction (10-19: 1, 5-9: 1, 1-4: 2)
Mining: Support Activities for Oil and Gas Operations (10-19: 1, 1-4: 3)
Finance and Insurance: Insurance Agencies and Brokerages (10-19: 1, 1-4: 1)
People in group quarters in 2000:
46 people in nursing homes
Fatal accident statistics in 2014:
Fatal accident count: 2
Vehicles involved in fatal accidents: 2
Fatal accidents caused by drunken drivers: 1
Fatalities: 3
Persons involved in fatal accidents: 3
Pedestrians involved in fatal accidents: 0
Fatal accident statistics in 2013:
Fatal accident count: 1
Vehicles involved in fatal accidents: 2
Fatal accidents caused by drunken drivers: 0
Fatalities: 1
Persons involved in fatal accidents: 2
Pedestrians involved in fatal accidents: 0
2002 - 2018 National Fire Incident Reporting System (NFIRS) incidents
Based on the data from the years 2002 - 2018 the average number of fire incidents per year is 14. The highest number of fire incidents - 82 took place in 2005, and the least - 0 in 2007. The data has a decreasing trend.
When looking into fire subcategories, the most incidents belonged to: Outside Fires (62.5%), and Structure Fires (19.8%).
Fire incident types reported to NFIRS in Zip Code 79079


 Nearest zip codes: 79096, 79095, 79251, 73645, 79061, 79057.
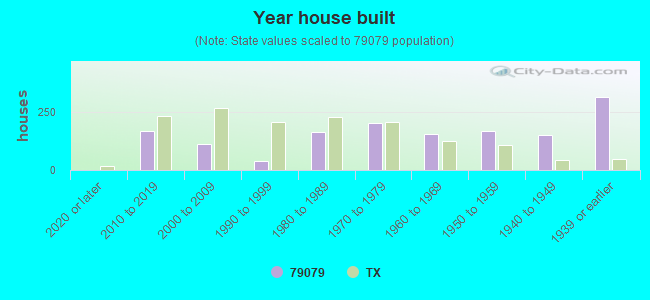


 Based on the data from the years 2002 - 2018 the average number of fire incidents per year is 14. The highest number of fire incidents - 82 took place in 2005, and the least - 0 in 2007. The data has a decreasing trend.
 When looking into fire subcategories, the most incidents belonged to: Outside Fires (62.5%), and Structure Fires (19.8%).