Estimated zip code population in 2022: 5,498 Zip code population in 2010: 5,945 Zip code population in 2000: 6,223
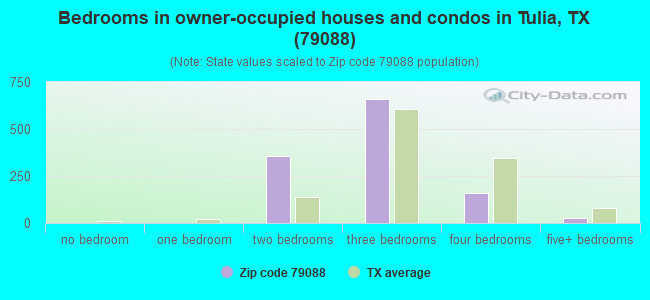
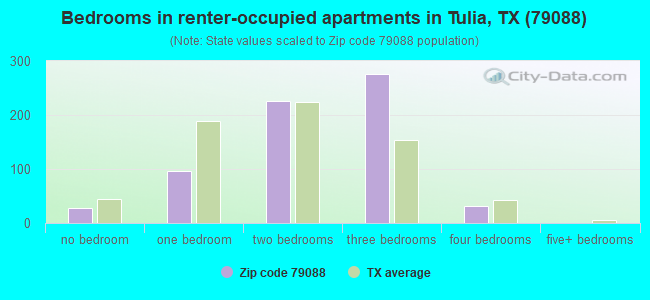
Houses and condos: 2,305 Renter-occupied apartments: 663
% of renters here:
35%
State:
38%
March 2022 cost of living index in zip code 79088: 77.5 (low, U.S. average is 100)
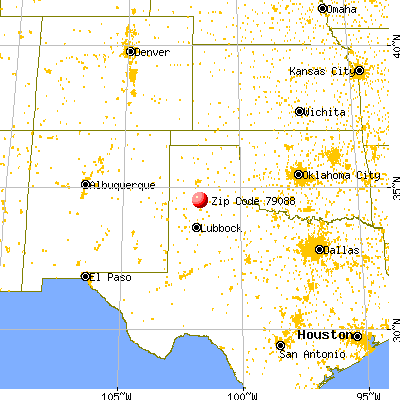
Land area: 576.0 sq. mi. Water area: 6.1 sq. mi.
Population density: 10 people per square mile
(very low).
OSM Map
General Map
Google Map
MSN Map
OSM Map
General Map
Google Map
MSN Map
OSM Map
General Map
Google Map
MSN Map
OSM Map
General Map
Google Map
MSN Map
Please wait while loading the map...
Real estate property taxes paid for housing units in 2022:
This zip code:
1.4% ($1,341)
Texas:
1.5% ($4,050)
Median real estate property taxes paid for housing units with mortgages in 2022: $3,076 (2.1%) Median real estate property taxes paid for housing units with no mortgage in 2022: $816 (1.2%)
Averages for the 2020 tax year for zip code 79088, filed in 2021:
Average Adjusted Gross Income (AGI) in 2020: $48,367 (Individual Income Tax Returns)
Here:
$48,367
State:
$77,054
Salary/wage: $38,031 (reported on 81.9% of returns)
Here:
$38,031
State:
$62,766
(% of AGI for various income ranges: 1284.4% for AGIs below $25k, 3688.2% for AGIs $25k-50k, 6488.9% for AGIs $50k-75k, 9692.7% for AGIs $75k-100k, 15493.8% for AGIs $100k-200k)
Taxable interest for individuals: $1,400 (reported on 24.5% of returns)
This zip code:
$1,400
Texas:
$2,665
(% of AGI for various income ranges: 11.4% for AGIs below $25k, 13.6% for AGIs $25k-50k, 30.5% for AGIs $50k-75k, 78.2% for AGIs $75k-100k, 115.0% for AGIs $100k-200k)
Ordinary dividends: $4,290 (reported on 9.8% of returns)
Here:
$4,290
State:
$10,044
(% of AGI for various income ranges: 8.8% for AGIs below $25k, 25.1% for AGIs $25k-50k, 37.4% for AGIs $50k-75k, 64.5% for AGIs $75k-100k, 302.5% for AGIs $100k-200k)
Net capital gain/loss in AGI: +$15,561 (reported on 8.8% of returns)
Here:
+$15,561
State:
+$39,590
(% of AGI for various income ranges: 10.6% for AGIs below $25k, 22.7% for AGIs $25k-50k, 17.4% for AGIs $50k-75k, 133.6% for AGIs $75k-100k, 760.0% for AGIs $100k-200k)
Profit/loss from business: +$7,364 (reported on 17.6% of returns)
Here:
+$7,364
State:
+$10,888
(% of AGI for various income ranges: 51.8% for AGIs below $25k, 77.6% for AGIs $25k-50k, 178.9% for AGIs $50k-75k, 397.3% for AGIs $75k-100k, 1015.0% for AGIs $100k-200k)
Taxable individual retirement arrangement distribution: $14,647 (reported on 8.3% of returns)
79088:
$14,647
Texas:
$24,740
(% of AGI for various income ranges: 32.7% for AGIs below $25k, 65.3% for AGIs $25k-50k, 295.8% for AGIs $50k-75k, 273.6% for AGIs $75k-100k, 1396.2% for AGIs $100k-200k)
Total itemized deductions: $36,500 (reported on 2.0% of returns)
Here:
$36,500
State:
$40,428
(% of AGI for various income ranges: 90.5% for AGIs below $25k, 1078.8% for AGIs $100k-200k)
Charity contributions: $24,733 (reported on 1.5% of returns)
Here:
$24,733
State:
$18,201
(% of AGI for various income ranges: 674.5% for AGIs $75k-100k)
Taxes paid: $3,850 (reported on 2.0% of returns)
79088:
$3,850
State:
$7,821
(% of AGI for various income ranges: 10.2% for AGIs below $25k, 108.7% for AGIs $100k-200k)
Earned income credit: $2,907 (reported on 27.9% of returns)
Here:
$2,907
State:
$2,584
(% of AGI for various income ranges: 171.8% for AGIs below $25k, 116.2% for AGIs $25k-50k)
Percentage of individuals using paid preparers for their 2020 taxes: 93.1%
Here:
93%
State:
92%
(% for various income ranges: 94.0% for AGIs below $25k, 94.7% for AGIs $25k-50k, 88.9% for AGIs $50k-75k, 88.2% for AGIs $75k-100k, 93.8% for AGIs $100k-200k, 100.0% for AGIs over 200k)
Averages for the 2012 tax year for zip code 79088, filed in 2013:
Average Adjusted Gross Income (AGI) in 2012: $44,247 (Individual Income Tax Returns)
Here:
$44,247
State:
$65,384
Salary/wage: $33,385 (reported on 82.8% of returns)
Here:
$33,385
State:
$52,524
(% of AGI for various income ranges: 81.0% for AGIs below $25k, 81.5% for AGIs $25k-50k, 72.9% for AGIs $50k-75k, 67.3% for AGIs $75k-100k, 74.3% for AGIs $100k-200k)
Taxable interest for individuals: $2,125 (reported on 26.0% of returns)
This zip code:
$2,125
Texas:
$2,372
(% of AGI for various income ranges: 1.6% for AGIs below $25k, 0.9% for AGIs $25k-50k, 0.9% for AGIs $50k-75k, 0.7% for AGIs $75k-100k, 0.8% for AGIs $100k-200k, 2.6% for AGIs over 200k)
Ordinary dividends: $2,908 (reported on 12.3% of returns)
Here:
$2,908
State:
$9,721
(% of AGI for various income ranges: 0.8% for AGIs below $25k, 0.4% for AGIs $25k-50k, 1.4% for AGIs $50k-75k, 0.5% for AGIs $75k-100k, 1.2% for AGIs $100k-200k, 0.6% for AGIs over 200k)
Net capital gain/loss in AGI: +$4,557 (reported on 11.3% of returns)
Here:
+$4,557
State:
+$35,319
(% of AGI for various income ranges: 0.4% for AGIs below $25k, 0.4% for AGIs $25k-50k, 0.4% for AGIs $50k-75k, 1.3% for AGIs $75k-100k, 0.5% for AGIs $100k-200k, 3.9% for AGIs over 200k)
Profit/loss from business: +$7,903 (reported on 18.6% of returns)
Here:
+$7,903
State:
+$13,732
(% of AGI for various income ranges: 5.7% for AGIs below $25k, 2.8% for AGIs $25k-50k, 3.0% for AGIs $50k-75k, 3.7% for AGIs $75k-100k, 5.8% for AGIs $100k-200k)
Taxable individual retirement arrangement distribution: $12,500 (reported on 8.8% of returns)
79088:
$12,500
Texas:
$19,511
(% of AGI for various income ranges: 2.3% for AGIs below $25k, 1.6% for AGIs $25k-50k, 2.4% for AGIs $50k-75k, 3.7% for AGIs $75k-100k, 5.8% for AGIs $100k-200k)
Total itemized deductions: $22,665 (20% of AGI, reported on 11.3% of returns)
Here:
$22,665
State:
$24,724
Here:
20.4% of AGI
State:
15.9% of AGI
(% of AGI for various income ranges: 6.4% for AGIs below $25k, 4.9% for AGIs $25k-50k, 5.2% for AGIs $50k-75k, 5.5% for AGIs $75k-100k, 13.5% for AGIs $100k-200k)
Charity contributions: $9,306 (reported on 7.8% of returns)
Here:
$9,306
State:
$6,808
(% of AGI for various income ranges: 1.2% for AGIs $25k-50k, 1.5% for AGIs $50k-75k, 1.1% for AGIs $75k-100k, 6.1% for AGIs $100k-200k)
Taxes paid: $3,165 (reported on 11.3% of returns)
79088:
$3,165
State:
$6,921
(% of AGI for various income ranges: 0.6% for AGIs below $25k, 0.9% for AGIs $25k-50k, 0.6% for AGIs $50k-75k, 0.7% for AGIs $75k-100k, 2.0% for AGIs $100k-200k)
Earned income credit: $2,519 (reported on 32.8% of returns)
Here:
$2,519
State:
$2,570
(% of AGI for various income ranges: 11.0% for AGIs below $25k, 2.0% for AGIs $25k-50k)
Percentage of individuals using paid preparers for their 2012 taxes: 58.3%
Here:
58%
State:
51%
(% for various income ranges: 51.6% for AGIs below $25k, 59.3% for AGIs $25k-50k, 64.0% for AGIs $50k-75k, 64.3% for AGIs $75k-100k, 75.0% for AGIs $100k-200k, 100.0% for AGIs over 200k)
Averages for the 2004 tax year for zip code 79088, filed in 2005:
Average Adjusted Gross Income (AGI) in 2004: $28,382 (Individual Income Tax Returns)
Here:
$28,382
State:
$47,881
Salary/wage: $25,101 (reported on 82.0% of returns)
Here:
$25,101
State:
$41,947
(% of AGI for various income ranges: 197.3% for AGIs below $10k, 81.5% for AGIs $10k-25k, 80.2% for AGIs $25k-50k, 72.6% for AGIs $50k-75k, 74.2% for AGIs $75k-100k, 36.6% for AGIs over 100k)
Taxable interest for individuals: $2,728 (reported on 31.1% of returns)
This zip code:
$2,728
Texas:
$2,255
(% of AGI for various income ranges: 17.0% for AGIs below $10k, 2.5% for AGIs $10k-25k, 2.2% for AGIs $25k-50k, 3.4% for AGIs $50k-75k, 1.1% for AGIs $75k-100k, 3.8% for AGIs over 100k)
Taxable dividends: $1,776 (reported on 15.5% of returns)
Here:
$1,776
State:
$4,261
(% of AGI for various income ranges: 2.1% for AGIs below $10k, 0.6% for AGIs $10k-25k, 0.6% for AGIs $25k-50k, 0.7% for AGIs $50k-75k, 0.8% for AGIs $75k-100k, 2.2% for AGIs over 100k)
Net capital gain/loss: +$2,130 (reported on 13.1% of returns)
Here:
+$2,130
State:
+$16,110
(% of AGI for various income ranges: 1.0% for AGIs below $10k, 0.2% for AGIs $10k-25k, 0.1% for AGIs $25k-50k, -0.3% for AGIs $50k-75k, 2.0% for AGIs $75k-100k, 4.1% for AGIs over 100k)
Profit/loss from business: +$6,340 (reported on 16.4% of returns)
Here:
+$6,340
State:
+$11,013
(% of AGI for various income ranges: 11.0% for AGIs below $10k, 3.3% for AGIs $10k-25k, 1.7% for AGIs $25k-50k, 2.0% for AGIs $50k-75k, 3.9% for AGIs $75k-100k, 8.3% for AGIs over 100k)
IRA payment deduction: $3,162 (reported on 1.7% of returns)
79088:
$3,162
Texas:
$3,120
Self-employed pension: $19,000 (reported on 0.5% of returns)
Here:
$19,000
Texas:
$16,401
Total itemized deductions: $18,394 (27% of AGI, reported on 10.7% of returns)
Here:
$18,394
State:
$19,631
Here:
27.5% of AGI
State:
18.9% of AGI
(% of AGI for various income ranges: 24.5% for AGIs below $10k, 3.8% for AGIs $10k-25k, 4.9% for AGIs $25k-50k, 6.9% for AGIs $50k-75k, 8.6% for AGIs $75k-100k, 10.3% for AGIs over 100k)
Charity contributions deductions: $5,645 (8% of AGI, reported on 9.2% of returns)
Here:
$5,645
State:
$4,753
Here:
8.2% of AGI
State:
4.2% of AGI
(% of AGI for various income ranges: 2.1% for AGIs below $10k, 0.6% for AGIs $10k-25k, 1.0% for AGIs $25k-50k, 1.6% for AGIs $50k-75k, 1.7% for AGIs $75k-100k, 4.6% for AGIs over 100k)
Total tax: $4,328 (reported on 58.2% of returns)
79088:
$4,328
State:
$9,058
(% of AGI for various income ranges: 6.0% for AGIs below $10k, 2.7% for AGIs $10k-25k, 5.5% for AGIs $25k-50k, 8.8% for AGIs $50k-75k, 11.5% for AGIs $75k-100k, 19.3% for AGIs over 100k)
Earned income credit: $2,034 (reported on 31.1% of returns)
Here:
$2,034
State:
$2,024
Percentage of individuals using paid preparers for their 2004 taxes: 60.9%
Here:
61%
State:
57%
(% for various income ranges: 53.8% for AGIs below $10k, 64.0% for AGIs $10k-25k, 60.7% for AGIs $25k-50k, 65.0% for AGIs $50k-75k, 59.2% for AGIs $75k-100k, 84.2% for AGIs over 100k)
Household received Food Stamps/SNAP in the past 12 months: 246 Household did not receive Food Stamps/SNAP in the past 12 months: 1,627
Women who had a birth in the past 12 months: 45 (35 now married, 9 unmarried) Women who did not have a birth in the past 12 months: 1,026 (451 now married, 575 unmarried)
Housing units in zip code 79088 with a mortgage: 358 (7 second mortgage) Houses without a mortgage: 10
Median monthly owner costs for units with a mortgage: $1,202 Median monthly owner costs for units without a mortgage: $383
Residents with income below the poverty level in 2022:
This zip code:
33.3%
Whole state:
14.0%
Residents with income below 50% of the poverty level in 2022:
This zip code:
18.5%
Whole state:
7.4%
Median number of rooms in houses and condos:
Here:
5.8
State:
6.3
Median number of rooms in apartments:
Here:
4.7
State:
4.0
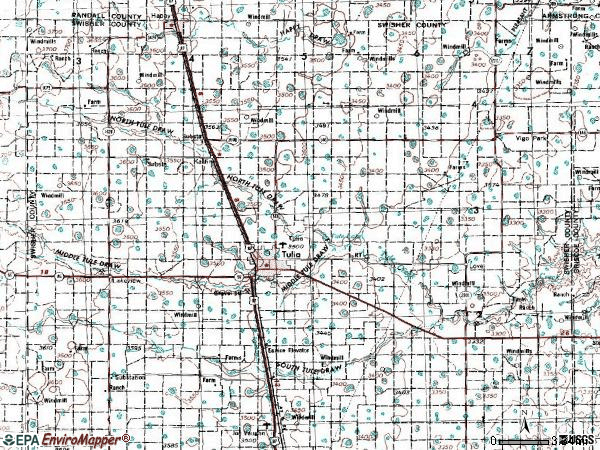
Notable locations in this zip code not listed on our city pages
Notable locations in zip code 79088: Cripple T Farm (A), Love (B), Hall Ranch (C), Hulsey Ranch (D), McMurtry Farm (E), Tule Ranch (F), Vigo Park Volunteer Fire Department (G), Swisher County Museum (H), Tulia Volunteer Fire Department (I), Tule Creek Emergency Medical Service (J). Display/hide their locations on the map
Churches in zip code 79088 include: Calvary Church (A), Tulia Seventh Day Adventist Church (B), Christ Evangelical Lutheran Church (C), Church of Christ (D). Display/hide their locations on the map
Reservoirs: Tule Lake (A), H T Copeland Reservoir (B), Tulia Feedlot Reservoir (C), Roy Stockett Reservoir (D), Bill Bivens Reservoir (E), Ray Bivens Lake (F). Display/hide their locations on the map
In group quarters: 643 (-1 institutionalized population)
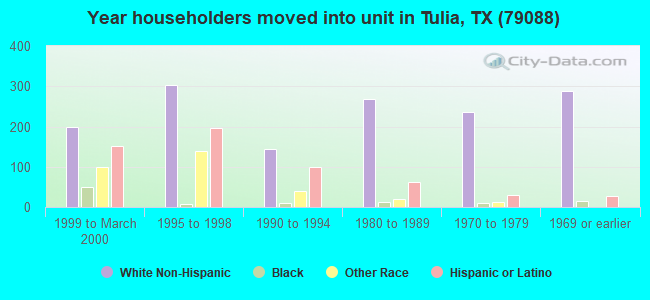
Size of family households: 409 2-persons, 192 3-persons, 240 4-persons, 82 5-persons, 73 6-persons
Size of nonfamily households: 760 1-person, 103 2-persons, 17 3-persons
718 married couples with children.
294 single-parent households (27 men, 267 women).
69.9% of residents of 79088 zip code speak English at home.
30.4% of residents speak Spanish at home (69% very well, 10% well, 8% not well, 14% not at all).
0.1% of residents speak other language at home (100% very well).
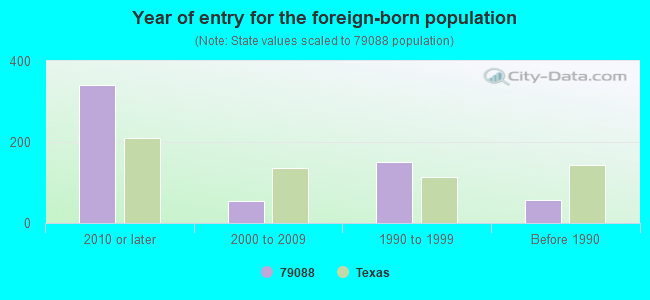
Foreign born population: 539 (9.8%) (14.7% of them are naturalized citizens)
This zip code:
9.8%
Whole state:
17.2%
86%Honduras
1%Guatemala
1%Morocco
0%Malaysia
0%Nepal
8%American
6%German
5%African
5%English
3%Irish
1%Scottish
1%Norwegian
Year of entry for the foreign-born population
3402010 or later
552000 to 2009
1501990 to 1999
57Before 1990
Facilities with environmental interests located in this zip code:
BARTLETT 1 (6443 FM 928 in TULIA, TX)
National Pollutant Discharge Elimination System NON-MAJOR (Tracking pollutant discharge elimination systems) - permit (Resource Conservation and Recovery Act (tracking hazardous waste)) Business SIC classification: BEEF CATTLE FEEDLOTS Business NAICS classification: CATTLE FEEDLOTS.; CATTLE FEEDLOTS. Organizations: BARTLETT CATTLE COMPANY LP (CONTACT/OPERATOR)
Alternative names: BARTLETT CATTLE COMPANY LP, BARTLETT CATTLE COMPANY LP I, BARTLETT CATTLE CO LP II, BARTLETT I
AGRIFARM INDUSTIRES, LLC (127 N SANTA FE in TULIA, TX)
AIR MINOR (AIRS/AFS) Business SIC classification: GRAIN AND FIELD BEANS
Housing units lacking complete plumbing facilities: 7.2% Housing units lacking complete kitchen facilities: 12.8%
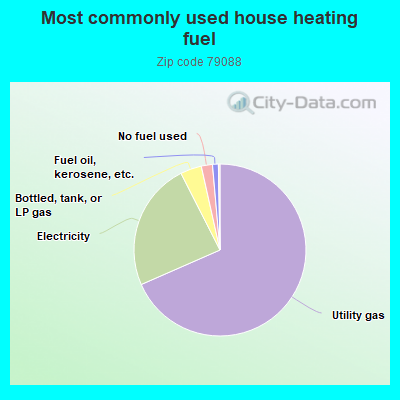
68.5%Utility gas
24.1%Electricity
4.0%Bottled, tank, or LP gas
2.1%No fuel used
1.1%Fuel oil, kerosene, etc.
Population in 1990: 5,651. Population change in the 1990s: +572 (+10.1%).
Place of birth for U.S.-born residents:
This state: 4,287
Northeast: 21
Midwest: 90
South: 223
West: 271
57% of the 79088 zip code residents lived in the same house 5 years ago. Out of people who lived in different houses, 53% lived in this county. Out of people who lived in different counties, 50% lived in Texas.
90% of the 79088 zip code residents lived in the same house 1 year ago. Out of people who lived in different houses, 7% moved from this county. Out of people who lived in different houses, 78% moved from different county within same state. Out of people who lived in different houses, 15% moved from different state. Out of people who lived in different houses, 6% moved from abroad.
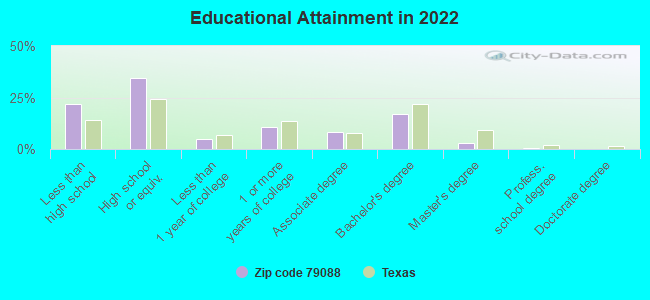
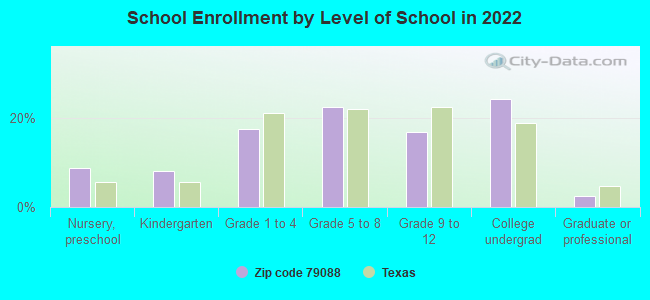
Private vs. public school enrollment:
Students in private schools in grades 1 to 8 (elementary and middle school):
Here:
0.0%
Texas:
8.8%
Students in private schools in grades 9 to 12 (high school):
Here:
0.0%
Texas:
8.0%
Students in private undergraduate colleges:
Here:
0.0%
Texas:
16.2%
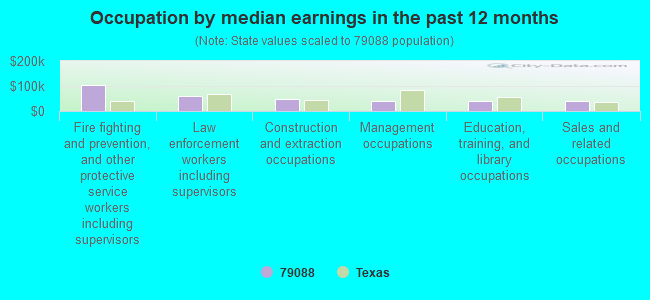
Occupation by median earnings in the past 12 months ($)
102,972Fire fighting and prevention, and other protective service workers including supervisors
59,239Law enforcement workers including supervisors
47,099Construction and extraction occupations
39,769Management occupations
39,768Education, training, and library occupations
38,902Sales and related occupations
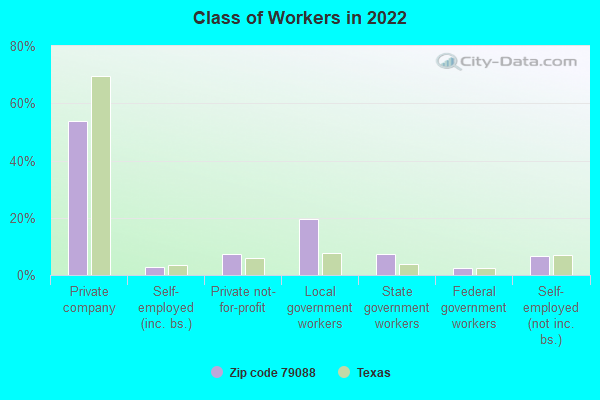
Top industries in this zip code by the number of employees in 2005:
Health Care and Social Assistance: General Medical and Surgical Hospitals (100-249 employees: 1 establishment)
39 people in nursing facilities/skilled-nursing facilities
16 people in local jails and other municipal confinement facilities
12 people in residential treatment centers for adults
People in group quarters in 2000:
564 people in other types of correctional institutions
41 people in nursing homes
26 people in local jails and other confinement facilities (including police lockups)
8 people in homes or halfway houses for drug/alcohol abuse
Fatal accident statistics in 2014:
Fatal accident count: 1
Vehicles involved in fatal accidents: 1
Fatal accidents caused by drunken drivers: 0
Fatalities: 1
Persons involved in fatal accidents: 1
Pedestrians involved in fatal accidents: 0
Fatal accident statistics in 2013:
Fatal accident count: 3
Vehicles involved in fatal accidents: 5
Fatal accidents caused by drunken drivers: 2
Fatalities: 3
Persons involved in fatal accidents: 9
Pedestrians involved in fatal accidents: 1
2005 - 2018 National Fire Incident Reporting System (NFIRS) incidents
Based on the data from the years 2005 - 2018 the average number of fire incidents per year is 62. The highest number of reported fires - 101 took place in 2018, and the least - 3 in 2005. The data has a rising trend.
When looking into fire subcategories, the most incidents belonged to: Outside Fires (75.1%), and Structure Fires (14.5%).
Fire incident types reported to NFIRS in Zip Code 79088


 Nearest zip codes: 79052, 79042, 79094, 79032, 79063, 79072.


 Based on the data from the years 2005 - 2018 the average number of fire incidents per year is 62. The highest number of reported fires - 101 took place in 2018, and the least - 3 in 2005. The data has a rising trend.
 When looking into fire subcategories, the most incidents belonged to: Outside Fires (75.1%), and Structure Fires (14.5%).