Estimated zip code population in 2022: 1,286 Zip code population in 2010: 791 Zip code population in 2000: 701
Houses and condos: 615 Renter-occupied apartments: 180
% of renters here:
32%
State:
38%
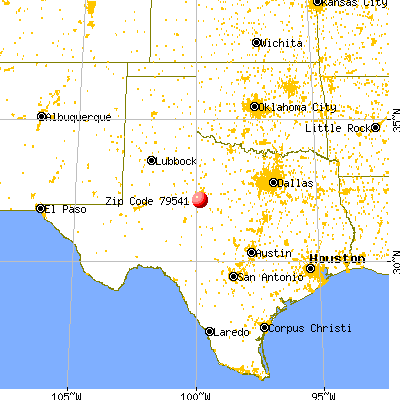
March 2022 cost of living index in zip code 79541: 79.6 (low, U.S. average is 100)
Land area: 157.7 sq. mi. Water area: 0.3 sq. mi.
Population density: 8 people per square mile
(very low).
OSM Map
General Map
Google Map
MSN Map
OSM Map
General Map
Google Map
MSN Map
OSM Map
General Map
Google Map
MSN Map
OSM Map
General Map
Google Map
MSN Map
Please wait while loading the map...
Median real estate property taxes paid for housing units with mortgages in 2022: $3,413 Median real estate property taxes paid for housing units with no mortgage in 2022: $610
Business Search- 14 Million verified businesses
Males: 715
(55.6%)
Females: 570
(44.4%)
For population 25 years and over in 79541:
High school or higher: 98.6%
Bachelor's degree or higher: 17.3%
Graduate or professional degree: 8.6%
Unemployed: 6.0%
Mean travel time to work (commute): 22.2 minutes
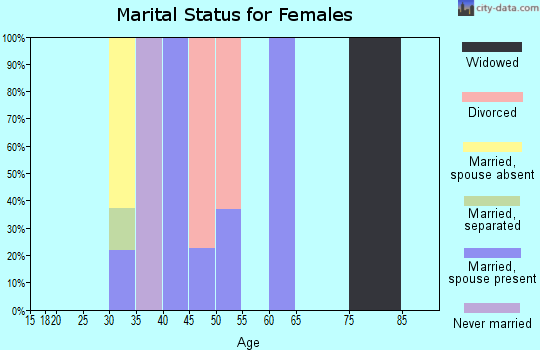
For population 15 years and over in 79541:
Never married: 14.4%
Now married: 46.5%
Separated: 0.0%
Widowed: 1.4%
Divorced: 37.7%
Zip code 79541 compared to state average:
Black race population percentage significantly below state average.
Hispanic race population percentage significantly below state average.
Foreign-born population percentage significantly below state average.
Length of stay since moving in significantly above state average.
Number of rooms per house above state average.
House age above state average.
Number of college students significantly below state average.
Percentage of population with a bachelor's degree or higher below state average.
Averages for the 2020 tax year for zip code 79541, filed in 2021:
Average Adjusted Gross Income (AGI) in 2020: $75,816 (Individual Income Tax Returns)
Here:
$75,816
State:
$77,054
Salary/wage: $72,165 (reported on 79.1% of returns)
Here:
$72,165
State:
$62,766
(% of AGI for various income ranges: 1674.3% for AGIs below $25k, 3431.4% for AGIs $25k-50k, 5670.0% for AGIs $50k-75k, 8600.0% for AGIs $75k-100k, 25911.7% for AGIs $100k-200k)
Taxable interest for individuals: $1,275 (reported on 37.2% of returns)
This zip code:
$1,275
Texas:
$2,665
(% of AGI for various income ranges: 20.0% for AGIs below $25k, 70.0% for AGIs $50k-75k, 26.7% for AGIs $75k-100k, 245.0% for AGIs $100k-200k)
Ordinary dividends: $3,138 (reported on 18.6% of returns)
Here:
$3,138
State:
$10,044
(% of AGI for various income ranges: 114.3% for AGIs $25k-50k, 285.0% for AGIs $100k-200k)
Net capital gain/loss in AGI: +$10,300 (reported on 18.6% of returns)
Here:
+$10,300
State:
+$39,590
(% of AGI for various income ranges: 55.7% for AGIs below $25k, 240.0% for AGIs $50k-75k, 1108.3% for AGIs $100k-200k)
Profit/loss from business: +$11,089 (reported on 20.9% of returns)
Here:
+$11,089
State:
+$10,888
(% of AGI for various income ranges: 21.4% for AGIs below $25k, 710.0% for AGIs $50k-75k, 1046.7% for AGIs $100k-200k)
Taxable individual retirement arrangement distribution: $14,525 (reported on 9.3% of returns)
79541:
$14,525
Texas:
$24,740
(% of AGI for various income ranges: 1936.7% for AGIs $75k-100k)
Total itemized deductions: $46,300 (reported on 4.7% of returns)
Here:
$46,300
State:
$40,428
(% of AGI for various income ranges: 1543.3% for AGIs $100k-200k)
Charity contributions: $23,300 (reported on 4.7% of returns)
Here:
$23,300
State:
$18,201
(% of AGI for various income ranges: 776.7% for AGIs $100k-200k)
Taxes paid: $8,550 (reported on 4.7% of returns)
79541:
$8,550
State:
$7,821
(% of AGI for various income ranges: 285.0% for AGIs $100k-200k)
Earned income credit: $2,260 (reported on 11.6% of returns)
Here:
$2,260
State:
$2,584
(% of AGI for various income ranges: 84.3% for AGIs below $25k, 77.1% for AGIs $25k-50k)
Percentage of individuals using paid preparers for their 2020 taxes: 95.3%
Here:
95%
State:
92%
(% for various income ranges: 90.9% for AGIs below $25k, 88.9% for AGIs $25k-50k, 100.0% for AGIs $50k-75k, 100.0% for AGIs $75k-100k, 100.0% for AGIs $100k-200k)
Averages for the 2012 tax year for zip code 79541, filed in 2013:
Average Adjusted Gross Income (AGI) in 2012: $66,237 (Individual Income Tax Returns)
Here:
$66,237
State:
$65,384
Salary/wage: $60,488 (reported on 80.0% of returns)
Here:
$60,488
State:
$52,524
(% of AGI for various income ranges: 56.5% for AGIs below $25k, 84.1% for AGIs $25k-50k, 82.8% for AGIs $50k-75k, 67.6% for AGIs $75k-100k, 70.3% for AGIs $100k-200k)
Taxable interest for individuals: $446 (reported on 43.3% of returns)
This zip code:
$446
Texas:
$2,372
(% of AGI for various income ranges: 0.2% for AGIs below $25k, 0.2% for AGIs $25k-50k, 0.7% for AGIs $50k-75k, 0.3% for AGIs $100k-200k)
Ordinary dividends: $2,380 (reported on 16.7% of returns)
Here:
$2,380
State:
$9,721
Net capital gain/loss in AGI: +$12,700 (reported on 16.7% of returns)
Here:
+$12,700
State:
+$35,319
Profit/loss from business: +$8,671 (reported on 23.3% of returns)
Here:
+$8,671
State:
+$13,732
(% of AGI for various income ranges: 16.7% for AGIs below $25k, 4.7% for AGIs $50k-75k, 2.7% for AGIs $100k-200k)
Taxable individual retirement arrangement distribution: $6,950 (reported on 6.7% of returns)
79541:
$6,950
Texas:
$19,511
Total itemized deductions: $22,950 (17% of AGI, reported on 20.0% of returns)
Here:
$22,950
State:
$24,724
Here:
17.3% of AGI
State:
15.9% of AGI
Charity contributions: $7,640 (reported on 16.7% of returns)
Here:
$7,640
State:
$6,808
Taxes paid: $4,150 (reported on 20.0% of returns)
79541:
$4,150
State:
$6,921
Earned income credit: $2,150 (reported on 13.3% of returns)
Here:
$2,150
State:
$2,570
(% of AGI for various income ranges: 8.5% for AGIs below $25k)
Percentage of individuals using paid preparers for their 2012 taxes: 70.0%
Here:
70%
State:
51%
(% for various income ranges: 55.6% for AGIs below $25k, 71.4% for AGIs $25k-50k, 120.0% for AGIs $50k-75k, 83.3% for AGIs $100k-200k)
Averages for the 2004 tax year for zip code 79541, filed in 2005:
Average Adjusted Gross Income (AGI) in 2004: $32,180 (Individual Income Tax Returns)
Here:
$32,180
State:
$47,881
Salary/wage: $37,350 (reported on 79.4% of returns)
Here:
$37,350
State:
$41,947
(% of AGI for various income ranges: 84.1% for AGIs $10k-25k, 83.2% for AGIs $25k-50k, 85.6% for AGIs $50k-75k, 102.6% for AGIs $75k-100k, 71.8% for AGIs over 100k)
Taxable interest for individuals: $883 (reported on 41.8% of returns)
This zip code:
$883
Texas:
$2,255
(% of AGI for various income ranges: 1.5% for AGIs $10k-25k, 0.8% for AGIs $25k-50k, 0.7% for AGIs $50k-75k, 0.2% for AGIs $75k-100k, 2.2% for AGIs over 100k)
Taxable dividends: $673 (reported on 18.0% of returns)
Here:
$673
State:
$4,261
Net capital gain/loss: +$3,390 (reported on 19.3% of returns)
Here:
+$3,390
State:
+$16,110
Profit/loss from business: +$3,266 (reported on 20.9% of returns)
Here:
+$3,266
State:
+$11,013
(% of AGI for various income ranges: 9.1% for AGIs $10k-25k, 1.2% for AGIs $25k-50k, 0.6% for AGIs $50k-75k)
Total itemized deductions: $16,894 (28% of AGI, reported on 15.4% of returns)
Here:
$16,894
State:
$19,631
Here:
28.2% of AGI
State:
18.9% of AGI
Charity contributions deductions: $2,912 (5% of AGI, reported on 11.1% of returns)
Here:
$2,912
State:
$4,753
Here:
4.5% of AGI
State:
4.2% of AGI
Total tax: $4,244 (reported on 68.3% of returns)
79541:
$4,244
State:
$9,058
(% of AGI for various income ranges: 3.8% for AGIs $10k-25k, 6.0% for AGIs $25k-50k, 8.6% for AGIs $50k-75k, 10.3% for AGIs $75k-100k, 14.5% for AGIs over 100k)
Earned income credit: $1,442 (reported on 17.0% of returns)
Here:
$1,442
State:
$2,024
Percentage of individuals using paid preparers for their 2004 taxes: 73.2%
Here:
73%
State:
57%
(% for various income ranges: 69.4% for AGIs below $10k, 71.0% for AGIs $10k-25k, 74.4% for AGIs $25k-50k, 77.6% for AGIs $50k-75k, 131.6% for AGIs $75k-100k)
Household received Food Stamps/SNAP in the past 12 months: 0 Household did not receive Food Stamps/SNAP in the past 12 months: 567
Women who did not have a birth in the past 12 months: 182 (47 now married, 136 unmarried)
Housing units in zip code 79541 with a mortgage: 119 (3 second mortgage, 4 both second mortgage and home equity loan) Residents with income below the poverty level in 2022:
This zip code:
5.2%
Whole state:
14.0%
Residents with income below 50% of the poverty level in 2022:
This zip code:
2.6%
Whole state:
7.4%
Median number of rooms in houses and condos:
Here:
7.0
State:
6.3
Median number of rooms in apartments:
Here:
5.3
State:
4.0
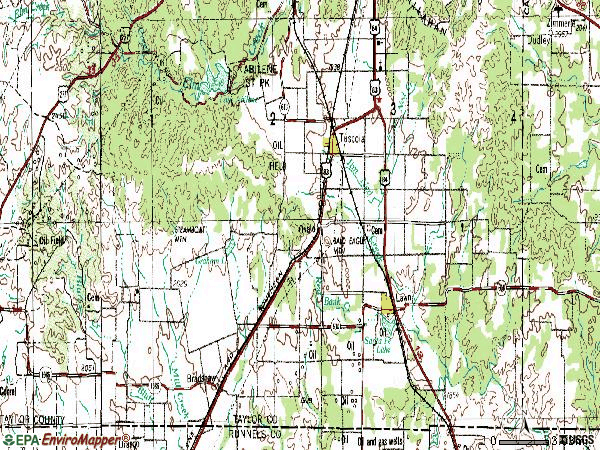
Notable locations in this zip code not listed on our city pages
Reservoirs: Ovalo Lake (A), Graham Lake (B), Soil Conservation Service Site 12a Reservoir (C), Soil Conservation Service Site 15 Reservoir (D), Bluff Creek Reservoir (E), Lake Bulger (F). Display/hide their locations on the map
Streams, rivers, and creeks: East Jim Ned Creek (A), Twomile Creek (B), Flag Creek (C), Camp Branch (D), Buck Creek (E). Display/hide their locations on the map
Size of family households: 159 2-persons, 12 3-persons, 38 4-persons, 123 5-persons
Size of nonfamily households: 235 1-person
122 married couples with children.
61 single-parent households (12 men, 49 women).
85.6% of residents of 79541 zip code speak English at home.
14.4% of residents speak Spanish at home (100% very well).
1.0% of residents speak other Indo-European language at home (100% very well).
Foreign born population: 35 (2.7%) (100.0% of them are naturalized citizens)
This zip code:
2.7%
Whole state:
17.2%
97%United Kingdom, excluding England and Scotland
88%Sweden
99%English
11%American
5%German
2%European
1%Northern European
Year of entry for the foreign-born population
02010 or later
02000 to 2009
01990 to 1999
29Before 1990
Housing units lacking complete plumbing facilities: 7.6% Housing units lacking complete kitchen facilities: 7.5%
56.5%Electricity
34.4%Bottled, tank, or LP gas
8.7%Other fuel
0.7%Utility gas
Population in 1990: 326. Population change in the 1990s: +375 (+115.0%).
Place of birth for U.S.-born residents:
This state: 820
Midwest: 31
South: 318
West: 81
69% of the 79541 zip code residents lived in the same house 5 years ago. Out of people who lived in different houses, 43% lived in this county. Out of people who lived in different counties, 50% lived in Texas.
95% of the 79541 zip code residents lived in the same house 1 year ago. Out of people who lived in different houses, 94% moved from this county.
Private vs. public school enrollment:
Students in private schools in grades 1 to 8 (elementary and middle school): 28
Here:
12.1%
Texas:
8.8%
Students in private schools in grades 9 to 12 (high school):
Here:
0.0%
Texas:
8.0%
Students in private undergraduate colleges:
Here:
0.0%
Texas:
16.2%
Occupation by median earnings in the past 12 months ($)
91,404Management occupations
69,873Business and financial operations occupations
49,968Installation, maintenance, and repair occupations
8,625Office and administrative support occupations
Companies with federal contracts located in this zip code:
ITEM ENTERPRISES INC (609 B CR 176 in OVALO, TX; small business) : $1,440,714 in 6 contractsfrom 2004 to 2005
Contracts for Maintenance, Repair or Alteration of Real Property -- Other Non-Building Facilities, Construction of Structures and Facilities -- Electronic and Communications Facilities, Construction of Structures and Facilities -- Recreational Buildings, Landscaping/Groundskeeping Services, and moreby Air Force Signed by year:2000: $0; 2001: $0; 2002: $0; 2003: $0; 2004: $1,263,396; 2005: $177,318; 2006: $0.
Biggest contracts:
$1,194,546 with Air Force for Maintenance, Repair or Alteration of Real Property -- Other Non-Building Facilities. Signed on 2004-09-30. Completion date: 2005-03-21.
$165,341 with Air Force for Construction of Structures and Facilities -- Electronic and Communications Facilities. Signed on 2005-08-15. Completion date: 2006-03-06.
$68,850 with Air Force for Construction of Structures and Facilities -- Recreational Buildings. Signed on 2004-09-30. Completion date: 2004-09-09.
$9,052 with Air Force for Landscaping/Groundskeeping Services. Signed on 2005-04-18. Completion date: 2005-05-18.
Top industries in this zip code by the number of employees in 2005:
Educational Services: Sports and Recreation Instruction (1-4 employees: 1 establishment)
Construction: Residential Remodelers (1-4: 1)
Construction: Plumbing, Heating, and Air-Conditioning Contractors (1-4: 1)
Fatal accident statistics in 2012:
Fatal accident count: 1
Vehicles involved in fatal accidents: 2
Fatal accidents caused by drunken drivers: 0
Fatalities: 1
Persons involved in fatal accidents: 3
Pedestrians involved in fatal accidents: 0
Home Mortgage Disclosure Act Aggregated Statistics For Year 2009 (Based on 2 partial tracts)
A) FHA, FSA/RHS & VA Home Purchase Loans
B) Conventional Home Purchase Loans
C) Refinancings
D) Home Improvement Loans
F) Non-occupant Loans on < 5 Family Dwellings (A B C & D)
G) Loans On Manufactured Home Dwelling (A B C & D)
Number
Average Value
Number
Average Value
Number
Average Value
Number
Average Value
Number
Average Value
Number
Average Value
LOANS ORIGINATED
30
$163,914
33
$159,350
63
$162,718
13
$75,875
6
$96,920
6
$38,420
APPLICATIONS APPROVED, NOT ACCEPTED
2
$77,900
2
$61,685
3
$253,690
0
$0
0
$0
3
$59,850
APPLICATIONS DENIED
2
$64,580
3
$149,240
26
$194,433
3
$50,777
1
$110,630
2
$62,845
APPLICATIONS WITHDRAWN
2
$114,100
1
$108,890
13
$230,834
0
$0
0
$0
0
$0
FILES CLOSED FOR INCOMPLETENESS
1
$90,930
2
$41,415
2
$238,630
1
$1,740
0
$0
1
$55,020
Aggregated Statistics For Year 2008 (Based on 2 partial tracts)
A) FHA, FSA/RHS & VA Home Purchase Loans
B) Conventional Home Purchase Loans
C) Refinancings
D) Home Improvement Loans
F) Non-occupant Loans on < 5 Family Dwellings (A B C & D)
G) Loans On Manufactured Home Dwelling (A B C & D)
Number
Average Value
Number
Average Value
Number
Average Value
Number
Average Value
Number
Average Value
Number
Average Value
LOANS ORIGINATED
25
$155,179
41
$152,768
30
$175,980
14
$33,924
5
$126,960
6
$55,700
APPLICATIONS APPROVED, NOT ACCEPTED
1
$42,860
4
$93,395
3
$199,630
2
$23,745
0
$0
2
$25,775
APPLICATIONS DENIED
2
$113,235
10
$165,767
18
$138,912
8
$37,214
1
$33,590
4
$45,612
APPLICATIONS WITHDRAWN
1
$56,180
1
$243,260
10
$150,476
1
$6,370
0
$0
0
$0
FILES CLOSED FOR INCOMPLETENESS
1
$179,550
0
$0
2
$164,780
1
$1,740
0
$0
0
$0
Aggregated Statistics For Year 2007 (Based on 2 partial tracts)
A) FHA, FSA/RHS & VA Home Purchase Loans
B) Conventional Home Purchase Loans
C) Refinancings
D) Home Improvement Loans
F) Non-occupant Loans on < 5 Family Dwellings (A B C & D)
G) Loans On Manufactured Home Dwelling (A B C & D)
Number
Average Value
Number
Average Value
Number
Average Value
Number
Average Value
Number
Average Value
Number
Average Value
LOANS ORIGINATED
16
$154,972
57
$134,192
29
$149,513
22
$36,437
3
$160,630
5
$48,190
APPLICATIONS APPROVED, NOT ACCEPTED
0
$0
10
$97,595
6
$133,408
2
$33,305
1
$86,300
4
$52,418
APPLICATIONS DENIED
1
$89,780
6
$100,973
26
$151,038
13
$31,945
2
$75,585
2
$54,155
APPLICATIONS WITHDRAWN
1
$134,370
6
$79,253
16
$130,031
2
$20,270
2
$68,635
0
$0
FILES CLOSED FOR INCOMPLETENESS
0
$0
1
$34,750
2
$164,495
1
$132,060
0
$0
0
$0
Aggregated Statistics For Year 2006 (Based on 2 partial tracts)
A) FHA, FSA/RHS & VA Home Purchase Loans
B) Conventional Home Purchase Loans
C) Refinancings
D) Home Improvement Loans
F) Non-occupant Loans on < 5 Family Dwellings (A B C & D)
G) Loans On Manufactured Home Dwelling (A B C & D)
Number
Average Value
Number
Average Value
Number
Average Value
Number
Average Value
Number
Average Value
Number
Average Value
LOANS ORIGINATED
9
$150,334
72
$115,510
28
$149,785
16
$31,784
5
$109,352
4
$57,195
APPLICATIONS APPROVED, NOT ACCEPTED
1
$155,800
4
$32,870
2
$156,965
2
$19,115
1
$165,070
1
$30,700
APPLICATIONS DENIED
1
$68,920
23
$146,991
28
$116,730
17
$33,900
9
$247,511
4
$46,915
APPLICATIONS WITHDRAWN
2
$123,080
7
$98,794
25
$141,464
3
$69,117
0
$0
0
$0
FILES CLOSED FOR INCOMPLETENESS
0
$0
1
$83,400
8
$155,442
0
$0
0
$0
0
$0
Aggregated Statistics For Year 2005 (Based on 2 partial tracts)
A) FHA, FSA/RHS & VA Home Purchase Loans
B) Conventional Home Purchase Loans
C) Refinancings
D) Home Improvement Loans
F) Non-occupant Loans on < 5 Family Dwellings (A B C & D)
G) Loans On Manufactured Home Dwelling (A B C & D)
Number
Average Value
Number
Average Value
Number
Average Value
Number
Average Value
Number
Average Value
Number
Average Value
LOANS ORIGINATED
10
$123,485
64
$109,668
39
$124,884
16
$62,988
2
$131,770
2
$63,420
APPLICATIONS APPROVED, NOT ACCEPTED
1
$71,240
12
$73,221
5
$87,576
1
$74,720
1
$38,810
3
$63,133
APPLICATIONS DENIED
2
$83,405
27
$73,966
30
$110,357
10
$38,633
2
$90,645
14
$50,639
APPLICATIONS WITHDRAWN
0
$0
4
$84,998
20
$134,722
3
$118,157
1
$17,380
1
$40,540
FILES CLOSED FOR INCOMPLETENESS
0
$0
1
$149,430
4
$179,698
1
$163,910
0
$0
0
$0
Aggregated Statistics For Year 2004 (Based on 2 partial tracts)
A) FHA, FSA/RHS & VA Home Purchase Loans
B) Conventional Home Purchase Loans
C) Refinancings
D) Home Improvement Loans
F) Non-occupant Loans on < 5 Family Dwellings (A B C & D)
G) Loans On Manufactured Home Dwelling (A B C & D)


 Nearest zip codes: 79530, 79562, 79508, 79519, 79606, 79538.


 : $1,440,714 in 6 contracts from 2004 to 2005


