Estimated zip code population in 2022: 2,608 Zip code population in 2010: 2,197 Zip code population in 2000: 1,798
Houses and condos: 1,014 Renter-occupied apartments: 101
% of renters here:
10%
State:
38%
March 2022 cost of living index in zip code 79758: 78.3 (low, U.S. average is 100)
Land area: 52.8 sq. mi. Water area: 0.2 sq. mi.
Population density: 49 people per square mile
(very low).
OSM Map
General Map
Google Map
MSN Map
OSM Map
General Map
Google Map
MSN Map
OSM Map
General Map
Google Map
MSN Map
OSM Map
General Map
Google Map
MSN Map
Please wait while loading the map...
Real estate property taxes paid for housing units in 2022:
This zip code:
1.0% ($4,475)
Texas:
1.5% ($4,050)
Median real estate property taxes paid for housing units with mortgages in 2022: $6,285 (1.2%) Median real estate property taxes paid for housing units with no mortgage in 2022: $4,407 (1.2%)
Business Search- 14 Million verified businesses
Males: 1,336
(51.2%)
Females: 1,272
(48.8%)
For population 25 years and over in 79758:
High school or higher: 92.0%
Bachelor's degree or higher: 20.9%
Graduate or professional degree: 6.5%
Mean travel time to work (commute): 31.6 minutes
For population 15 years and over in 79758:
Never married: 17.1%
Now married: 73.8%
Separated: 1.6%
Widowed: 6.0%
Divorced: 1.5%
Zip code 79758 compared to state average:
Median household income above state average.
Median house value above state average.
Unemployed percentage significantly below state average.
Black race population percentage significantly below state average.
Foreign-born population percentage below state average.
Renting percentage significantly below state average.
Length of stay since moving in significantly below state average.
House age below state average.
Number of college students significantly below state average.
Percentage of population with a bachelor's degree or higher below state average.
Averages for the 2020 tax year for zip code 79758, filed in 2021:
Average Adjusted Gross Income (AGI) in 2020: $82,839 (Individual Income Tax Returns)
Here:
$82,839
State:
$77,054
Salary/wage: $72,028 (reported on 86.1% of returns)
Here:
$72,028
State:
$62,766
(% of AGI for various income ranges: 1465.8% for AGIs below $25k, 3740.0% for AGIs $25k-50k, 6892.2% for AGIs $50k-75k, 9935.8% for AGIs $75k-100k, 17710.5% for AGIs $100k-200k, 72600.0% for AGIs over 200k)
Taxable interest for individuals: $686 (reported on 21.2% of returns)
This zip code:
$686
Texas:
$2,665
(% of AGI for various income ranges: 3.8% for AGIs below $25k, 1.7% for AGIs $25k-50k, 2.8% for AGIs $50k-75k, 5.0% for AGIs $75k-100k, 30.5% for AGIs $100k-200k, 585.0% for AGIs over 200k)
Ordinary dividends: $2,091 (reported on 8.0% of returns)
Here:
$2,091
State:
$10,044
(% of AGI for various income ranges: 4.2% for AGIs below $25k, 33.9% for AGIs $50k-75k, 31.6% for AGIs $100k-200k, 495.0% for AGIs over 200k)
Net capital gain/loss in AGI: +$13,282 (reported on 8.0% of returns)
Here:
+$13,282
State:
+$39,590
(% of AGI for various income ranges: 38.3% for AGIs $50k-75k, 349.5% for AGIs $100k-200k, 3640.0% for AGIs over 200k)
Profit/loss from business: +$9,406 (reported on 23.4% of returns)
Here:
+$9,406
State:
+$10,888
(% of AGI for various income ranges: 125.0% for AGIs below $25k, 21.7% for AGIs $25k-50k, 340.8% for AGIs $75k-100k, 920.5% for AGIs $100k-200k, 2670.0% for AGIs over 200k)
Taxable individual retirement arrangement distribution: $20,871 (reported on 5.1% of returns)
79758:
$20,871
Texas:
$24,740
(% of AGI for various income ranges: 76.2% for AGIs below $25k, 299.4% for AGIs $50k-75k, 388.9% for AGIs $100k-200k)
Total itemized deductions: $35,225 (reported on 5.8% of returns)
Here:
$35,225
State:
$40,428
(% of AGI for various income ranges: 503.3% for AGIs $50k-75k, 1006.3% for AGIs $100k-200k)
Charity contributions: $18,860 (reported on 3.6% of returns)
Here:
$18,860
State:
$18,201
(% of AGI for various income ranges: 496.3% for AGIs $100k-200k)
Taxes paid: $6,075 (reported on 5.8% of returns)
79758:
$6,075
State:
$7,821
(% of AGI for various income ranges: 95.6% for AGIs $50k-75k, 165.3% for AGIs $100k-200k)
Earned income credit: $2,724 (reported on 15.3% of returns)
Here:
$2,724
State:
$2,584
(% of AGI for various income ranges: 157.9% for AGIs below $25k, 80.4% for AGIs $25k-50k)
Percentage of individuals using paid preparers for their 2020 taxes: 90.5%
Here:
91%
State:
92%
(% for various income ranges: 93.8% for AGIs below $25k, 89.7% for AGIs $25k-50k, 87.0% for AGIs $50k-75k, 88.2% for AGIs $75k-100k, 89.7% for AGIs $100k-200k, 100.0% for AGIs over 200k)
Averages for the 2012 tax year for zip code 79758, filed in 2013:
Average Adjusted Gross Income (AGI) in 2012: $88,763 (Individual Income Tax Returns)
Here:
$88,763
State:
$65,384
Salary/wage: $68,505 (reported on 89.5% of returns)
Here:
$68,505
State:
$52,524
(% of AGI for various income ranges: 77.4% for AGIs below $25k, 87.2% for AGIs $25k-50k, 87.7% for AGIs $50k-75k, 84.5% for AGIs $75k-100k, 88.2% for AGIs $100k-200k, 42.7% for AGIs over 200k)
Taxable interest for individuals: $470 (reported on 24.2% of returns)
This zip code:
$470
Texas:
$2,372
(% of AGI for various income ranges: 0.2% for AGIs below $25k, 0.1% for AGIs $50k-75k, 0.1% for AGIs $75k-100k, 0.2% for AGIs $100k-200k, 0.1% for AGIs over 200k)
Ordinary dividends: $2,455 (reported on 8.9% of returns)
Here:
$2,455
State:
$9,721
(% of AGI for various income ranges: 0.6% for AGIs below $25k, 0.5% for AGIs over 200k)
Net capital gain/loss in AGI: +$116,350 (reported on 8.1% of returns)
Here:
+$116,350
State:
+$35,319
(% of AGI for various income ranges: 0.3% for AGIs $50k-75k, 0.7% for AGIs $100k-200k, 26.1% for AGIs over 200k)
Profit/loss from business: +$19,021 (reported on 22.6% of returns)
Here:
+$19,021
State:
+$13,732
(% of AGI for various income ranges: 9.5% for AGIs below $25k, 5.8% for AGIs $25k-50k, 4.4% for AGIs $50k-75k, 5.5% for AGIs $75k-100k, 5.6% for AGIs $100k-200k, 3.6% for AGIs over 200k)
Taxable individual retirement arrangement distribution: $16,017 (reported on 4.8% of returns)
79758:
$16,017
Texas:
$19,511
Total itemized deductions: $25,307 (14% of AGI, reported on 21.8% of returns)
Here:
$25,307
State:
$24,724
Here:
13.6% of AGI
State:
15.9% of AGI
(% of AGI for various income ranges: 6.2% for AGIs $25k-50k, 5.7% for AGIs $50k-75k, 7.9% for AGIs $75k-100k, 9.1% for AGIs $100k-200k, 4.8% for AGIs over 200k)
Charity contributions: $11,317 (reported on 14.5% of returns)
Here:
$11,317
State:
$6,808
(% of AGI for various income ranges: 1.3% for AGIs below $25k, 0.9% for AGIs $50k-75k, 1.1% for AGIs $75k-100k, 1.8% for AGIs $100k-200k, 2.9% for AGIs over 200k)
Taxes paid: $4,281 (reported on 21.8% of returns)
79758:
$4,281
State:
$6,921
(% of AGI for various income ranges: 1.0% for AGIs $25k-50k, 1.1% for AGIs $50k-75k, 1.4% for AGIs $75k-100k, 1.5% for AGIs $100k-200k, 0.8% for AGIs over 200k)
Earned income credit: $2,335 (reported on 13.7% of returns)
Here:
$2,335
State:
$2,570
(% of AGI for various income ranges: 6.5% for AGIs below $25k, 1.3% for AGIs $25k-50k)
Percentage of individuals using paid preparers for their 2012 taxes: 58.1%
Here:
58%
State:
51%
(% for various income ranges: 50.0% for AGIs below $25k, 51.9% for AGIs $25k-50k, 61.9% for AGIs $50k-75k, 62.5% for AGIs $75k-100k, 63.2% for AGIs $100k-200k, 85.7% for AGIs over 200k)
Averages for the 2004 tax year for zip code 79758, filed in 2005:
Average Adjusted Gross Income (AGI) in 2004: $44,229 (Individual Income Tax Returns)
Here:
$44,229
State:
$47,881
Salary/wage: $40,450 (reported on 86.5% of returns)
Here:
$40,450
State:
$41,947
(% of AGI for various income ranges: 92.2% for AGIs below $10k, 78.3% for AGIs $10k-25k, 88.5% for AGIs $25k-50k, 85.1% for AGIs $50k-75k, 82.6% for AGIs $75k-100k, 63.8% for AGIs over 100k)
Taxable interest for individuals: $806 (reported on 31.8% of returns)
This zip code:
$806
Texas:
$2,255
(% of AGI for various income ranges: 0.9% for AGIs below $10k, 0.6% for AGIs $10k-25k, 0.6% for AGIs $25k-50k, 0.3% for AGIs $50k-75k, 0.5% for AGIs $75k-100k, 0.8% for AGIs over 100k)
Taxable dividends: $764 (reported on 11.4% of returns)
Here:
$764
State:
$4,261
(% of AGI for various income ranges: 1.6% for AGIs below $10k, 0.1% for AGIs $10k-25k, 0.1% for AGIs $25k-50k, 0.0% for AGIs $50k-75k, 0.1% for AGIs $75k-100k, 0.4% for AGIs over 100k)
Net capital gain/loss: +$2,707 (reported on 10.5% of returns)
Here:
+$2,707
State:
+$16,110
(% of AGI for various income ranges: -1.0% for AGIs below $10k, -0.0% for AGIs $25k-50k, 0.2% for AGIs $50k-75k, 0.1% for AGIs $75k-100k, 2.2% for AGIs over 100k)
Profit/loss from business: +$10,324 (reported on 22.9% of returns)
Here:
+$10,324
State:
+$11,013
(% of AGI for various income ranges: -1.0% for AGIs below $10k, 11.5% for AGIs $10k-25k, 4.7% for AGIs $25k-50k, 6.2% for AGIs $50k-75k, 7.2% for AGIs $75k-100k, 1.9% for AGIs over 100k)
IRA payment deduction: $2,812 (reported on 2.1% of returns)
79758:
$2,812
Texas:
$3,120
Total itemized deductions: $17,266 (20% of AGI, reported on 19.7% of returns)
Here:
$17,266
State:
$19,631
Here:
20.1% of AGI
State:
18.9% of AGI
(% of AGI for various income ranges: 6.2% for AGIs $10k-25k, 5.2% for AGIs $25k-50k, 10.1% for AGIs $50k-75k, 9.5% for AGIs $75k-100k, 6.8% for AGIs over 100k)
Charity contributions deductions: $5,000 (6% of AGI, reported on 15.3% of returns)
Here:
$5,000
State:
$4,753
Here:
5.6% of AGI
State:
4.2% of AGI
(% of AGI for various income ranges: 0.6% for AGIs $10k-25k, 0.3% for AGIs $25k-50k, 2.1% for AGIs $50k-75k, 2.5% for AGIs $75k-100k, 2.2% for AGIs over 100k)
Total tax: $6,463 (reported on 77.8% of returns)
79758:
$6,463
State:
$9,058
(% of AGI for various income ranges: 3.8% for AGIs below $10k, 5.2% for AGIs $10k-25k, 7.5% for AGIs $25k-50k, 9.1% for AGIs $50k-75k, 11.6% for AGIs $75k-100k, 18.6% for AGIs over 100k)
Earned income credit: $1,734 (reported on 15.9% of returns)
Here:
$1,734
State:
$2,024
Percentage of individuals using paid preparers for their 2004 taxes: 54.2%
Here:
54%
State:
57%
(% for various income ranges: 39.4% for AGIs below $10k, 57.4% for AGIs $10k-25k, 54.2% for AGIs $25k-50k, 58.4% for AGIs $50k-75k, 64.7% for AGIs $75k-100k, 62.5% for AGIs over 100k)
Household received Food Stamps/SNAP in the past 12 months: 8 Household did not receive Food Stamps/SNAP in the past 12 months: 953
Women who had a birth in the past 12 months: 34 (34 now married, 0 unmarried) Women who did not have a birth in the past 12 months: 600 (438 now married, 156 unmarried)
Housing units in zip code 79758 with a mortgage: 297 Median monthly owner costs for units with a mortgage: $2,610 Median monthly owner costs for units without a mortgage: $1,074
Residents with income below the poverty level in 2022:
This zip code:
0.8%
Whole state:
14.0%
Median number of rooms in houses and condos:
Here:
6.0
State:
6.3
Notable locations in this zip code not listed on our city pages
Notable locations in zip code 79758: Four Section Windmill (A), North Whittenburg Windmill (B), Pear Tree Windmill (C), Ratliff Ranch (D), Southeast Windmill (E), West Section Windmill (F), West Windmill (G), Windmill Number Sixtyeight (H), Windmill Number Seven (I), Windmill Number Eight (J), Gardendale Volunteer Fire Department (K). Display/hide their locations on the map
In group quarters: 11 (-1 institutionalized population)
Size of family households: 302 2-persons, 219 3-persons, 240 4-persons, 20 5-persons, 40 6-persons
Size of nonfamily households: 135 1-person
646 married couples with children.
109 single-parent households (53 men, 56 women).
79.7% of residents of 79758 zip code speak English at home.
17.4% of residents speak Spanish at home (33% very well, 67% well).
2.2% of residents speak other Indo-European language at home (35% very well, 7% well, 58% not well).
0.2% of residents speak Asian or Pacific Island language at home (100% very well).
Foreign born population: 229 (8.8%) (52.4% of them are naturalized citizens)
This zip code:
8.8%
Whole state:
17.2%
47%Honduras
16%Iran
2%Syria
1%Russia
24%English
12%American
5%Canadian
5%Irish
4%German
4%Italian
3%Norwegian
Year of entry for the foreign-born population
1352010 or later
1052000 to 2009
01990 to 1999
0Before 1990
Housing units lacking complete plumbing facilities: 1.2% Housing units lacking complete kitchen facilities: 1.2%
75.1%Electricity
24.8%Bottled, tank, or LP gas
Population in 1990: 1,536. Population change in the 1990s: +262 (+17.1%).
Place of birth for U.S.-born residents:
This state: 1,624
Midwest: 126
South: 215
West: 425
52% of the 79758 zip code residents lived in the same house 5 years ago. Out of people who lived in different houses, 62% lived in this county. Out of people who lived in different counties, 50% lived in Texas.
89% of the 79758 zip code residents lived in the same house 1 year ago. Out of people who lived in different houses, 65% moved from this county. Out of people who lived in different houses, 15% moved from different state. Out of people who lived in different houses, 19% moved from abroad.
Private vs. public school enrollment:
Students in private schools in grades 1 to 8 (elementary and middle school): 157
Here:
38.2%
Texas:
8.8%
Students in private schools in grades 9 to 12 (high school): 7
Here:
7.4%
Texas:
8.0%
Students in private undergraduate colleges:
Here:
0.0%
Texas:
16.2%
Occupation by median earnings in the past 12 months ($)
118,990Management occupations
118,575Sales and related occupations
99,513Office and administrative support occupations
56,534Construction and extraction occupations
Top industries in this zip code by the number of employees in 2005:
Mining: Support Activities for Oil and Gas Operations (20-49 employees: 1 establishment, 1-4 employees: 1 establishment)
Mining: Natural Gas Liquid Extraction (20-49: 1)
Administrative and Support and Waste Management and Remediation Services: Septic Tank and Related Services (10-19: 1)
Professional, Scientific, and Technical Services: Surveying and Mapping (except Geophysical) Services (5-9: 1)
Professional, Scientific, and Technical Services: Veterinary Services (5-9: 1)
Other Services (except Public Administration): Car Washes (5-9: 1)
Other Services (except Public Administration): Commercial and Industrial Machinery and Equipment (except Automotive and Electronic) Repair and Maintenance (1-4: 1)
Finance and Insurance: Insurance Agencies and Brokerages (1-4: 1)
Professional, Scientific, and Technical Services: Engineering Services (1-4: 1)
Fatal accident statistics in 2014:
Fatal accident count: 3
Vehicles involved in fatal accidents: 5
Fatal accidents caused by drunken drivers: 1
Fatalities: 3
Persons involved in fatal accidents: 5
Pedestrians involved in fatal accidents: 0
Fatal accident statistics in 2013:
Fatal accident count: 1
Vehicles involved in fatal accidents: 2
Fatal accidents caused by drunken drivers: 0
Fatalities: 2
Persons involved in fatal accidents: 2
Pedestrians involved in fatal accidents: 0
Home Mortgage Disclosure Act Aggregated Statistics For Year 2009 (Based on 4 partial tracts)
A) FHA, FSA/RHS & VA Home Purchase Loans
B) Conventional Home Purchase Loans
C) Refinancings
D) Home Improvement Loans
F) Non-occupant Loans on < 5 Family Dwellings (A B C & D)
G) Loans On Manufactured Home Dwelling (A B C & D)
Number
Average Value
Number
Average Value
Number
Average Value
Number
Average Value
Number
Average Value
Number
Average Value
LOANS ORIGINATED
53
$165,956
54
$225,426
77
$191,374
10
$51,856
7
$155,869
13
$77,135
APPLICATIONS APPROVED, NOT ACCEPTED
3
$133,623
10
$120,308
6
$132,305
0
$0
1
$66,120
7
$81,860
APPLICATIONS DENIED
4
$220,068
21
$177,754
23
$203,753
12
$30,478
1
$34,280
15
$58,070
APPLICATIONS WITHDRAWN
2
$239,365
4
$108,338
17
$170,085
2
$88,835
0
$0
2
$34,690
FILES CLOSED FOR INCOMPLETENESS
2
$240,290
2
$133,015
4
$171,722
0
$0
0
$0
1
$157,950
Aggregated Statistics For Year 2008 (Based on 4 partial tracts)
A) FHA, FSA/RHS & VA Home Purchase Loans
B) Conventional Home Purchase Loans
C) Refinancings
D) Home Improvement Loans
F) Non-occupant Loans on < 5 Family Dwellings (A B C & D)
G) Loans On Manufactured Home Dwelling (A B C & D)
Number
Average Value
Number
Average Value
Number
Average Value
Number
Average Value
Number
Average Value
Number
Average Value
LOANS ORIGINATED
29
$167,748
78
$173,658
40
$190,488
11
$70,501
9
$103,804
14
$74,096
APPLICATIONS APPROVED, NOT ACCEPTED
2
$127,670
12
$240,335
2
$255,390
4
$21,370
0
$0
5
$56,568
APPLICATIONS DENIED
6
$161,933
28
$180,011
29
$206,939
25
$40,286
0
$0
15
$71,393
APPLICATIONS WITHDRAWN
4
$115,092
8
$196,821
13
$179,035
3
$29,407
0
$0
1
$39,180
FILES CLOSED FOR INCOMPLETENESS
1
$117,540
2
$276,100
3
$185,260
1
$6,180
1
$81,420
1
$3,060
Aggregated Statistics For Year 2007 (Based on 4 partial tracts)
A) FHA, FSA/RHS & VA Home Purchase Loans
B) Conventional Home Purchase Loans
C) Refinancings
D) Home Improvement Loans
F) Non-occupant Loans on < 5 Family Dwellings (A B C & D)
G) Loans On Manufactured Home Dwelling (A B C & D)
Number
Average Value
Number
Average Value
Number
Average Value
Number
Average Value
Number
Average Value
Number
Average Value
LOANS ORIGINATED
10
$144,932
84
$168,151
32
$146,547
14
$54,520
8
$59,791
11
$56,451
APPLICATIONS APPROVED, NOT ACCEPTED
1
$106,780
15
$173,349
8
$109,525
3
$46,923
0
$0
6
$47,477
APPLICATIONS DENIED
2
$105,605
39
$89,983
21
$128,336
22
$53,134
1
$36,730
26
$45,993
APPLICATIONS WITHDRAWN
2
$127,845
5
$116,732
14
$193,536
3
$94,790
1
$143,250
1
$34,900
FILES CLOSED FOR INCOMPLETENESS
0
$0
3
$235,457
7
$168,104
1
$11,410
0
$0
1
$30,610
Aggregated Statistics For Year 2006 (Based on 4 partial tracts)
A) FHA, FSA/RHS & VA Home Purchase Loans
B) Conventional Home Purchase Loans
C) Refinancings
D) Home Improvement Loans
F) Non-occupant Loans on < 5 Family Dwellings (A B C & D)
G) Loans On Manufactured Home Dwelling (A B C & D)
Number
Average Value
Number
Average Value
Number
Average Value
Number
Average Value
Number
Average Value
Number
Average Value
LOANS ORIGINATED
8
$82,191
73
$115,425
28
$118,413
11
$32,448
5
$85,878
10
$52,091
APPLICATIONS APPROVED, NOT ACCEPTED
0
$0
12
$100,882
6
$119,948
2
$57,215
0
$0
5
$44,936
APPLICATIONS DENIED
1
$67,950
29
$115,396
20
$115,873
12
$47,330
2
$37,650
15
$46,167
APPLICATIONS WITHDRAWN
0
$0
16
$91,681
16
$105,883
4
$71,290
1
$62,440
4
$48,975
FILES CLOSED FOR INCOMPLETENESS
0
$0
2
$132,485
9
$124,750
1
$75,910
0
$0
0
$0
Aggregated Statistics For Year 2005 (Based on 4 partial tracts)
A) FHA, FSA/RHS & VA Home Purchase Loans
B) Conventional Home Purchase Loans
C) Refinancings
D) Home Improvement Loans
F) Non-occupant Loans on < 5 Family Dwellings (A B C & D)
G) Loans On Manufactured Home Dwelling (A B C & D)
Number
Average Value
Number
Average Value
Number
Average Value
Number
Average Value
Number
Average Value
Number
Average Value
LOANS ORIGINATED
10
$117,294
67
$103,197
29
$116,657
6
$51,582
4
$78,515
6
$51,833
APPLICATIONS APPROVED, NOT ACCEPTED
0
$0
12
$74,782
7
$131,377
4
$33,770
2
$24,490
5
$32,942
APPLICATIONS DENIED
1
$36,120
30
$58,323
27
$74,543
12
$34,466
4
$50,515
21
$45,882
APPLICATIONS WITHDRAWN
1
$107,130
13
$102,156
14
$171,079
6
$339,147
2
$95,360
2
$38,570
FILES CLOSED FOR INCOMPLETENESS
0
$0
5
$99,852
8
$120,771
0
$0
0
$0
0
$0
Aggregated Statistics For Year 2004 (Based on 4 partial tracts)
A) FHA, FSA/RHS & VA Home Purchase Loans
B) Conventional Home Purchase Loans
C) Refinancings
D) Home Improvement Loans
F) Non-occupant Loans on < 5 Family Dwellings (A B C & D)
G) Loans On Manufactured Home Dwelling (A B C & D)
Number
Average Value
Number
Average Value
Number
Average Value
Number
Average Value
Number
Average Value
Number
Average Value
LOANS ORIGINATED
11
$84,435
47
$90,188
45
$107,369
4
$60,432
4
$56,308
11
$37,805
APPLICATIONS APPROVED, NOT ACCEPTED
0
$0
10
$59,319
5
$64,048
1
$45,910
0
$0
8
$37,996
APPLICATIONS DENIED
1
$111,420
31
$46,227
36
$63,289
11
$28,515
2
$48,825
30
$35,067
APPLICATIONS WITHDRAWN
0
$0
7
$66,494
17
$77,245
2
$24,490
1
$10,410
0
$0
FILES CLOSED FOR INCOMPLETENESS
0
$0
1
$73,540
7
$91,820
0
$0
1
$36,730
0
$0
Aggregated Statistics For Year 2003 (Based on 4 partial tracts)
A) FHA, FSA/RHS & VA Home Purchase Loans
B) Conventional Home Purchase Loans
C) Refinancings
D) Home Improvement Loans
E) Loans on Dwellings For 5+ Families
F) Non-occupant Loans on < 5 Family Dwellings (A B C & D)
Number
Average Value
Number
Average Value
Number
Average Value
Number
Average Value
Number
Average Value
Number
Average Value
LOANS ORIGINATED
11
$86,563
39
$89,219
93
$90,600
6
$37,475
1
$126,200
3
$47,883
APPLICATIONS APPROVED, NOT ACCEPTED
1
$24,490
6
$102,888
8
$86,070
1
$48,030
0
$0
1
$56,400
APPLICATIONS DENIED
1
$37,020
22
$42,225
44
$59,799
6
$20,152
0
$0
1
$72,120
APPLICATIONS WITHDRAWN
1
$90,010
2
$109,835
26
$82,343
0
$0
0
$0
1
$35,840
FILES CLOSED FOR INCOMPLETENESS
1
$48,360
1
$17,750
2
$53,995
0
$0
0
$0
0
$0
Aggregated Statistics For Year 2002 (Based on 4 partial tracts)
A) FHA, FSA/RHS & VA Home Purchase Loans
B) Conventional Home Purchase Loans
C) Refinancings
D) Home Improvement Loans
F) Non-occupant Loans on < 5 Family Dwellings (A B C & D)
Number
Average Value
Number
Average Value
Number
Average Value
Number
Average Value
Number
Average Value
LOANS ORIGINATED
13
$73,789
41
$90,538
41
$94,407
6
$24,195
5
$95,240
APPLICATIONS APPROVED, NOT ACCEPTED
1
$21,430
6
$60,397
5
$86,716
2
$14,385
0
$0
APPLICATIONS DENIED
2
$33,605
20
$50,008
20
$62,500
7
$15,034
2
$16,335
APPLICATIONS WITHDRAWN
0
$0
4
$73,890
14
$77,712
3
$22,210
0
$0
FILES CLOSED FOR INCOMPLETENESS
0
$0
2
$93,875
1
$63,880
0
$0
0
$0
Aggregated Statistics For Year 2001 (Based on 4 partial tracts)
A) FHA, FSA/RHS & VA Home Purchase Loans
B) Conventional Home Purchase Loans
C) Refinancings
D) Home Improvement Loans
F) Non-occupant Loans on < 5 Family Dwellings (A B C & D)
Number
Average Value
Number
Average Value
Number
Average Value
Number
Average Value
Number
Average Value
LOANS ORIGINATED
14
$75,498
47
$100,033
37
$97,924
9
$13,711
4
$61,982
APPLICATIONS APPROVED, NOT ACCEPTED
0
$0
9
$47,599
8
$83,545
1
$36,440
1
$41,020
APPLICATIONS DENIED
2
$88,720
40
$43,126
13
$48,222
9
$12,559
2
$40,700
APPLICATIONS WITHDRAWN
1
$100,730
3
$96,930
10
$70,816
2
$11,690
0
$0
FILES CLOSED FOR INCOMPLETENESS
2
$55,545
1
$214,880
2
$121,335
1
$12,240
0
$0
Aggregated Statistics For Year 2000 (Based on 4 partial tracts)
A) FHA, FSA/RHS & VA Home Purchase Loans
B) Conventional Home Purchase Loans
C) Refinancings
D) Home Improvement Loans
F) Non-occupant Loans on < 5 Family Dwellings (A B C & D)
Number
Average Value
Number
Average Value
Number
Average Value
Number
Average Value
Number
Average Value
LOANS ORIGINATED
9
$76,810
44
$78,515
12
$97,228
3
$11,923
3
$22,883
APPLICATIONS APPROVED, NOT ACCEPTED
1
$44,870
15
$54,439
2
$125,500
2
$5,510
1
$9,180
APPLICATIONS DENIED
1
$48,300
51
$38,376
15
$46,426
6
$26,517
2
$29,690
APPLICATIONS WITHDRAWN
0
$0
6
$112,960
2
$68,550
1
$15,310
0
$0
FILES CLOSED FOR INCOMPLETENESS
0
$0
1
$15,310
4
$40,212
0
$0
0
$0
Aggregated Statistics For Year 1999 (Based on 2 partial tracts)
A) FHA, FSA/RHS & VA Home Purchase Loans
B) Conventional Home Purchase Loans
C) Refinancings
D) Home Improvement Loans
F) Non-occupant Loans on < 5 Family Dwellings (A B C & D)
Detailed PMIC statistics for the following Tracts:0025.01
, 0030.00
2003 - 2018 National Fire Incident Reporting System (NFIRS) incidents
According to the data from the years 2003 - 2018 the average number of fires per year is 7. The highest number of fire incidents - 15 took place in 2011, and the least - 2 in 2015. The data has a growing trend.
When looking into fire subcategories, the most reports belonged to: Outside Fires (49.5%), and Structure Fires (34.9%).
Fire incident types reported to NFIRS in Zip Code 79758

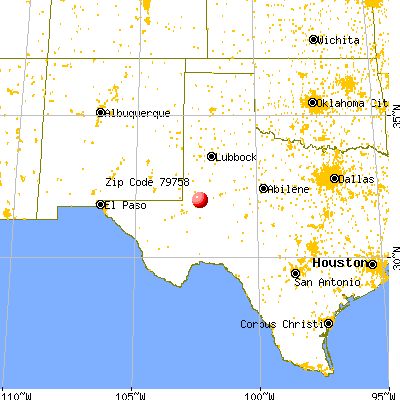


 Nearest zip codes: 79762, 79765, 79761, 79707, 79703, 79763.


 According to the data from the years 2003 - 2018 the average number of fires per year is 7. The highest number of fire incidents - 15 took place in 2011, and the least - 2 in 2015. The data has a growing trend.
 When looking into fire subcategories, the most reports belonged to: Outside Fires (49.5%), and Structure Fires (34.9%).