Estimated zip code population in 2022: 390 Zip code population in 2010: 288 Zip code population in 2000: 281
Houses and condos: 154 Renter-occupied apartments: 22
% of renters here:
16%
State:
38%
March 2022 cost of living index in zip code 79741: 77.4 (low, U.S. average is 100)
Land area: 209.7 sq. mi. Water area: 1.2 sq. mi.
Population density: 2 people per square mile
(very low).
OSM Map
General Map
Google Map
MSN Map
OSM Map
General Map
Google Map
MSN Map
OSM Map
General Map
Google Map
MSN Map
OSM Map
General Map
Google Map
MSN Map
Please wait while loading the map...
Real estate property taxes paid for housing units in 2022:
This zip code:
0.6% ($1,451)
Texas:
1.5% ($4,050)
Median real estate property taxes paid for housing units with mortgages in 2022: $1,328 (0.5%) Median real estate property taxes paid for housing units with no mortgage in 2022: $2,165 (1.3%)
Business Search- 14 Million verified businesses
Males: 179
(46.1%)
Females: 210
(53.9%)
For population 25 years and over in 79741:
High school or higher: 87.8%
Bachelor's degree or higher: 18.7%
Graduate or professional degree: 6.0%
Unemployed: 2.5%
Mean travel time to work (commute): 29.6 minutes
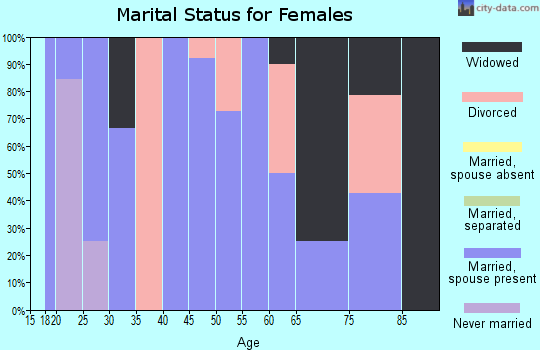
For population 15 years and over in 79741:
Never married: 41.3%
Now married: 40.1%
Separated: 0.0%
Widowed: 12.5%
Divorced: 6.2%
Zip code 79741 compared to state average:
Unemployed percentage below state average.
Black race population percentage significantly below state average.
Foreign-born population percentage significantly below state average.
Renting percentage significantly below state average.
Length of stay since moving in significantly above state average.
Percentage of population with a bachelor's degree or higher below state average.
Averages for the 2020 tax year for zip code 79741, filed in 2021:
Average Adjusted Gross Income (AGI) in 2020: $58,525 (Individual Income Tax Returns)
Here:
$58,525
State:
$77,054
Salary/wage: $49,673 (reported on 75.0% of returns)
Here:
$49,673
State:
$62,766
(% of AGI for various income ranges: 822.5% for AGIs below $25k, 3448.0% for AGIs $25k-50k, 6112.0% for AGIs $50k-75k)
Taxable interest for individuals: $133 (reported on 15.0% of returns)
This zip code:
$133
Texas:
$2,665
(% of AGI for various income ranges: 8.0% for AGIs $50k-75k)
Profit/loss from business: +$10,625 (reported on 20.0% of returns)
Here:
+$10,625
State:
+$10,888
(% of AGI for various income ranges: 850.0% for AGIs $25k-50k)
Earned income credit: $2,650 (reported on 20.0% of returns)
Here:
$2,650
State:
$2,584
(% of AGI for various income ranges: 265.0% for AGIs below $25k)
Percentage of individuals using paid preparers for their 2020 taxes: 85.0%
Here:
85%
State:
92%
(% for various income ranges: 83.3% for AGIs below $25k, 83.3% for AGIs $25k-50k, 100.0% for AGIs $50k-75k, 66.7% for AGIs $100k-200k)
Averages for the 2012 tax year for zip code 79741, filed in 2013:
Average Adjusted Gross Income (AGI) in 2012: $89,831 (Individual Income Tax Returns)
Here:
$89,831
State:
$65,384
Salary/wage: $59,193 (reported on 87.5% of returns)
Here:
$59,193
State:
$52,524
(% of AGI for various income ranges: 78.1% for AGIs below $25k, 80.2% for AGIs $25k-50k, 87.3% for AGIs $50k-75k, 44.0% for AGIs $100k-200k)
Taxable interest for individuals: $750 (reported on 25.0% of returns)
This zip code:
$750
Texas:
$2,372
Profit/loss from business: +$8,600 (reported on 12.5% of returns)
Here:
+$8,600
State:
+$13,732
Earned income credit: $2,350 (reported on 12.5% of returns)
Here:
$2,350
State:
$2,570
(% of AGI for various income ranges: 8.4% for AGIs below $25k)
Percentage of individuals using paid preparers for their 2012 taxes: 56.2%
Here:
56%
State:
51%
(% for various income ranges: 100.0% for AGIs below $25k, 50.0% for AGIs $50k-75k, 75.0% for AGIs $100k-200k)
Averages for the 2004 tax year for zip code 79741, filed in 2005:
Average Adjusted Gross Income (AGI) in 2004: $33,808 (Individual Income Tax Returns)
Here:
$33,808
State:
$47,881
Salary/wage: $32,830 (reported on 81.5% of returns)
Here:
$32,830
State:
$41,947
(% of AGI for various income ranges: 94.8% for AGIs below $10k, 76.8% for AGIs $10k-25k, 97.1% for AGIs $25k-50k, 91.2% for AGIs $50k-75k, 50.6% for AGIs $75k-100k)
Taxable interest for individuals: $300 (reported on 30.8% of returns)
This zip code:
$300
Texas:
$2,255
(% of AGI for various income ranges: 1.9% for AGIs $10k-25k, 0.1% for AGIs $50k-75k, 0.2% for AGIs $75k-100k)
Taxable dividends: $750 (reported on 12.3% of returns)
Here:
$750
State:
$4,261
Total itemized deductions: $8,800 (20% of AGI, reported on 7.7% of returns)
Here:
$8,800
State:
$19,631
Here:
20.1% of AGI
State:
18.9% of AGI
Total tax: $5,011 (reported on 66.9% of returns)
79741:
$5,011
State:
$9,058
(% of AGI for various income ranges: 5.0% for AGIs $10k-25k, 6.4% for AGIs $25k-50k, 10.3% for AGIs $50k-75k, 15.0% for AGIs $75k-100k)
Earned income credit: $1,400 (reported on 23.1% of returns)
Here:
$1,400
State:
$2,024
Percentage of individuals using paid preparers for their 2004 taxes: 70.0%
Here:
70%
State:
57%
(% for various income ranges: 57.5% for AGIs below $10k, 75.0% for AGIs $10k-25k, 76.7% for AGIs $25k-50k, 122.7% for AGIs $50k-75k)
Household received Food Stamps/SNAP in the past 12 months: 0 Household did not receive Food Stamps/SNAP in the past 12 months: 139
Women who did not have a birth in the past 12 months: 116 (38 now married, 78 unmarried)
Housing units in zip code 79741 with a mortgage: 71 Median monthly owner costs for units with a mortgage: $1,784 Median monthly owner costs for units without a mortgage: $930
Residents with income below the poverty level in 2022:
This zip code:
10.6%
Whole state:
14.0%
Residents with income below 50% of the poverty level in 2022:
This zip code:
1.0%
Whole state:
7.4%
Median number of rooms in houses and condos:
Here:
6.0
State:
6.3
Median number of rooms in apartments:
Here:
4.9
State:
4.0
Notable locations in this zip code not listed on our city pages
Notable locations in zip code 79741: Three Section Windmill (A), Alley Oople Windmill (B), Bull Pasture Windmill (C), Bum Windmill (D), Cherry Windmill (E), Cole Ranch (F), Collins Windmill (G), Comanche Trails Camp (H), Conger Ranch (I), East Windmill (J), Flagg Ranch (K), Giffon Windmill (L), Goldsmith Plant (M), Green Windmill (N), Gulf Camp Windmill (O), New Windmill (P), North Burkett Windmill (Q), North Clyde Windmill (R), Northeast Windmill (S), Northwest Windmill (T). Display/hide their locations on the map
Lakes: Prairie Dog Lake (A), James Lake (B), Coyote Lake (C), Cheyenne Lake (D), Bum Lake (E), Antelope Lake (F), Embar Lake (G), Plover Lake (H). Display/hide their locations on the map
Size of family households: 31 2-persons, 35 3-persons, 46 4-persons, 6 5-persons
Size of nonfamily households: 18 1-person
38 married couples with children.
77 single-parent households (77 men).
71.1% of residents of 79741 zip code speak English at home.
28.4% of residents speak Spanish at home (94% very well, 6% well).
Foreign born population: 6 (1.8%) (0.0% of them are naturalized citizens)
:
1.8%
Whole state:
17.2%
86%Honduras
5%English
4%Scandinavian
Year of entry for the foreign-born population
02010 or later
62000 to 2009
01990 to 1999
0Before 1990
Facilities with environmental interests located in this zip code:
AIRCO INDUSTRIAL GASES (DIRT RD 7 MI NW OF in GOLDSMITH, TX)
(Resource Conservation and Recovery Act (tracking hazardous waste))
AMOCO EXPLORATION & PRODUCTION (8 MI. E. OF GOLDSMITH, TX., ON in GOLDSMITH, TX)
AIR MINOR (AIRS/AFS) Business SIC classification: NATURAL GAS LIQUIDS Alternative names: H.R. LEWIS
AND ECTOR COMPRESSOR STATION (10 M NW OF GOLDSMITH in GOLDSMITH, TX)
Conditionally Exempt Small Quantity Generators, less than 100 kg/month of hazardous waste (Resource Conservation and Recovery Act (tracking hazardous waste)) - notification Organizations: WESTAR TRANSMISSION (CONTACT/OWNER)
ARCO KLOH B LEASE (6M E & 1M S HWY 158 in GOLDSMITH, TX)
Conditionally Exempt Small Quantity Generators, less than 100 kg/month of hazardous waste (Resource Conservation and Recovery Act (tracking hazardous waste)) - notification Organizations: ARCO PERMIAN (CONTACT/OWNER)
Housing units lacking complete plumbing facilities: 7.1% Housing units lacking complete kitchen facilities: 3.0%
55.9%Electricity
44.5%Utility gas
Population in 1990: 442.
Place of birth for U.S.-born residents:
This state: 305
Northeast: 6
Midwest: 8
South: 27
West: 34
74% of the 79741 zip code residents lived in the same house 5 years ago. Out of people who lived in different houses, 60% lived in this county. Out of people who lived in different counties, 50% lived in Texas.
98% of the 79741 zip code residents lived in the same house 1 year ago. Out of people who lived in different houses, 17% moved from this county. Out of people who lived in different houses, 83% moved from different county within same state.
Private vs. public school enrollment:
Students in private schools in grades 1 to 8 (elementary and middle school):
Here:
0.0%
Texas:
8.8%
Students in private schools in grades 9 to 12 (high school):
Here:
0.0%
Texas:
8.0%
Students in private undergraduate colleges: 4
Here:
83.5%
Texas:
16.2%
Occupation by median earnings in the past 12 months ($)
63,420Construction and extraction occupations
62,751Office and administrative support occupations
28,761Material moving occupations
Top industries in this zip code by the number of employees in 2005:
Mining: Support Activities for Oil and Gas Operations (20-49 employees: 2 establishments, 5-9 employees: 2 establishments)
Mining: Natural Gas Liquid Extraction (50-99: 1)
Management of Companies and Enterprises: Corporate, Subsidiary, and Regional Managing Offices (10-19: 1)
Other Services (except Public Administration): Commercial and Industrial Machinery and Equipment (except Automotive and Electronic) Repair and Maintenance (5-9: 1, 1-4: 1)
Wholesale Trade: Industrial Machinery and Equipment Merchant Wholesalers (5-9: 1)
Accommodation and Food Services: Full-Service Restaurants (1-4: 1)
Fatal accident statistics in 2014:
Fatal accident count: 2
Vehicles involved in fatal accidents: 4
Fatal accidents caused by drunken drivers: 1
Fatalities: 2
Persons involved in fatal accidents: 5
Pedestrians involved in fatal accidents: 0
Fatal accident statistics in 2013:
Fatal accident count: 1
Vehicles involved in fatal accidents: 1
Fatal accidents caused by drunken drivers: 1
Fatalities: 1
Persons involved in fatal accidents: 1
Pedestrians involved in fatal accidents: 0
Home Mortgage Disclosure Act Aggregated Statistics For Year 2009 (Based on 2 partial tracts)
A) FHA, FSA/RHS & VA Home Purchase Loans
B) Conventional Home Purchase Loans
C) Refinancings
D) Home Improvement Loans
G) Loans On Manufactured Home Dwelling (A B C & D)
Number
Average Value
Number
Average Value
Number
Average Value
Number
Average Value
Number
Average Value
LOANS ORIGINATED
1
$117,680
1
$102,770
1
$134,890
0
$0
2
$54,140
APPLICATIONS APPROVED, NOT ACCEPTED
0
$0
0
$0
0
$0
0
$0
0
$0
APPLICATIONS DENIED
0
$0
1
$83,040
1
$157,600
1
$39,000
2
$48,635
APPLICATIONS WITHDRAWN
0
$0
0
$0
0
$0
0
$0
0
$0
FILES CLOSED FOR INCOMPLETENESS
0
$0
0
$0
0
$0
0
$0
0
$0
Aggregated Statistics For Year 2008 (Based on 2 partial tracts)
B) Conventional Home Purchase Loans
C) Refinancings
D) Home Improvement Loans
F) Non-occupant Loans on < 5 Family Dwellings (A B C & D)
G) Loans On Manufactured Home Dwelling (A B C & D)
Number
Average Value
Number
Average Value
Number
Average Value
Number
Average Value
Number
Average Value
LOANS ORIGINATED
3
$107,283
2
$65,840
1
$51,390
1
$26,150
1
$68,360
APPLICATIONS APPROVED, NOT ACCEPTED
0
$0
0
$0
0
$0
0
$0
0
$0
APPLICATIONS DENIED
3
$43,740
2
$82,010
2
$26,495
0
$0
3
$41,370
APPLICATIONS WITHDRAWN
0
$0
1
$79,830
1
$36,020
0
$0
0
$0
FILES CLOSED FOR INCOMPLETENESS
0
$0
0
$0
0
$0
0
$0
0
$0
Aggregated Statistics For Year 2007 (Based on 2 partial tracts)
B) Conventional Home Purchase Loans
C) Refinancings
D) Home Improvement Loans
G) Loans On Manufactured Home Dwelling (A B C & D)
Number
Average Value
Number
Average Value
Number
Average Value
Number
Average Value
LOANS ORIGINATED
4
$66,698
2
$70,310
1
$18,580
3
$46,720
APPLICATIONS APPROVED, NOT ACCEPTED
2
$61,365
0
$0
0
$0
1
$73,180
APPLICATIONS DENIED
4
$79,258
2
$95,430
1
$23,170
3
$58,190
APPLICATIONS WITHDRAWN
1
$60,330
1
$81,210
0
$0
0
$0
FILES CLOSED FOR INCOMPLETENESS
0
$0
0
$0
0
$0
0
$0
Aggregated Statistics For Year 2006 (Based on 2 partial tracts)
A) FHA, FSA/RHS & VA Home Purchase Loans
B) Conventional Home Purchase Loans
C) Refinancings
D) Home Improvement Loans
G) Loans On Manufactured Home Dwelling (A B C & D)
Number
Average Value
Number
Average Value
Number
Average Value
Number
Average Value
Number
Average Value
LOANS ORIGINATED
0
$0
4
$68,648
1
$31,430
1
$21,790
3
$40,987
APPLICATIONS APPROVED, NOT ACCEPTED
0
$0
3
$36,323
0
$0
0
$0
3
$30,280
APPLICATIONS DENIED
1
$24,090
7
$49,354
2
$90,730
1
$12,850
8
$46,310
APPLICATIONS WITHDRAWN
0
$0
1
$33,490
1
$202,100
0
$0
0
$0
FILES CLOSED FOR INCOMPLETENESS
0
$0
0
$0
0
$0
0
$0
0
$0
Aggregated Statistics For Year 2005 (Based on 2 partial tracts)
A) FHA, FSA/RHS & VA Home Purchase Loans
B) Conventional Home Purchase Loans
C) Refinancings
D) Home Improvement Loans
G) Loans On Manufactured Home Dwelling (A B C & D)
Number
Average Value
Number
Average Value
Number
Average Value
Number
Average Value
Number
Average Value
LOANS ORIGINATED
0
$0
4
$49,035
2
$40,720
0
$0
1
$58,040
APPLICATIONS APPROVED, NOT ACCEPTED
0
$0
2
$39,115
0
$0
0
$0
1
$72,260
APPLICATIONS DENIED
1
$45,420
7
$41,291
5
$50,238
2
$22,365
6
$34,372
APPLICATIONS WITHDRAWN
0
$0
0
$0
2
$128,235
1
$105,070
0
$0
FILES CLOSED FOR INCOMPLETENESS
0
$0
0
$0
0
$0
0
$0
0
$0
Aggregated Statistics For Year 2004 (Based on 2 partial tracts)
B) Conventional Home Purchase Loans
C) Refinancings
D) Home Improvement Loans
G) Loans On Manufactured Home Dwelling (A B C & D)
Number
Average Value
Number
Average Value
Number
Average Value
Number
Average Value
LOANS ORIGINATED
2
$26,725
2
$36,475
1
$22,020
2
$22,480
APPLICATIONS APPROVED, NOT ACCEPTED
3
$28,293
0
$0
0
$0
3
$34,717
APPLICATIONS DENIED
8
$36,504
5
$42,072
2
$25,695
7
$31,363
APPLICATIONS WITHDRAWN
0
$0
0
$0
0
$0
0
$0
FILES CLOSED FOR INCOMPLETENESS
0
$0
0
$0
0
$0
0
$0
Aggregated Statistics For Year 2003 (Based on 2 partial tracts)
B) Conventional Home Purchase Loans
C) Refinancings
D) Home Improvement Loans
Number
Average Value
Number
Average Value
Number
Average Value
LOANS ORIGINATED
2
$53,565
1
$76,390
0
$0
APPLICATIONS APPROVED, NOT ACCEPTED
2
$58,955
0
$0
0
$0
APPLICATIONS DENIED
5
$40,466
3
$68,590
1
$23,630
APPLICATIONS WITHDRAWN
0
$0
2
$34,410
0
$0
FILES CLOSED FOR INCOMPLETENESS
0
$0
0
$0
0
$0
Aggregated Statistics For Year 2002 (Based on 2 partial tracts)
B) Conventional Home Purchase Loans
C) Refinancings
D) Home Improvement Loans
Number
Average Value
Number
Average Value
Number
Average Value
LOANS ORIGINATED
1
$63,770
1
$40,830
0
$0
APPLICATIONS APPROVED, NOT ACCEPTED
0
$0
0
$0
0
$0
APPLICATIONS DENIED
2
$58,725
5
$39,044
1
$9,630
APPLICATIONS WITHDRAWN
0
$0
1
$77,770
0
$0
FILES CLOSED FOR INCOMPLETENESS
0
$0
0
$0
0
$0
Aggregated Statistics For Year 2001 (Based on 2 partial tracts)
A) FHA, FSA/RHS & VA Home Purchase Loans
B) Conventional Home Purchase Loans
C) Refinancings
D) Home Improvement Loans
Number
Average Value
Number
Average Value
Number
Average Value
Number
Average Value
LOANS ORIGINATED
1
$55,060
1
$59,640
1
$45,420
1
$15,370
APPLICATIONS APPROVED, NOT ACCEPTED
0
$0
1
$37,620
1
$83,960
0
$0
APPLICATIONS DENIED
0
$0
8
$42,496
2
$18,810
2
$16,400
APPLICATIONS WITHDRAWN
0
$0
0
$0
1
$43,820
0
$0
FILES CLOSED FOR INCOMPLETENESS
0
$0
0
$0
0
$0
0
$0
Aggregated Statistics For Year 2000 (Based on 2 partial tracts)
B) Conventional Home Purchase Loans
C) Refinancings
D) Home Improvement Loans
Number
Average Value
Number
Average Value
Number
Average Value
LOANS ORIGINATED
2
$35,215
1
$45,650
1
$8,260
APPLICATIONS APPROVED, NOT ACCEPTED
1
$38,310
1
$32,120
1
$25,000
APPLICATIONS DENIED
9
$33,748
1
$29,360
2
$10,895
APPLICATIONS WITHDRAWN
0
$0
0
$0
0
$0
FILES CLOSED FOR INCOMPLETENESS
0
$0
0
$0
0
$0
Aggregated Statistics For Year 1999 (Based on 1 partial tract)
B) Conventional Home Purchase Loans
C) Refinancings
D) Home Improvement Loans
F) Non-occupant Loans on < 5 Family Dwellings (A B C & D)

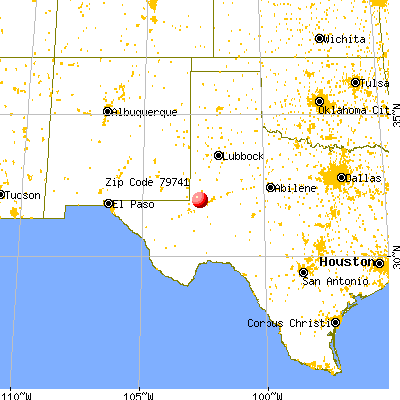


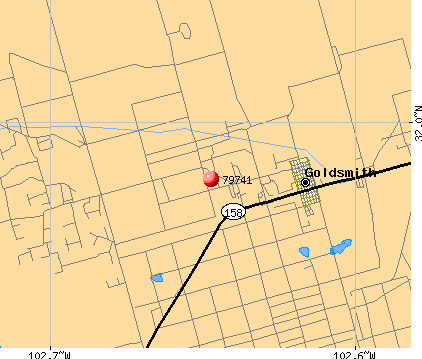 Nearest zip codes: 79764, 79759, 79763, 79762, 79761, 79758.