Estimated zip code population in 2022: 689 Zip code population in 2010: 946 Zip code population in 2000: 957
Houses and condos: 247 Renter-occupied apartments: 61
% of renters here:
24%
State:
34%
March 2022 cost of living index in zip code 80624: 99.3 (near average, U.S. average is 100)
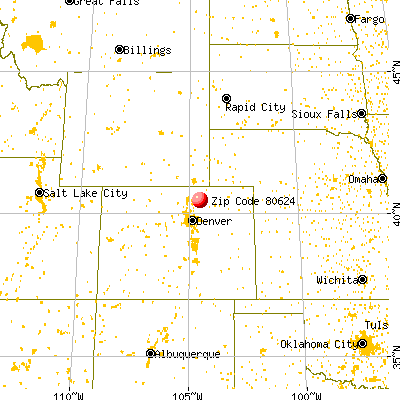
Land area: 31.4 sq. mi. Water area: 0.3 sq. mi.
Population density: 22 people per square mile
(very low).
OSM Map
General Map
Google Map
MSN Map
OSM Map
General Map
Google Map
MSN Map
OSM Map
General Map
Google Map
MSN Map
OSM Map
General Map
Google Map
MSN Map
Please wait while loading the map...
Real estate property taxes paid for housing units in 2022:
This zip code:
0.2% ($830)
Colorado:
0.5% ($2,422)
Median real estate property taxes paid for housing units with mortgages in 2022: $1,124 Median real estate property taxes paid for housing units with no mortgage in 2022: $751
Business Search- 14 Million verified businesses
Males: 416
(60.5%)
Females: 272
(39.5%)
For population 25 years and over in 80624:
High school or higher: 95.7%
Bachelor's degree or higher: 30.4%
Graduate or professional degree: 5.1%
Mean travel time to work (commute): 33.1 minutes
For population 15 years and over in 80624:
Never married: 18.9%
Now married: 72.9%
Separated: 1.7%
Widowed: 3.0%
Divorced: 3.5%
Zip code 80624 compared to state average:
Unemployed percentage significantly below state average.
Black race population percentage significantly below state average.
Hispanic race population percentage below state average.
Foreign-born population percentage significantly below state average.
Length of stay since moving in significantly above state average.
Estimated median house/condo value in 2022: $518,105
80624:
$518,105
Colorado:
$531,100
According to our research of Colorado and other state lists, there were 2 registered sex offenders living in 80624 zip code as of May 23, 2024. The ratio of all residents to sex offenders in zip code 80624 is 651 to 1. The ratio of registered sex offenders to all residents in this zip code is lower than the state average.
Median resident age:
This zip code:
39.2 years
Colorado median age:
37.7 years
Average household size:
This zip code:
2.8 people
Colorado:
2.4 people
Averages for the 2020 tax year for zip code 80624, filed in 2021:
Average Adjusted Gross Income (AGI) in 2020: $82,231 (Individual Income Tax Returns)
Here:
$82,231
State:
$89,260
Salary/wage: $63,079 (reported on 85.7% of returns)
Here:
$63,079
State:
$70,330
(% of AGI for various income ranges: 1371.4% for AGIs below $25k, 5040.0% for AGIs $25k-50k, 9138.0% for AGIs $50k-75k, 16810.0% for AGIs $75k-100k, 23410.0% for AGIs $100k-200k)
Taxable interest for individuals: $7,014 (reported on 28.6% of returns)
This zip code:
$7,014
Colorado:
$2,176
(% of AGI for various income ranges: 25.0% for AGIs $25k-50k, 76.0% for AGIs $50k-75k, 53.3% for AGIs $100k-200k)
Ordinary dividends: $2,320 (reported on 10.2% of returns)
Here:
$2,320
State:
$8,820
(% of AGI for various income ranges: 37.0% for AGIs $25k-50k, 263.3% for AGIs $100k-200k)
Net capital gain/loss in AGI: +$53,783 (reported on 12.2% of returns)
Here:
+$53,783
State:
+$37,276
(% of AGI for various income ranges: 218.0% for AGIs $25k-50k, 10030.0% for AGIs $100k-200k)
Profit/loss from business: +$5,350 (reported on 16.3% of returns)
Here:
+$5,350
State:
+$15,295
(% of AGI for various income ranges: 362.0% for AGIs $25k-50k, 220.0% for AGIs $100k-200k)
Total itemized deductions: $33,975 (reported on 8.2% of returns)
Here:
$33,975
State:
$35,141
(% of AGI for various income ranges: 391.0% for AGIs $25k-50k, 3226.7% for AGIs $100k-200k)
Charity contributions: $9,800 (reported on 6.1% of returns)
Here:
$9,800
State:
$12,103
(% of AGI for various income ranges: 1470.0% for AGIs $75k-100k)
Taxes paid: $6,375 (reported on 8.2% of returns)
80624:
$6,375
State:
$7,710
(% of AGI for various income ranges: 850.0% for AGIs $100k-200k)
Earned income credit: $2,460 (reported on 10.2% of returns)
Here:
$2,460
State:
$2,053
(% of AGI for various income ranges: 175.7% for AGIs below $25k)
Percentage of individuals using paid preparers for their 2020 taxes: 93.9%
Here:
94%
State:
93%
(% for various income ranges: 90.9% for AGIs below $25k, 93.3% for AGIs $25k-50k, 100.0% for AGIs $50k-75k, 100.0% for AGIs $75k-100k, 85.7% for AGIs $100k-200k, 100.0% for AGIs over 200k)
Averages for the 2012 tax year for zip code 80624, filed in 2013:
Average Adjusted Gross Income (AGI) in 2012: $65,289 (Individual Income Tax Returns)
Here:
$65,289
State:
$69,103
Salary/wage: $48,774 (reported on 84.8% of returns)
Here:
$48,774
State:
$54,794
(% of AGI for various income ranges: 75.1% for AGIs below $25k, 93.3% for AGIs $25k-50k, 83.7% for AGIs $50k-75k, 77.8% for AGIs $75k-100k, 46.8% for AGIs $100k-200k)
Taxable interest for individuals: $1,221 (reported on 30.4% of returns)
This zip code:
$1,221
Colorado:
$1,971
(% of AGI for various income ranges: 1.2% for AGIs $25k-50k, 0.7% for AGIs $50k-75k, 0.6% for AGIs $100k-200k)
Ordinary dividends: $800 (reported on 13.0% of returns)
Here:
$800
State:
$7,140
Net capital gain/loss in AGI: +$82,914 (reported on 15.2% of returns)
Here:
+$82,914
State:
+$23,009
Profit/loss from business: +$5,038 (reported on 17.4% of returns)
Here:
+$5,038
State:
+$13,514
(% of AGI for various income ranges: 9.3% for AGIs below $25k, 5.6% for AGIs $25k-50k, 0.2% for AGIs $75k-100k)
Total itemized deductions: $20,564 (17% of AGI, reported on 30.4% of returns)
Here:
$20,564
State:
$24,621
Here:
16.9% of AGI
State:
18.5% of AGI
(% of AGI for various income ranges: 11.7% for AGIs $25k-50k, 12.3% for AGIs $50k-75k, 11.7% for AGIs $75k-100k, 9.0% for AGIs $100k-200k)
Charity contributions: $3,255 (reported on 23.9% of returns)
Here:
$3,255
State:
$4,449
(% of AGI for various income ranges: 1.7% for AGIs $25k-50k, 0.9% for AGIs $75k-100k, 1.5% for AGIs $100k-200k)
Taxes paid: $5,879 (reported on 30.4% of returns)
80624:
$5,879
State:
$7,641
(% of AGI for various income ranges: 1.8% for AGIs $25k-50k, 2.1% for AGIs $50k-75k, 2.8% for AGIs $75k-100k, 3.4% for AGIs $100k-200k)
Earned income credit: $2,500 (reported on 15.2% of returns)
Here:
$2,500
State:
$2,095
(% of AGI for various income ranges: 6.1% for AGIs below $25k, 1.6% for AGIs $25k-50k)
Percentage of individuals using paid preparers for their 2012 taxes: 73.9%
Here:
74%
State:
49%
(% for various income ranges: 73.3% for AGIs below $25k, 72.7% for AGIs $25k-50k, 66.7% for AGIs $50k-75k, 60.0% for AGIs $75k-100k, 88.9% for AGIs $100k-200k)
Averages for the 2004 tax year for zip code 80624, filed in 2005:
Average Adjusted Gross Income (AGI) in 2004: $35,736 (Individual Income Tax Returns)
Here:
$35,736
State:
$55,014
Salary/wage: $34,677 (reported on 84.0% of returns)
Here:
$34,677
State:
$46,010
(% of AGI for various income ranges: 82.6% for AGIs $10k-25k, 91.9% for AGIs $25k-50k, 83.7% for AGIs $50k-75k, 88.2% for AGIs $75k-100k, 43.7% for AGIs over 100k)
Taxable interest for individuals: $836 (reported on 37.9% of returns)
This zip code:
$836
Colorado:
$2,127
(% of AGI for various income ranges: 1.3% for AGIs $10k-25k, 0.5% for AGIs $25k-50k, 1.4% for AGIs $50k-75k, 0.1% for AGIs over 100k)
Taxable dividends: $712 (reported on 14.0% of returns)
Here:
$712
State:
$3,782
Net capital gain/loss: +$3,414 (reported on 16.7% of returns)
Here:
+$3,414
State:
+$17,882
(% of AGI for various income ranges: 2.1% for AGIs $10k-25k, 0.9% for AGIs $25k-50k, 3.0% for AGIs $50k-75k)
Profit/loss from business: +$3,985 (reported on 15.7% of returns)
Here:
+$3,985
State:
+$11,247
(% of AGI for various income ranges: 2.2% for AGIs $10k-25k, 2.7% for AGIs $25k-50k, 2.6% for AGIs $50k-75k)
Total itemized deductions: $17,603 (22% of AGI, reported on 28.8% of returns)
Here:
$17,603
State:
$20,560
Here:
21.8% of AGI
State:
21.4% of AGI
(% of AGI for various income ranges: 5.8% for AGIs $10k-25k, 11.3% for AGIs $25k-50k, 19.8% for AGIs $50k-75k, 18.2% for AGIs $75k-100k, 12.3% for AGIs over 100k)
Charity contributions deductions: $2,443 (3% of AGI, reported on 23.1% of returns)
Here:
$2,443
State:
$3,518
Here:
2.8% of AGI
State:
3.4% of AGI
(% of AGI for various income ranges: 0.8% for AGIs $25k-50k, 2.7% for AGIs $50k-75k, 0.7% for AGIs $75k-100k, 2.2% for AGIs over 100k)
Total tax: $4,635 (reported on 64.5% of returns)
80624:
$4,635
State:
$9,173
(% of AGI for various income ranges: 3.3% for AGIs $10k-25k, 5.6% for AGIs $25k-50k, 6.8% for AGIs $50k-75k, 9.3% for AGIs $75k-100k, 12.7% for AGIs over 100k)
Earned income credit: $1,955 (reported on 21.2% of returns)
Here:
$1,955
State:
$1,595
Percentage of individuals using paid preparers for their 2004 taxes: 70.5%
Here:
70%
State:
55%
(% for various income ranges: 60.9% for AGIs below $10k, 71.7% for AGIs $10k-25k, 73.5% for AGIs $25k-50k, 74.6% for AGIs $50k-75k, 73.7% for AGIs $75k-100k, 75.0% for AGIs over 100k)
Household received Food Stamps/SNAP in the past 12 months: 0 Household did not receive Food Stamps/SNAP in the past 12 months: 247
Women who did not have a birth in the past 12 months: 121 (106 now married, 13 unmarried)
Housing units in zip code 80624 with a mortgage: 109 (5 second mortgage, 5 both second mortgage and home equity loan) Median monthly owner costs for units with a mortgage: $2,693 Median monthly owner costs for units without a mortgage: $298
Residents with income below the poverty level in 2022:
This zip code:
7.4%
Whole state:
9.4%
Residents with income below 50% of the poverty level in 2022:
This zip code:
5.9%
Whole state:
4.6%
Median number of rooms in houses and condos:
Here:
6.1
State:
6.8
Median number of rooms in apartments:
Here:
6.0
State:
4.0
Notable locations in this zip code not listed on our city pages
Size of family households: 113 2-persons, 17 3-persons, 44 4-persons, 7 5-persons, 11 6-persons, 6 7-or-more-persons
Size of nonfamily households: 46 1-person
69 married couples with children.
0 single-parent households ().
96.0% of residents of 80624 zip code speak English at home.
4.1% of residents speak Spanish at home (100% very well).
Foreign born population: 0 (0.0%)
:
0.0%
Whole state:
9.5%
38%German
7%European
6%Italian
5%Norwegian
1%Irish
72.3%Bottled, tank, or LP gas
10.5%Other fuel
9.2%Utility gas
8.4%Electricity
Population in 1990: 130. Population change in the 1990s: +827 (+636.2%).
Place of birth for U.S.-born residents:
This state: 451
Northeast: 14
Midwest: 105
South: 37
West: 77
47% of the 80624 zip code residents lived in the same house 5 years ago. Out of people who lived in different houses, 90% lived in this county. Out of people who lived in different counties, 50% lived in Colorado.
97% of the 80624 zip code residents lived in the same house 1 year ago. Out of people who lived in different houses, 115% moved from this county.
Private vs. public school enrollment:
Students in private schools in grades 1 to 8 (elementary and middle school):
Here:
0.0%
Colorado:
11.4%
Students in private schools in grades 9 to 12 (high school):
Here:
0.0%
Colorado:
8.5%
Students in private undergraduate colleges:
Here:
0.0%
Colorado:
14.0%
Occupation by median earnings in the past 12 months ($)
73,855Installation, maintenance, and repair occupations
70,085Office and administrative support occupations
59,627Sales and related occupations
48,343Construction and extraction occupations
Top industries in this zip code by the number of employees in 2005:
Other Services (except Public Administration): General Automotive Repair (1-4 employees: 1 establishment)
Mining: Support Activities for Oil and Gas Operations (1-4: 1)
Professional, Scientific, and Technical Services: Veterinary Services (1-4: 1)
Construction: Electrical Contractors (1-4: 1)
Fatal accident statistics in 2014:
Fatal accident count: 2
Vehicles involved in fatal accidents: 5
Fatal accidents caused by drunken drivers: 0
Fatalities: 4
Persons involved in fatal accidents: 12
Pedestrians involved in fatal accidents: 0
Fatal accident statistics in 2011:
Fatal accident count: 1
Vehicles involved in fatal accidents: 1
Fatal accidents caused by drunken drivers: 0
Fatalities: 1
Persons involved in fatal accidents: 3
Pedestrians involved in fatal accidents: 0
Home Mortgage Disclosure Act Aggregated Statistics For Year 2009 (Based on 2 partial tracts)
A) FHA, FSA/RHS & VA Home Purchase Loans
B) Conventional Home Purchase Loans
C) Refinancings
D) Home Improvement Loans
F) Non-occupant Loans on < 5 Family Dwellings (A B C & D)
G) Loans On Manufactured Home Dwelling (A B C & D)
Number
Average Value
Number
Average Value
Number
Average Value
Number
Average Value
Number
Average Value
Number
Average Value
LOANS ORIGINATED
3
$205,550
1
$189,060
22
$190,515
1
$89,550
1
$195,140
1
$150,640
APPLICATIONS APPROVED, NOT ACCEPTED
0
$0
0
$0
1
$251,800
0
$0
0
$0
0
$0
APPLICATIONS DENIED
1
$271,700
1
$158,380
8
$203,741
2
$41,735
2
$53,070
1
$79,330
APPLICATIONS WITHDRAWN
1
$100,330
0
$0
6
$189,195
0
$0
0
$0
0
$0
FILES CLOSED FOR INCOMPLETENESS
0
$0
0
$0
1
$360,700
0
$0
0
$0
0
$0
Aggregated Statistics For Year 2008 (Based on 2 partial tracts)
A) FHA, FSA/RHS & VA Home Purchase Loans
B) Conventional Home Purchase Loans
C) Refinancings
D) Home Improvement Loans
F) Non-occupant Loans on < 5 Family Dwellings (A B C & D)
G) Loans On Manufactured Home Dwelling (A B C & D)
Number
Average Value
Number
Average Value
Number
Average Value
Number
Average Value
Number
Average Value
Number
Average Value
LOANS ORIGINATED
4
$159,552
7
$316,004
14
$168,841
3
$83,103
3
$370,100
2
$164,875
APPLICATIONS APPROVED, NOT ACCEPTED
0
$0
0
$0
2
$188,365
1
$88,450
0
$0
0
$0
APPLICATIONS DENIED
1
$182,150
2
$121,340
7
$186,530
2
$45,470
1
$135,990
1
$140,410
APPLICATIONS WITHDRAWN
0
$0
1
$174,680
3
$194,587
1
$81,540
0
$0
0
$0
FILES CLOSED FOR INCOMPLETENESS
0
$0
0
$0
1
$176,340
0
$0
0
$0
0
$0
Aggregated Statistics For Year 2007 (Based on 2 partial tracts)
A) FHA, FSA/RHS & VA Home Purchase Loans
B) Conventional Home Purchase Loans
C) Refinancings
D) Home Improvement Loans
F) Non-occupant Loans on < 5 Family Dwellings (A B C & D)
G) Loans On Manufactured Home Dwelling (A B C & D)
Number
Average Value
Number
Average Value
Number
Average Value
Number
Average Value
Number
Average Value
Number
Average Value
LOANS ORIGINATED
1
$174,960
12
$146,745
19
$184,563
3
$37,313
5
$112,052
2
$114,155
APPLICATIONS APPROVED, NOT ACCEPTED
0
$0
2
$114,570
5
$179,274
0
$0
1
$101,720
1
$109,730
APPLICATIONS DENIED
1
$107,520
6
$135,897
19
$182,933
2
$99,920
3
$158,287
2
$95,635
APPLICATIONS WITHDRAWN
0
$0
1
$93,420
2
$257,745
0
$0
0
$0
0
$0
FILES CLOSED FOR INCOMPLETENESS
0
$0
0
$0
1
$179,110
0
$0
0
$0
0
$0
Aggregated Statistics For Year 2006 (Based on 2 partial tracts)
A) FHA, FSA/RHS & VA Home Purchase Loans
B) Conventional Home Purchase Loans
C) Refinancings
D) Home Improvement Loans
F) Non-occupant Loans on < 5 Family Dwellings (A B C & D)
G) Loans On Manufactured Home Dwelling (A B C & D)
Number
Average Value
Number
Average Value
Number
Average Value
Number
Average Value
Number
Average Value
Number
Average Value
LOANS ORIGINATED
2
$181,595
18
$132,288
28
$141,734
4
$40,078
3
$190,900
4
$122,170
APPLICATIONS APPROVED, NOT ACCEPTED
1
$39,250
2
$157,965
8
$152,469
0
$0
1
$74,630
1
$84,030
APPLICATIONS DENIED
0
$0
7
$156,719
20
$167,788
5
$70,206
1
$279,990
3
$121,800
APPLICATIONS WITHDRAWN
0
$0
3
$138,753
11
$160,689
1
$154,510
1
$190,720
0
$0
FILES CLOSED FOR INCOMPLETENESS
0
$0
0
$0
2
$236,045
0
$0
0
$0
0
$0
Aggregated Statistics For Year 2005 (Based on 2 partial tracts)
A) FHA, FSA/RHS & VA Home Purchase Loans
B) Conventional Home Purchase Loans
C) Refinancings
D) Home Improvement Loans
F) Non-occupant Loans on < 5 Family Dwellings (A B C & D)
G) Loans On Manufactured Home Dwelling (A B C & D)
Number
Average Value
Number
Average Value
Number
Average Value
Number
Average Value
Number
Average Value
Number
Average Value
LOANS ORIGINATED
2
$157,965
17
$141,956
29
$164,563
4
$95,565
3
$163,077
2
$92,730
APPLICATIONS APPROVED, NOT ACCEPTED
0
$0
2
$174,270
5
$154,784
1
$14,650
0
$0
0
$0
APPLICATIONS DENIED
0
$0
7
$117,076
21
$174,948
5
$33,998
2
$199,425
3
$134,330
APPLICATIONS WITHDRAWN
1
$79,600
3
$157,457
17
$174,522
1
$161,970
2
$169,850
1
$155,340
FILES CLOSED FOR INCOMPLETENESS
0
$0
1
$64,400
5
$213,270
0
$0
0
$0
0
$0
Aggregated Statistics For Year 2004 (Based on 2 partial tracts)
A) FHA, FSA/RHS & VA Home Purchase Loans
B) Conventional Home Purchase Loans
C) Refinancings
D) Home Improvement Loans
F) Non-occupant Loans on < 5 Family Dwellings (A B C & D)
G) Loans On Manufactured Home Dwelling (A B C & D)
Number
Average Value
Number
Average Value
Number
Average Value
Number
Average Value
Number
Average Value
Number
Average Value
LOANS ORIGINATED
5
$155,834
15
$146,750
45
$163,420
2
$20,730
3
$131,013
4
$124,242
APPLICATIONS APPROVED, NOT ACCEPTED
1
$45,330
3
$139,030
10
$128,333
1
$160,040
2
$119,960
2
$124,655
APPLICATIONS DENIED
0
$0
8
$97,500
26
$152,297
3
$66,060
2
$140,275
2
$151,605
APPLICATIONS WITHDRAWN
0
$0
5
$173,248
19
$156,384
1
$21,840
1
$231,070
1
$68,270
FILES CLOSED FOR INCOMPLETENESS
0
$0
1
$80,160
6
$190,900
1
$59,430
0
$0
1
$141,520
Aggregated Statistics For Year 2003 (Based on 2 partial tracts)
A) FHA, FSA/RHS & VA Home Purchase Loans
B) Conventional Home Purchase Loans
C) Refinancings
D) Home Improvement Loans
F) Non-occupant Loans on < 5 Family Dwellings (A B C & D)
Number
Average Value
Number
Average Value
Number
Average Value
Number
Average Value
Number
Average Value
LOANS ORIGINATED
4
$156,650
12
$133,870
70
$155,992
3
$25,980
3
$115,167
APPLICATIONS APPROVED, NOT ACCEPTED
0
$0
4
$117,192
6
$133,087
1
$24,600
1
$50,860
APPLICATIONS DENIED
1
$89,830
5
$196,134
31
$172,358
3
$34,367
1
$166,670
APPLICATIONS WITHDRAWN
0
$0
1
$231,350
15
$163,021
0
$0
1
$337,210
FILES CLOSED FOR INCOMPLETENESS
0
$0
1
$263,690
2
$176,760
0
$0
0
$0
Aggregated Statistics For Year 2002 (Based on 2 partial tracts)
A) FHA, FSA/RHS & VA Home Purchase Loans
B) Conventional Home Purchase Loans
C) Refinancings
D) Home Improvement Loans
F) Non-occupant Loans on < 5 Family Dwellings (A B C & D)
Number
Average Value
Number
Average Value
Number
Average Value
Number
Average Value
Number
Average Value
LOANS ORIGINATED
2
$170,815
10
$137,758
44
$145,229
4
$25,360
1
$131,290
APPLICATIONS APPROVED, NOT ACCEPTED
0
$0
2
$94,390
7
$141,083
1
$27,360
1
$84,030
APPLICATIONS DENIED
1
$66,340
4
$72,278
17
$120,656
2
$10,780
1
$64,680
APPLICATIONS WITHDRAWN
0
$0
1
$105,310
8
$136,161
0
$0
0
$0
FILES CLOSED FOR INCOMPLETENESS
0
$0
1
$66,060
4
$144,142
0
$0
1
$47,260
Aggregated Statistics For Year 2001 (Based on 2 partial tracts)
A) FHA, FSA/RHS & VA Home Purchase Loans
B) Conventional Home Purchase Loans
C) Refinancings
D) Home Improvement Loans
F) Non-occupant Loans on < 5 Family Dwellings (A B C & D)
Number
Average Value
Number
Average Value
Number
Average Value
Number
Average Value
Number
Average Value
LOANS ORIGINATED
3
$89,187
13
$129,610
44
$131,353
5
$22,664
2
$155,335
APPLICATIONS APPROVED, NOT ACCEPTED
0
$0
2
$89,555
8
$138,408
1
$40,080
0
$0
APPLICATIONS DENIED
0
$0
6
$93,883
24
$122,030
3
$15,203
0
$0
APPLICATIONS WITHDRAWN
0
$0
1
$77,120
10
$127,503
1
$30,400
0
$0
FILES CLOSED FOR INCOMPLETENESS
0
$0
1
$76,290
3
$140,043
0
$0
0
$0
Aggregated Statistics For Year 2000 (Based on 2 partial tracts)
A) FHA, FSA/RHS & VA Home Purchase Loans
B) Conventional Home Purchase Loans
C) Refinancings
D) Home Improvement Loans
F) Non-occupant Loans on < 5 Family Dwellings (A B C & D)
Number
Average Value
Number
Average Value
Number
Average Value
Number
Average Value
Number
Average Value
LOANS ORIGINATED
2
$121,340
13
$112,261
14
$122,169
6
$19,025
1
$23,770
APPLICATIONS APPROVED, NOT ACCEPTED
1
$42,290
2
$56,245
4
$94,668
2
$16,170
0
$0
APPLICATIONS DENIED
2
$59,565
6
$54,958
11
$96,287
0
$0
0
$0
APPLICATIONS WITHDRAWN
1
$78,220
1
$94,530
7
$95,594
0
$0
0
$0
FILES CLOSED FOR INCOMPLETENESS
0
$0
1
$77,120
2
$83,195
0
$0
0
$0
Aggregated Statistics For Year 1999 (Based on 1 partial tract)
A) FHA, FSA/RHS & VA Home Purchase Loans
B) Conventional Home Purchase Loans
C) Refinancings
D) Home Improvement Loans
F) Non-occupant Loans on < 5 Family Dwellings (A B C & D)


 Nearest zip codes: 80622, 80644, 80615, 80631, 80610, 80645.


