Estimated zip code population in 2022: 54,997 Zip code population in 2010: 48,603 Zip code population in 2000: 45,764
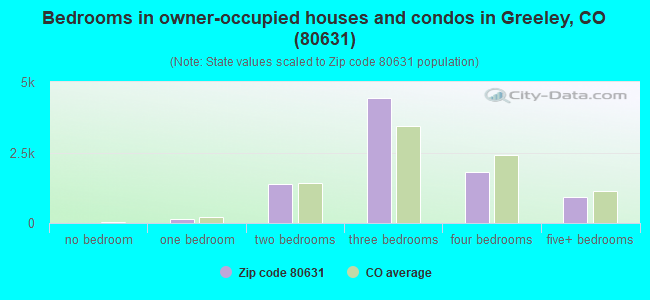
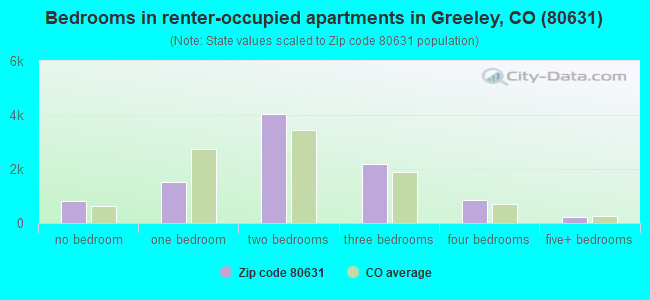
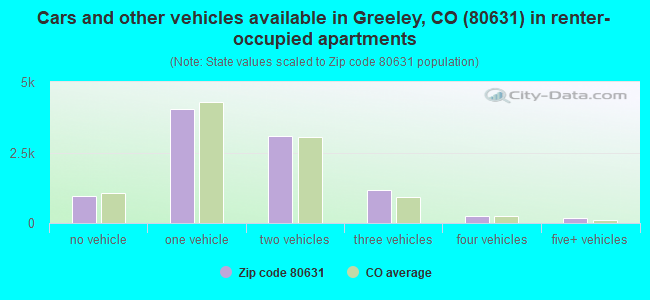
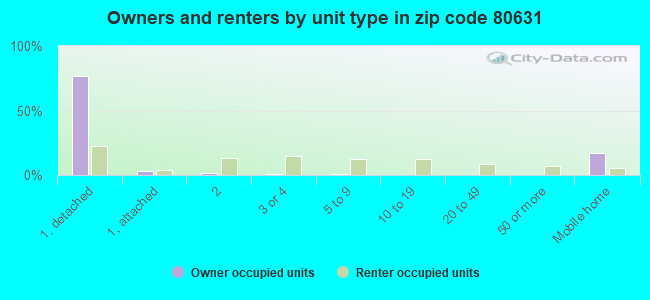
Houses and condos: 19,480 Renter-occupied apartments: 9,685
% of renters here:
53%
State:
34%
March 2022 cost of living index in zip code 80631: 103.5 (near average, U.S. average is 100)
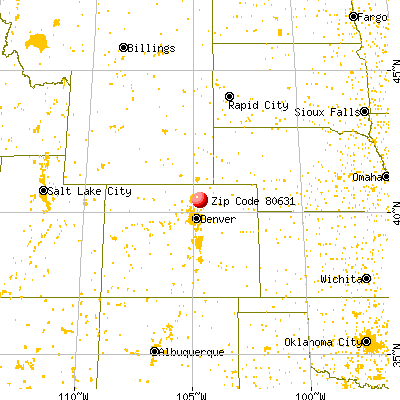
Land area: 102.8 sq. mi. Water area: 1.0 sq. mi.
Population density: 535 people per square mile
(low).
OSM Map
General Map
Google Map
MSN Map
OSM Map
General Map
Google Map
MSN Map
OSM Map
General Map
Google Map
MSN Map
OSM Map
General Map
Google Map
MSN Map
Please wait while loading the map...
Real estate property taxes paid for housing units in 2022:
This zip code:
0.4% ($1,287)
Colorado:
0.5% ($2,422)
Median real estate property taxes paid for housing units with mortgages in 2022: $1,388 (0.4%) Median real estate property taxes paid for housing units with no mortgage in 2022: $1,017 (0.4%)
Averages for the 2020 tax year for zip code 80631, filed in 2021:
Average Adjusted Gross Income (AGI) in 2020: $44,492 (Individual Income Tax Returns)
Here:
$44,492
State:
$89,260
Salary/wage: $38,432 (reported on 88.7% of returns)
Here:
$38,432
State:
$70,330
(% of AGI for various income ranges: 1372.5% for AGIs below $25k, 4116.0% for AGIs $25k-50k, 7230.6% for AGIs $50k-75k, 11127.8% for AGIs $75k-100k, 18593.5% for AGIs $100k-200k, 64240.0% for AGIs over 200k)
Taxable interest for individuals: $1,552 (reported on 12.5% of returns)
This zip code:
$1,552
Colorado:
$2,176
(% of AGI for various income ranges: 4.4% for AGIs below $25k, 5.1% for AGIs $25k-50k, 19.9% for AGIs $50k-75k, 51.4% for AGIs $75k-100k, 148.9% for AGIs $100k-200k, 3003.3% for AGIs over 200k)
Ordinary dividends: $5,264 (reported on 6.7% of returns)
Here:
$5,264
State:
$8,820
(% of AGI for various income ranges: 5.6% for AGIs below $25k, 7.8% for AGIs $25k-50k, 23.9% for AGIs $50k-75k, 63.2% for AGIs $75k-100k, 283.3% for AGIs $100k-200k, 6630.0% for AGIs over 200k)
Net capital gain/loss in AGI: +$15,577 (reported on 6.7% of returns)
Here:
+$15,577
State:
+$37,276
(% of AGI for various income ranges: 3.2% for AGIs below $25k, 7.9% for AGIs $25k-50k, 30.5% for AGIs $50k-75k, 116.4% for AGIs $75k-100k, 807.8% for AGIs $100k-200k, 24921.7% for AGIs over 200k)
Profit/loss from business: +$7,838 (reported on 14.7% of returns)
Here:
+$7,838
State:
+$15,295
(% of AGI for various income ranges: 81.8% for AGIs below $25k, 86.7% for AGIs $25k-50k, 181.9% for AGIs $50k-75k, 323.7% for AGIs $75k-100k, 603.9% for AGIs $100k-200k, 6758.3% for AGIs over 200k)
Taxable individual retirement arrangement distribution: $14,005 (reported on 3.6% of returns)
80631:
$14,005
Colorado:
$23,785
(% of AGI for various income ranges: 16.4% for AGIs below $25k, 17.8% for AGIs $25k-50k, 77.9% for AGIs $50k-75k, 194.0% for AGIs $75k-100k, 614.8% for AGIs $100k-200k, 2668.3% for AGIs over 200k)
Self-employed (Keogh) retirement plans: $19,500 (reported on 0.1% of returns)
80631:
$19,500
Colorado:
$23,633
(% of AGI for various income ranges: 72.2% for AGIs $100k-200k)
Total itemized deductions: $31,796 (reported on 3.6% of returns)
Here:
$31,796
State:
$35,141
(% of AGI for various income ranges: 16.1% for AGIs below $25k, 68.2% for AGIs $25k-50k, 210.9% for AGIs $50k-75k, 354.3% for AGIs $75k-100k, 954.8% for AGIs $100k-200k, 10101.7% for AGIs over 200k)
Charity contributions: $12,092 (reported on 2.5% of returns)
Here:
$12,092
State:
$12,103
(% of AGI for various income ranges: 1.5% for AGIs below $25k, 4.8% for AGIs $25k-50k, 19.9% for AGIs $50k-75k, 44.0% for AGIs $75k-100k, 294.8% for AGIs $100k-200k, 5633.3% for AGIs over 200k)
Taxes paid: $5,754 (reported on 3.6% of returns)
80631:
$5,754
State:
$7,710
(% of AGI for various income ranges: 1.3% for AGIs below $25k, 8.9% for AGIs $25k-50k, 30.1% for AGIs $50k-75k, 75.1% for AGIs $75k-100k, 234.6% for AGIs $100k-200k, 1800.0% for AGIs over 200k)
Earned income credit: $2,358 (reported on 22.8% of returns)
Here:
$2,358
State:
$2,053
(% of AGI for various income ranges: 109.0% for AGIs below $25k, 84.2% for AGIs $25k-50k, 2.1% for AGIs $50k-75k)
Percentage of individuals using paid preparers for their 2020 taxes: 92.6%
Here:
93%
State:
93%
(% for various income ranges: 90.9% for AGIs below $25k, 93.7% for AGIs $25k-50k, 93.5% for AGIs $50k-75k, 94.2% for AGIs $75k-100k, 92.7% for AGIs $100k-200k, 96.3% for AGIs over 200k)
Averages for the 2012 tax year for zip code 80631, filed in 2013:
Average Adjusted Gross Income (AGI) in 2012: $36,943 (Individual Income Tax Returns)
Here:
$36,943
State:
$69,103
Salary/wage: $30,852 (reported on 89.4% of returns)
Here:
$30,852
State:
$54,794
(% of AGI for various income ranges: 84.7% for AGIs below $25k, 89.1% for AGIs $25k-50k, 82.2% for AGIs $50k-75k, 76.5% for AGIs $75k-100k, 64.7% for AGIs $100k-200k, 28.9% for AGIs over 200k)
Taxable interest for individuals: $1,506 (reported on 15.3% of returns)
This zip code:
$1,506
Colorado:
$1,971
(% of AGI for various income ranges: 0.5% for AGIs below $25k, 0.3% for AGIs $25k-50k, 0.5% for AGIs $50k-75k, 0.6% for AGIs $75k-100k, 0.9% for AGIs $100k-200k, 1.5% for AGIs over 200k)
Ordinary dividends: $3,667 (reported on 8.5% of returns)
Here:
$3,667
State:
$7,140
(% of AGI for various income ranges: 0.4% for AGIs below $25k, 0.3% for AGIs $25k-50k, 0.6% for AGIs $50k-75k, 0.8% for AGIs $75k-100k, 1.2% for AGIs $100k-200k, 2.6% for AGIs over 200k)
Net capital gain/loss in AGI: +$10,208 (reported on 7.0% of returns)
Here:
+$10,208
State:
+$23,009
(% of AGI for various income ranges: 0.1% for AGIs $25k-50k, 0.4% for AGIs $50k-75k, 1.3% for AGIs $75k-100k, 2.5% for AGIs $100k-200k, 10.4% for AGIs over 200k)
Profit/loss from business: +$9,914 (reported on 11.6% of returns)
Here:
+$9,914
State:
+$13,514
(% of AGI for various income ranges: 6.4% for AGIs below $25k, 1.8% for AGIs $25k-50k, 1.7% for AGIs $50k-75k, 2.5% for AGIs $75k-100k, 4.1% for AGIs $100k-200k, 3.0% for AGIs over 200k)
Taxable individual retirement arrangement distribution: $12,051 (reported on 4.9% of returns)
80631:
$12,051
Colorado:
$17,927
(% of AGI for various income ranges: 1.1% for AGIs below $25k, 0.9% for AGIs $25k-50k, 1.5% for AGIs $50k-75k, 1.6% for AGIs $75k-100k, 2.8% for AGIs $100k-200k, 2.7% for AGIs over 200k)
Self-employment retirement plans: $16,000 (reported on 0.2% of returns)
80631:
$16,000
Colorado:
$19,483
Total itemized deductions: $19,972 (22% of AGI, reported on 14.7% of returns)
Here:
$19,972
State:
$24,621
Here:
21.7% of AGI
State:
18.5% of AGI
(% of AGI for various income ranges: 3.8% for AGIs below $25k, 5.2% for AGIs $25k-50k, 8.5% for AGIs $50k-75k, 11.0% for AGIs $75k-100k, 12.3% for AGIs $100k-200k, 12.0% for AGIs over 200k)
Charity contributions: $4,125 (reported on 10.9% of returns)
Here:
$4,125
State:
$4,449
(% of AGI for various income ranges: 0.3% for AGIs below $25k, 0.5% for AGIs $25k-50k, 1.1% for AGIs $50k-75k, 1.8% for AGIs $75k-100k, 2.6% for AGIs $100k-200k, 2.2% for AGIs over 200k)
Taxes paid: $4,603 (reported on 14.7% of returns)
80631:
$4,603
State:
$7,641
(% of AGI for various income ranges: 0.4% for AGIs below $25k, 0.8% for AGIs $25k-50k, 1.6% for AGIs $50k-75k, 2.4% for AGIs $75k-100k, 3.3% for AGIs $100k-200k, 4.2% for AGIs over 200k)
Earned income credit: $2,467 (reported on 30.8% of returns)
Here:
$2,467
State:
$2,095
(% of AGI for various income ranges: 8.5% for AGIs below $25k, 2.1% for AGIs $25k-50k)
Percentage of individuals using paid preparers for their 2012 taxes: 59.5%
Here:
60%
State:
49%
(% for various income ranges: 54.1% for AGIs below $25k, 63.8% for AGIs $25k-50k, 63.0% for AGIs $50k-75k, 64.0% for AGIs $75k-100k, 72.1% for AGIs $100k-200k, 93.3% for AGIs over 200k)
Averages for the 2004 tax year for zip code 80631, filed in 2005:
Average Adjusted Gross Income (AGI) in 2004: $31,054 (Individual Income Tax Returns)
Here:
$31,054
State:
$55,014
Salary/wage: $27,177 (reported on 87.9% of returns)
Here:
$27,177
State:
$46,010
(% of AGI for various income ranges: 174.0% for AGIs below $10k, 88.3% for AGIs $10k-25k, 87.8% for AGIs $25k-50k, 79.0% for AGIs $50k-75k, 72.6% for AGIs $75k-100k, 40.8% for AGIs over 100k)
Taxable interest for individuals: $2,075 (reported on 26.3% of returns)
This zip code:
$2,075
Colorado:
$2,127
(% of AGI for various income ranges: 8.4% for AGIs below $10k, 1.2% for AGIs $10k-25k, 1.1% for AGIs $25k-50k, 1.2% for AGIs $50k-75k, 1.7% for AGIs $75k-100k, 3.1% for AGIs over 100k)
Taxable dividends: $3,693 (reported on 13.4% of returns)
Here:
$3,693
State:
$3,782
(% of AGI for various income ranges: 3.4% for AGIs below $10k, 0.5% for AGIs $10k-25k, 0.4% for AGIs $25k-50k, 0.8% for AGIs $50k-75k, 1.1% for AGIs $75k-100k, 5.1% for AGIs over 100k)
Net capital gain/loss: +$20,017 (reported on 11.5% of returns)
Here:
+$20,017
State:
+$17,882
(% of AGI for various income ranges: 0.7% for AGIs below $10k, 0.3% for AGIs $10k-25k, 0.5% for AGIs $25k-50k, 1.3% for AGIs $50k-75k, 2.6% for AGIs $75k-100k, 32.5% for AGIs over 100k)
Profit/loss from business: +$6,601 (reported on 13.0% of returns)
Here:
+$6,601
State:
+$11,247
(% of AGI for various income ranges: 7.1% for AGIs below $10k, 3.4% for AGIs $10k-25k, 1.7% for AGIs $25k-50k, 2.2% for AGIs $50k-75k, 4.1% for AGIs $75k-100k, 3.3% for AGIs over 100k)
IRA payment deduction: $2,939 (reported on 1.7% of returns)
80631:
$2,939
Colorado:
$2,947
(% of AGI for various income ranges: 0.2% for AGIs below $10k, 0.1% for AGIs $10k-25k, 0.2% for AGIs $25k-50k, 0.2% for AGIs $50k-75k, 0.2% for AGIs $75k-100k, 0.1% for AGIs over 100k)
Self-employed pension: $10,667 (reported on 0.4% of returns)
Here:
$10,667
Colorado:
$13,653
(% of AGI for various income ranges: 0.1% for AGIs $10k-25k, 0.1% for AGIs $50k-75k, 0.5% for AGIs over 100k)
Total itemized deductions: $16,676 (25% of AGI, reported on 22.4% of returns)
Here:
$16,676
State:
$20,560
Here:
25.3% of AGI
State:
21.4% of AGI
(% of AGI for various income ranges: 16.0% for AGIs below $10k, 6.2% for AGIs $10k-25k, 11.0% for AGIs $25k-50k, 14.8% for AGIs $50k-75k, 15.0% for AGIs $75k-100k, 14.6% for AGIs over 100k)
Charity contributions deductions: $3,480 (5% of AGI, reported on 17.2% of returns)
Here:
$3,480
State:
$3,518
Here:
4.7% of AGI
State:
3.4% of AGI
(% of AGI for various income ranges: 0.9% for AGIs below $10k, 0.5% for AGIs $10k-25k, 1.1% for AGIs $25k-50k, 1.8% for AGIs $50k-75k, 2.3% for AGIs $75k-100k, 4.5% for AGIs over 100k)
Total tax: $4,265 (reported on 59.7% of returns)
80631:
$4,265
State:
$9,173
(% of AGI for various income ranges: 4.8% for AGIs below $10k, 3.1% for AGIs $10k-25k, 5.4% for AGIs $25k-50k, 8.0% for AGIs $50k-75k, 11.0% for AGIs $75k-100k, 16.3% for AGIs over 100k)
Earned income credit: $1,904 (reported on 27.1% of returns)
Here:
$1,904
State:
$1,595
Percentage of individuals using paid preparers for their 2004 taxes: 66.0%
Here:
66%
State:
55%
(% for various income ranges: 57.0% for AGIs below $10k, 69.3% for AGIs $10k-25k, 68.3% for AGIs $25k-50k, 65.0% for AGIs $50k-75k, 68.2% for AGIs $75k-100k, 79.7% for AGIs over 100k)
Likely homosexual households (counted as self-reported same-sex unmarried-partner households)
Lesbian couples: 0.1% of all households
Gay men: 0.0% of all households
Household received Food Stamps/SNAP in the past 12 months: 3,937 Household did not receive Food Stamps/SNAP in the past 12 months: 14,751
Women who had a birth in the past 12 months: 727 (548 now married, 174 unmarried) Women who did not have a birth in the past 12 months: 14,939 (5,602 now married, 9,368 unmarried)
Housing units in zip code 80631 with a mortgage: 5,423 (528 second mortgage, 9 home equity loan, 358 both second mortgage and home equity loan) Houses without a mortgage: 21
Median monthly owner costs for units with a mortgage: $1,552 Median monthly owner costs for units without a mortgage: $513
Residents with income below the poverty level in 2022:
This zip code:
24.2%
Whole state:
9.4%
Residents with income below 50% of the poverty level in 2022:
This zip code:
10.2%
Whole state:
4.6%
Median number of rooms in houses and condos:
Here:
6.2
State:
6.8
Median number of rooms in apartments:
Here:
4.2
State:
4.0
Notable locations in this zip code not listed on our city pages
Tourist attraction (not listed on the city page) : Weld County Government - Tobacco Free Weld County Project- Sexually Transmitted Dis (1555 North 17th Avenue).
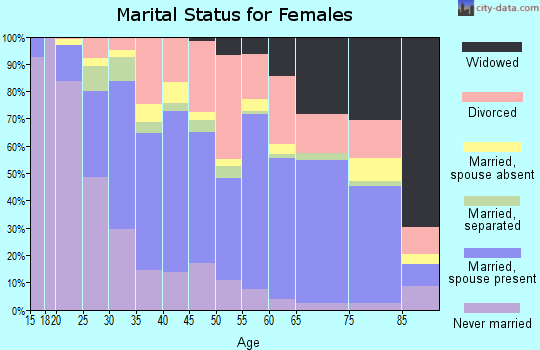
6,984 married couples with children.
4,592 single-parent households (820 men, 3,772 women).
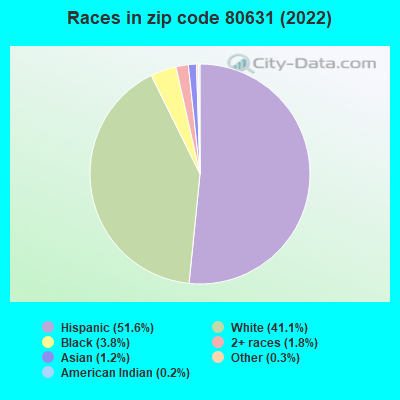
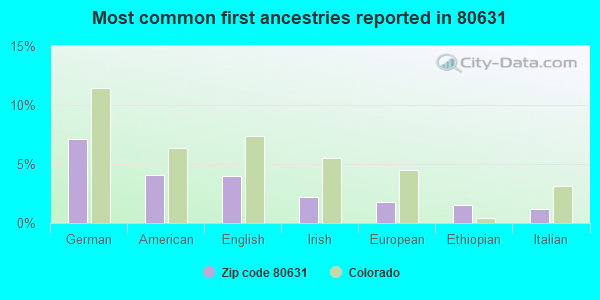
64.8% of residents of 80631 zip code speak English at home.
31.2% of residents speak Spanish at home (59% very well, 17% well, 16% not well, 9% not at all).
0.8% of residents speak other Indo-European language at home (56% very well, 20% well, 24% not well).
0.8% of residents speak Asian or Pacific Island language at home (68% very well, 16% well, 16% not well).
1.7% of residents speak other language at home (56% very well, 23% well, 9% not well, 12% not at all).
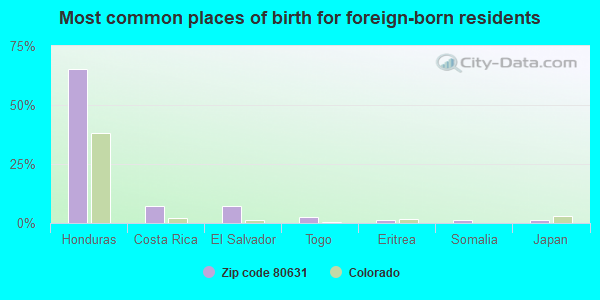
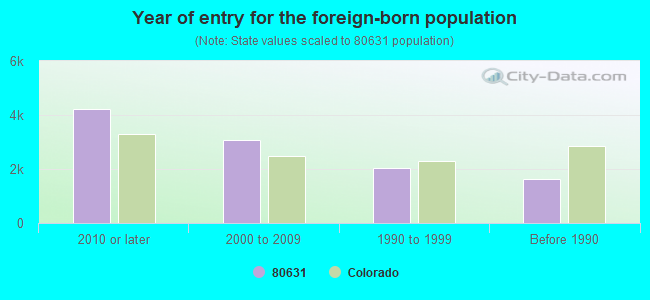
Foreign born population: 9,656 (17.6%) (39.2% of them are naturalized citizens)
Major facilities with environmental interests located in this zip code:
AGGREGATE INDUSTRIES WEST CENTRAL REG. (4509 F STREET in GREELEY, CO)
AIR MINOR (AIRS/AFS) AIR SYNTHETIC MINOR (AIRS/AFS) CRITERIA AND HAZARDOUS AIR POLLUTANT INVENTORY (Inventory of air pollution sources) National Pollutant Discharge Elimination System NON-MAJOR (Tracking pollutant discharge elimination systems) - permit TRI REPORTER (Tracking of toxic chemicals releasing facilities) Business SIC classification: CONSTRUCTION SAND AND GRAVEL; ASPHALT PAVING MIXTURES AND BLOCKS; BRICK, STONE, AND RELATED CONSTRUCTION MATERIALS Alternative names: AGGREGATE INDUSTRIES - WCR, INC., CAMAS COLORADO, INC., GREELEY ASPHALT PLANT, JAMIE W. GABORIAU
HI TECH AUTO BODY (222 22ND STREET in GREELEY, CO)
AIR MINOR (AIRS/AFS) STATE MASTER (Colorado database) - RCRAINFO-COD981552151, SQG CRITERIA AND HAZARDOUS AIR POLLUTANT INVENTORY (Inventory of air pollution sources) (Resource Conservation and Recovery Act (tracking hazardous waste)) Business SIC classification: TOP, BODY, AND UPHOLSTERY REPAIR SHOPS AND PAINT SHOPS Business NAICS classification: AUTOMOTIVE BODY, PAINT, AND INTERIOR REPAIR AND MAINTENANCE. Organizations: HI TECH AUTO BODY INC (CONTACT/OPERATOR)
, JIM HUNT (CONTACT/OWNER)
CAMAS COLORADO INCORPORATED BESTWAY PAVING DIVISION (131 NORTH 35TH AVENUE in GREELEY, CO)
AIR SYNTHETIC MINOR (AIRS/AFS) AIR MINOR (AIRS/AFS) CRITERIA AND HAZARDOUS AIR POLLUTANT INVENTORY (Inventory of air pollution sources) (Resource Conservation and Recovery Act (tracking hazardous waste)) TRI REPORTER (Tracking of toxic chemicals releasing facilities) Business SIC classification: CONSTRUCTION SAND AND GRAVEL; ASPHALT PAVING MIXTURES AND BLOCKS; READY-MIXED CONCRETE; BRICK, STONE, AND RELATED CONSTRUCTION MATERIALS Business NAICS classification: ASPHALT PAVING MIXTURE AND BLOCK MANUFACTURING. Organizations: CARL & GARY HILL (CONTACT/OWNER)
Alternative names: AGGREGATE INDUSTRIES -WEST CENTRAL REG., BEST-WAY PAVING COMPANY INC, BESTWAY CONCRETE
GARNSEY AND WHELLER COMPANY (1100 8TH AVENUE in GREELEY, CO)
AIR MINOR (AIRS/AFS) STATE MASTER (Colorado database) - RCRAINFO-COD041097056, SQG Small Quantity Generators, between 100 kg and 1000 kg of hazardous waste/month (Resource Conservation and Recovery Act (tracking hazardous waste)) Business SIC classification: MOTOR VEHICLE DEALERS (NEW AND USED); TOP, BODY, AND UPHOLSTERY REPAIR SHOPS AND PAINT SHOPS Organizations: GARNSEY & WHEELER CO (BODY SHOP) (CONTACT/OPERATOR)
, GARNSEY & WHEELER CO INC A COLORADO COR (CONTACT/OWNER)
Alternative names: GARNSEY & WHEELER CO
BUCKLEN EQUIPMENT COMPANY, INC. (804 NORTH 25TH AVENUE in GREELEY, CO)
AIR MINOR (AIRS/AFS) CRITERIA AND HAZARDOUS AIR POLLUTANT INVENTORY (Inventory of air pollution sources) National Pollutant Discharge Elimination System NON-MAJOR (Tracking pollutant discharge elimination systems) - permit Business SIC and NAICS classification: CONSTRUCTION SAND AND GRAVEL
GREELEY AUTO SUPPLY INC (2380 W 27 ST in GREELEY, CO)
STATE MASTER (Colorado database) - RCRAINFO-COD042164988, SQG (Resource Conservation and Recovery Act (tracking hazardous waste))
B&G EQUIPMENT INC (301 E 8TH ST in GREELEY, CO)
STATE MASTER (Colorado database) - RCRAINFO-COD032083628, SQG (Resource Conservation and Recovery Act (tracking hazardous waste)) Organizations: BUDDY R TRUESDELL (CONTACT/OWNER)
Alternative names: ELLIS & CAPP EQUIPMENT COMPANY
GREELEY MEDICAL CLINIC (1900 16TH ST in GREELEY, CO)
STATE MASTER (Colorado database) - RCRAINFO-COD055432660, SQG Conditionally Exempt Small Quantity Generators, less than 100 kg/month of hazardous waste (Resource Conservation and Recovery Act (tracking hazardous waste)) Business NAICS classification: DIAGNOSTIC IMAGING CENTERS.
ANDERSENS SALES & SALVAGE INC (1490 EAST 8TH STREET in GREELEY, CO)
AIR MINOR (AIRS/AFS) AIR SYNTHETIC MINOR (AIRS/AFS) CRITERIA AND HAZARDOUS AIR POLLUTANT INVENTORY (Inventory of air pollution sources) (Resource Conservation and Recovery Act (tracking hazardous waste)) Business SIC classification: SECONDARY SMELTING AND REFINING OF NONFERROUS METALS; SCRAP AND WASTE MATERIALS Alternative names: ANDERSON SALES & SALVAGE, INC.
HESCO MFG CORP (401 17TH ST in GREELEY, CO)
STATE MASTER (Colorado database) - RCRAINFO-COD088449673, SQG (Resource Conservation and Recovery Act (tracking hazardous waste))
BI-STATE MACHINERY CO (240 5TH ST in GREELEY, CO)
STATE MASTER (Colorado database) - RCRAINFO-COD058155045, SQG Small Quantity Generators, between 100 kg and 1000 kg of hazardous waste/month (Resource Conservation and Recovery Act (tracking hazardous waste)) - notification
BILLIE MARTINEZ ELEMENTARY SCHOOL (341 14TH AVENUE in GREELEY, CO)
(National Center for Education Statistics) - STATE ID-6774 Organizations: GREELEY 6 (SCHOOL DISTRICT)
GREELEY POLICE DEPARTMENT (919 7TH STREET in GREELEY, CO)
AIR MINOR (AIRS/AFS) CRITERIA AND HAZARDOUS AIR POLLUTANT INVENTORY (Inventory of air pollution sources) (Resource Conservation and Recovery Act (tracking hazardous waste)) Business SIC classification: POLICE PROTECTION Organizations: CITY OF GREELEY CO (CONTACT/OWNER)
Alternative names: DEA DRUG BUSTS
Housing units lacking complete plumbing facilities: 0.7% Housing units lacking complete kitchen facilities: 1.3%
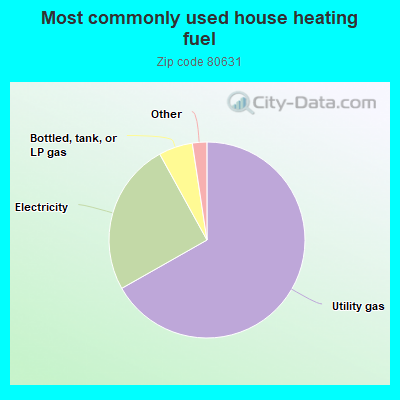
66.8%Utility gas
25.2%Electricity
5.6%Bottled, tank, or LP gas
0.6%Wood
0.6%No fuel used
0.6%Other fuel
Population in 1990: 53,905.
Place of birth for U.S.-born residents:
This state: 27,389
Northeast: 1,400
Midwest: 4,598
South: 4,867
West: 5,887
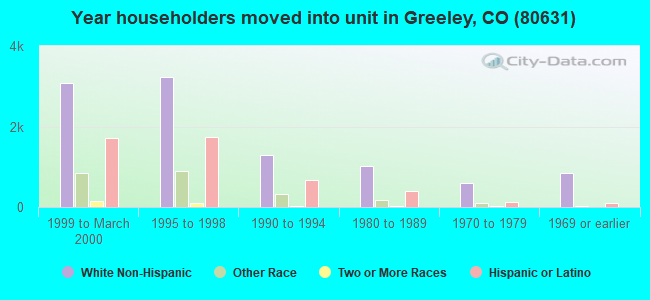
36% of the 80631 zip code residents lived in the same house 5 years ago. Out of people who lived in different houses, 49% lived in this county. Out of people who lived in different counties, 50% lived in Colorado.
84% of the 80631 zip code residents lived in the same house 1 year ago. Out of people who lived in different houses, 42% moved from this county. Out of people who lived in different houses, 35% moved from different county within same state. Out of people who lived in different houses, 19% moved from different state. Out of people who lived in different houses, 3% moved from abroad.
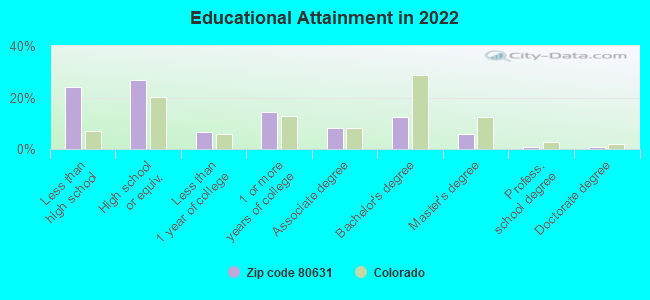
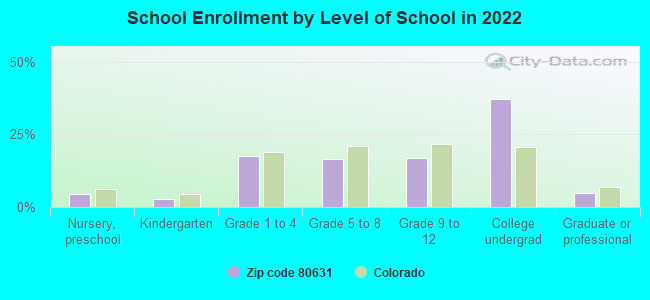
Private vs. public school enrollment:
Students in private schools in grades 1 to 8 (elementary and middle school): 335
Here:
5.5%
Colorado:
11.4%
Students in private schools in grades 9 to 12 (high school): 70
Here:
2.3%
Colorado:
8.5%
Students in private undergraduate colleges: 222
Here:
3.4%
Colorado:
14.0%
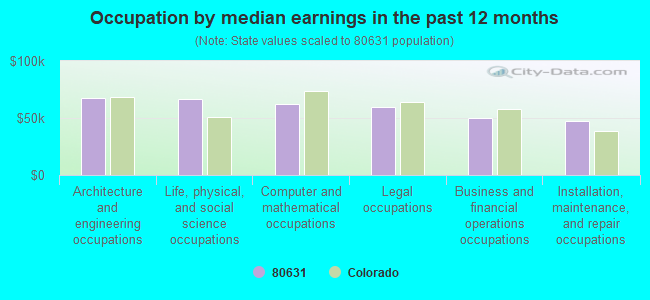
Occupation by median earnings in the past 12 months ($)
67,485Architecture and engineering occupations
66,450Life, physical, and social science occupations
62,086Computer and mathematical occupations
59,550Legal occupations
50,034Business and financial operations occupations
47,302Installation, maintenance, and repair occupations
Companies with federal contracts located in this zip code (GREELEY, CO):
HENSEL PHELPS CONSTRUCTION (420 6TH AVENUE) : $992,350,978 in 593 contractsfrom 1999 to 2006
Contracts for Maintenance, Repair or Alteration of Real Property -- Office Buildings, Construction of Structures and Facilities -- Penal Facilities, Construction of Structures and Facilities -- Miscellaneous Buildings, Construction of Structures and Facilities -- Other Administrative Facilities and Service Buildings, and moreby Public Buildings Service, Bureau of Prisoners/Federal Prison System, Army, Air Force, and others Signed by year:2000: $319,397,299; 2001: $216,510,105; 2002: $120,438,424; 2003: $144,795,293; 2004: $127,433,215; 2005: $45,808,215; 2006: $825,119.
Biggest contracts:
$124,697,000 with Public Buildings Service for Maintenance, Repair or Alteration of Real Property -- Office Buildings. Taking place in MD. Signed on 2003-04-15. Completion date: 2006-10-15.
$122,052,000 with Bureau of Prisoners/Federal Prison System for Construction of Structures and Facilities -- Penal Facilities. Taking place in CA. Signed on 2000-11-15. Completion date: 2003-02-15.
$109,879,000, same as above.Signed on 2000-09-15. Completion date: 2002-11-15.
$100,203,000 with Bureau of Prisoners/Federal Prison System for Construction of Structures and Facilities -- Penal Facilities. Taking place in SC. Signed on 2001-02-15. Completion date: 2003-11-15.
DURAN EXCAVATING, INC (418 NORTH 9TH AVENUE; small business) : $572,696 in 3 contractsfrom 2001 to 2002
$503,000 with Navy for Maintenance, Repair or Alteration of Real Property -- Highways, Roads, Streets, Bridges, and Railways (includes resurfacing). Taking place in LA. Signed on 2001-01-12. Completion date: 2001-07-12.
$103,022, same as above.Signed on 2001-10-18. Completion date: 2002-01-18.
-$33,326, same as above.Signed on 2002-01-17. Completion date: 2002-01-18.
ACTION PURSUIT PAINTBALL LLC (2017 9TH ST; small business)
$33,000 with Army for Paints, Dopes, Varnishes, and Related Products. Signed on 2002-09-27. Completion date: 2002-11-04.
LEXTRON INC (620 O STREET; small business)
$27,521 with Army for Medical and Surgical Instruments, Equipment, and Supplies. Taking place in WA. Signed on 2001-02-01. Completion date: 2001-02-08.
BLISS INVESTMENTS, LLC (2438 E 8TH ST; small business)
$20,000 with Army for Lease or Rental of Facilities -- Other Administrative Facilities and Service Buildings. Signed on 2005-06-30. Completion date: 2006-07-31.
J & E ENTERPRISES WELDING & MA (1003 E 16TH ST; small business)
$4,088 with Army for Vehicular Cab, Body, and Frame Structural Components. Signed on 2005-06-02. Completion date: 2005-06-30.
GREELEY INDEPENDENCE STAMPEDE (600 N 14TH AVE; small business)
$3,500 with Navy for Ecclesiastical Equipment, Furnishings, and Supplies. Signed on 2006-06-16. Completion date: 2006-06-15.
Top industries in this zip code by the number of employees in 2005:
Construction: Commercial and Institutional Building Construction (over 1000 employees: 1 establishment, 20-49 employees: 1 establishment, 10-19 employees: 1 establishment, 5-9 employees: 1 establishment, 1-4 employees: 2 establishments)
Health Care and Social Assistance: General Medical and Surgical Hospitals (over 1000: 1)
Management of Companies and Enterprises: Corporate, Subsidiary, and Regional Managing Offices (250-499: 2, 100-249: 2, 20-49: 2, 5-9: 1)
Professional, Scientific, and Technical Services: Other Computer Related Services (500-999: 1)
Health Care and Social Assistance: Offices of Physicians (except Mental Health Specialists) (250-499: 1, 50-99: 1, 20-49: 4, 10-19: 5, 5-9: 5, 1-4: 11)
Administrative and Support and Waste Management and Remediation Services: Temporary Help Services (100-249: 2, 50-99: 2, 20-49: 2, 5-9: 1, 1-4: 1)
People in group quarters in 2010:
3,055 people in college/university student housing
549 people in local jails and other municipal confinement facilities
292 people in nursing facilities/skilled-nursing facilities
243 people in correctional facilities intended for juveniles
194 people in correctional residential facilities
57 people in emergency and transitional shelters (with sleeping facilities) for people experiencing homelessness
56 people in other noninstitutional facilities
31 people in group homes intended for adults
30 people in residential treatment centers for adults
14 people in residential treatment centers for juveniles (non-correctional)
People in group quarters in 2000:
2,824 people in college dormitories (includes college quarters off campus)
440 people in local jails and other confinement facilities (including police lockups)
320 people in nursing homes
262 people in other types of correctional institutions
157 people in other noninstitutional group quarters
124 people in training schools for juvenile delinquents
31 people in homes or halfway houses for drug/alcohol abuse
20 people in other group homes
16 people in homes for the mentally ill
4 people in homes for the mentally retarded
Home Mortgage Disclosure Act Aggregated Statistics For Year 2009 (Based on 13 full and 18 partial tracts)
A) FHA, FSA/RHS & VA Home Purchase Loans
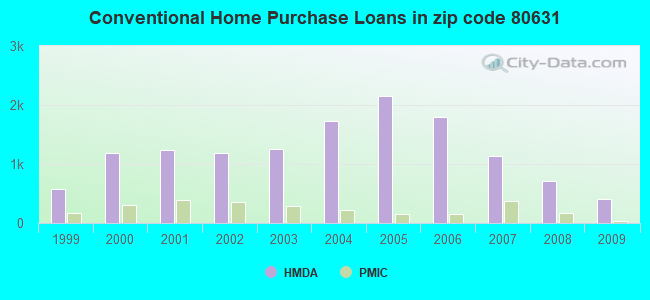
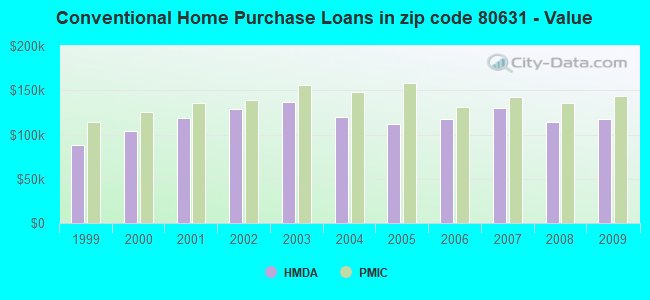
B) Conventional Home Purchase Loans
C) Refinancings
D) Home Improvement Loans
E) Loans on Dwellings For 5+ Families
F) Non-occupant Loans on < 5 Family Dwellings (A B C & D)
G) Loans On Manufactured Home Dwelling (A B C & D)
Number
Average Value
Number
Average Value
Number
Average Value
Number
Average Value
Number
Average Value
Number
Average Value
Number
Average Value
LOANS ORIGINATED
571
$129,222
407
$117,814
1,024
$167,431
65
$52,073
9
$170,103
258
$105,040
35
$55,384
APPLICATIONS APPROVED, NOT ACCEPTED
39
$110,963
42
$90,136
114
$156,070
8
$9,161
2
$260,000
31
$95,823
12
$31,708
APPLICATIONS DENIED
133
$112,053
90
$92,216
403
$180,063
73
$28,103
0
$0
78
$124,138
21
$63,394
APPLICATIONS WITHDRAWN
82
$105,657
64
$105,829
276
$161,248
16
$57,153
0
$0
50
$103,233
9
$78,573
FILES CLOSED FOR INCOMPLETENESS
4
$128,215
5
$164,374
59
$173,637
2
$17,700
0
$0
9
$183,949
2
$99,320
Aggregated Statistics For Year 2008 (Based on 13 full and 18 partial tracts)
A) FHA, FSA/RHS & VA Home Purchase Loans
B) Conventional Home Purchase Loans
C) Refinancings
D) Home Improvement Loans
E) Loans on Dwellings For 5+ Families
F) Non-occupant Loans on < 5 Family Dwellings (A B C & D)
G) Loans On Manufactured Home Dwelling (A B C & D)
Number
Average Value
Number
Average Value
Number
Average Value
Number
Average Value
Number
Average Value
Number
Average Value
Number
Average Value
LOANS ORIGINATED
436
$125,058
718
$114,389
704
$151,742
85
$62,128
17
$545,757
448
$110,309
126
$40,646
APPLICATIONS APPROVED, NOT ACCEPTED
26
$106,622
65
$165,252
140
$146,811
17
$44,389
4
$174,218
42
$132,282
16
$51,336
APPLICATIONS DENIED
83
$118,246
127
$125,951
675
$148,265
140
$33,704
1
$2,135,000
122
$99,831
43
$37,887
APPLICATIONS WITHDRAWN
39
$109,636
79
$135,258
236
$151,349
15
$60,643
0
$0
56
$119,381
13
$41,761
FILES CLOSED FOR INCOMPLETENESS
6
$112,000
13
$141,975
52
$150,754
3
$133,147
0
$0
11
$142,375
0
$0
Aggregated Statistics For Year 2007 (Based on 14 full and 18 partial tracts)
A) FHA, FSA/RHS & VA Home Purchase Loans
B) Conventional Home Purchase Loans
C) Refinancings
D) Home Improvement Loans
E) Loans on Dwellings For 5+ Families
F) Non-occupant Loans on < 5 Family Dwellings (A B C & D)
G) Loans On Manufactured Home Dwelling (A B C & D)
Number
Average Value
Number
Average Value
Number
Average Value
Number
Average Value
Number
Average Value
Number
Average Value
Number
Average Value
LOANS ORIGINATED
209
$129,588
1,142
$129,610
1,177
$145,772
147
$48,259
24
$1,588,570
557
$132,812
60
$44,405
APPLICATIONS APPROVED, NOT ACCEPTED
10
$108,021
170
$123,335
269
$137,355
17
$44,024
1
$207,000
53
$123,599
38
$40,685
APPLICATIONS DENIED
29
$119,940
397
$129,024
1,202
$141,805
231
$53,801
2
$240,000
235
$150,305
71
$38,522
APPLICATIONS WITHDRAWN
26
$119,579
120
$135,188
356
$162,322
20
$64,799
2
$280,000
72
$225,009
3
$35,253
FILES CLOSED FOR INCOMPLETENESS
5
$131,866
30
$139,379
108
$177,674
3
$72,783
0
$0
9
$198,362
0
$0
Aggregated Statistics For Year 2006 (Based on 14 full and 18 partial tracts)
A) FHA, FSA/RHS & VA Home Purchase Loans
B) Conventional Home Purchase Loans
C) Refinancings
D) Home Improvement Loans
E) Loans on Dwellings For 5+ Families
F) Non-occupant Loans on < 5 Family Dwellings (A B C & D)
G) Loans On Manufactured Home Dwelling (A B C & D)
Number
Average Value
Number
Average Value
Number
Average Value
Number
Average Value
Number
Average Value
Number
Average Value
Number
Average Value
LOANS ORIGINATED
200
$140,506
1,790
$116,955
1,683
$130,172
178
$48,108
42
$287,810
820
$117,848
41
$111,165
APPLICATIONS APPROVED, NOT ACCEPTED
11
$108,288
300
$100,951
355
$127,853
31
$38,074
1
$122,470
115
$104,895
25
$41,694
APPLICATIONS DENIED
38
$129,323
628
$107,179
1,441
$136,409
224
$53,480
4
$2,180,250
294
$120,060
67
$48,184
APPLICATIONS WITHDRAWN
20
$129,935
310
$106,325
801
$141,156
33
$94,777
0
$0
125
$114,529
7
$68,029
FILES CLOSED FOR INCOMPLETENESS
5
$124,348
53
$129,879
157
$139,029
7
$67,791
0
$0
11
$122,245
0
$0
Aggregated Statistics For Year 2005 (Based on 13 full and 18 partial tracts)
A) FHA, FSA/RHS & VA Home Purchase Loans
B) Conventional Home Purchase Loans
C) Refinancings
D) Home Improvement Loans
E) Loans on Dwellings For 5+ Families
F) Non-occupant Loans on < 5 Family Dwellings (A B C & D)
G) Loans On Manufactured Home Dwelling (A B C & D)
Number
Average Value
Number
Average Value
Number
Average Value
Number
Average Value
Number
Average Value
Number
Average Value
Number
Average Value
LOANS ORIGINATED
254
$139,304
2,151
$111,393
2,041
$127,113
206
$59,042
18
$387,257
663
$116,398
77
$49,378
APPLICATIONS APPROVED, NOT ACCEPTED
19
$98,683
260
$109,536
407
$130,520
46
$35,755
0
$0
99
$118,237
33
$41,106
APPLICATIONS DENIED
40
$122,008
753
$95,420
1,640
$137,504
273
$47,110
0
$0
221
$117,937
128
$45,601
APPLICATIONS WITHDRAWN
21
$148,173
398
$121,015
1,142
$144,789
99
$145,549
1
$170,500
140
$119,881
17
$122,382
FILES CLOSED FOR INCOMPLETENESS
4
$128,490
79
$108,100
266
$149,358
11
$73,449
0
$0
35
$154,336
0
$0
Aggregated Statistics For Year 2004 (Based on 14 full and 18 partial tracts)
A) FHA, FSA/RHS & VA Home Purchase Loans
B) Conventional Home Purchase Loans
C) Refinancings
D) Home Improvement Loans
E) Loans on Dwellings For 5+ Families
F) Non-occupant Loans on < 5 Family Dwellings (A B C & D)
G) Loans On Manufactured Home Dwelling (A B C & D)
Number
Average Value
Number
Average Value
Number
Average Value
Number
Average Value
Number
Average Value
Number
Average Value
Number
Average Value
LOANS ORIGINATED
377
$140,204
1,730
$119,391
2,449
$133,218
210
$40,976
19
$625,337
723
$121,914
73
$45,976
APPLICATIONS APPROVED, NOT ACCEPTED
21
$124,192
210
$112,554
467
$125,444
34
$39,714
2
$1,285,230
63
$125,907
56
$58,293
APPLICATIONS DENIED
74
$135,401
543
$98,596
1,784
$133,119
248
$31,428
3
$975,023
237
$150,226
143
$48,435
APPLICATIONS WITHDRAWN
68
$137,444
254
$118,426
1,001
$142,218
46
$56,874
0
$0
85
$115,005
13
$127,274
FILES CLOSED FOR INCOMPLETENESS
8
$121,546
33
$145,852
298
$145,278
12
$80,746
0
$0
17
$124,473
1
$156,980
Aggregated Statistics For Year 2003 (Based on 14 full and 18 partial tracts)
A) FHA, FSA/RHS & VA Home Purchase Loans
B) Conventional Home Purchase Loans
C) Refinancings
D) Home Improvement Loans
E) Loans on Dwellings For 5+ Families
F) Non-occupant Loans on < 5 Family Dwellings (A B C & D)
Number
Average Value
Number
Average Value
Number
Average Value
Number
Average Value
Number
Average Value
Number
Average Value
LOANS ORIGINATED
768
$136,859
1,258
$136,220
4,634
$131,647
143
$27,051
17
$391,374
844
$122,508
APPLICATIONS APPROVED, NOT ACCEPTED
46
$189,923
189
$120,658
679
$125,279
39
$36,567
0
$0
84
$125,425
APPLICATIONS DENIED
127
$127,165
330
$89,958
1,679
$127,714
212
$21,561
3
$608,373
119
$115,266
APPLICATIONS WITHDRAWN
85
$130,881
134
$131,598
928
$130,500
34
$38,634
3
$492,647
47
$140,802
FILES CLOSED FOR INCOMPLETENESS
21
$137,453
26
$132,010
170
$141,017
8
$19,184
0
$0
22
$108,038
Aggregated Statistics For Year 2002 (Based on 14 full and 16 partial tracts)
A) FHA, FSA/RHS & VA Home Purchase Loans
B) Conventional Home Purchase Loans
C) Refinancings
D) Home Improvement Loans
E) Loans on Dwellings For 5+ Families
F) Non-occupant Loans on < 5 Family Dwellings (A B C & D)
Number
Average Value
Number
Average Value
Number
Average Value
Number
Average Value
Number
Average Value
Number
Average Value
LOANS ORIGINATED
801
$128,927
1,186
$128,517
2,952
$126,566
191
$26,593
15
$1,049,279
649
$110,749
APPLICATIONS APPROVED, NOT ACCEPTED
36
$122,023
187
$118,468
464
$115,952
44
$31,416
0
$0
75
$111,150
APPLICATIONS DENIED
78
$119,198
337
$79,575
1,032
$100,190
255
$16,099
0
$0
123
$97,060
APPLICATIONS WITHDRAWN
46
$128,367
128
$117,964
855
$114,934
66
$21,215
2
$263,000
48
$112,920
FILES CLOSED FOR INCOMPLETENESS
13
$135,771
32
$118,946
378
$119,197
2
$70,310
0
$0
27
$103,589
Aggregated Statistics For Year 2001 (Based on 14 full and 16 partial tracts)
A) FHA, FSA/RHS & VA Home Purchase Loans
B) Conventional Home Purchase Loans
C) Refinancings
D) Home Improvement Loans
E) Loans on Dwellings For 5+ Families
F) Non-occupant Loans on < 5 Family Dwellings (A B C & D)
Number
Average Value
Number
Average Value
Number
Average Value
Number
Average Value
Number
Average Value
Number
Average Value
LOANS ORIGINATED
847
$120,146
1,229
$118,308
2,672
$116,148
222
$20,907
14
$889,554
584
$108,064
APPLICATIONS APPROVED, NOT ACCEPTED
31
$118,340
238
$85,072
383
$107,234
42
$41,544
1
$160,120
48
$99,560
APPLICATIONS DENIED
59
$117,447
562
$56,931
1,198
$94,213
295
$17,637
3
$75,667
110
$98,728
APPLICATIONS WITHDRAWN
46
$116,616
130
$111,429
785
$111,328
77
$29,872
0
$0
53
$89,899
FILES CLOSED FOR INCOMPLETENESS
6
$109,113
41
$120,691
189
$111,079
5
$30,866
0
$0
16
$112,877
Aggregated Statistics For Year 2000 (Based on 14 full and 16 partial tracts)
A) FHA, FSA/RHS & VA Home Purchase Loans
B) Conventional Home Purchase Loans
C) Refinancings
D) Home Improvement Loans
E) Loans on Dwellings For 5+ Families
F) Non-occupant Loans on < 5 Family Dwellings (A B C & D)
Number
Average Value
Number
Average Value
Number
Average Value
Number
Average Value
Number
Average Value
Number
Average Value
LOANS ORIGINATED
635
$108,552
1,179
$103,493
812
$93,370
232
$20,251
12
$891,018
377
$97,309
APPLICATIONS APPROVED, NOT ACCEPTED
32
$83,515
167
$63,976
193
$92,025
91
$20,671
0
$0
31
$69,211
APPLICATIONS DENIED
88
$89,227
758
$57,005
686
$78,868
217
$17,446
2
$560,000
81
$71,177
APPLICATIONS WITHDRAWN
113
$98,467
133
$104,991
350
$87,688
21
$24,470
0
$0
20
$88,900
FILES CLOSED FOR INCOMPLETENESS
40
$99,276
44
$113,447
141
$95,245
5
$28,250
0
$0
12
$104,750
Aggregated Statistics For Year 1999 (Based on 10 full and 9 partial tracts)
A) FHA, FSA/RHS & VA Home Purchase Loans
B) Conventional Home Purchase Loans
C) Refinancings
D) Home Improvement Loans
E) Loans on Dwellings For 5+ Families
F) Non-occupant Loans on < 5 Family Dwellings (A B C & D)
2002 - 2018 National Fire Incident Reporting System (NFIRS) incidents
Based on the data from the years 2002 - 2018 the average number of fire incidents per year is 129. The highest number of fire incidents - 211 took place in 2003, and the least - 11 in 2012. The data has a dropping trend.
When looking into fire subcategories, the most reports belonged to: Outside Fires (40.1%), and Structure Fires (36.9%).
Fire incident types reported to NFIRS in Zip Code 80631


 Nearest zip codes: 80620, 80615, 80645, 80634, 80624, 80623.


 Based on the data from the years 2002 - 2018 the average number of fire incidents per year is 129. The highest number of fire incidents - 211 took place in 2003, and the least - 11 in 2012. The data has a dropping trend.
 When looking into fire subcategories, the most reports belonged to: Outside Fires (40.1%), and Structure Fires (36.9%).