Estimated zip code population in 2022: 407 Zip code population in 2010: 540 Zip code population in 2000: 526
Houses and condos: 216 Renter-occupied apartments: 58
% of renters here:
31%
State:
34%
March 2022 cost of living index in zip code 80729: 97.5 (near average, U.S. average is 100)
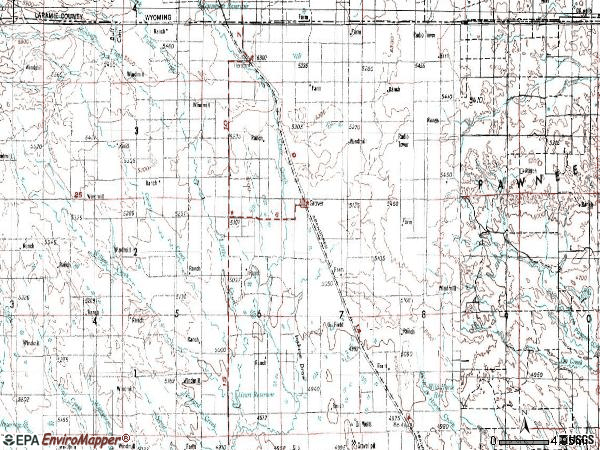
Land area: 721.9 sq. mi. Water area: 0.2 sq. mi.
Population density: 0.564 people per square mile
(very low).
OSM Map
General Map
Google Map
MSN Map
OSM Map
General Map
Google Map
MSN Map
OSM Map
General Map
Google Map
MSN Map
OSM Map
General Map
Google Map
MSN Map
Please wait while loading the map...
Real estate property taxes paid for housing units in 2022:
This zip code:
0.2% ($510)
Colorado:
0.5% ($2,422)
Median real estate property taxes paid for housing units with mortgages in 2022: $518 (0.2%) Median real estate property taxes paid for housing units with no mortgage in 2022: $510 (0.2%)
Business Search- 14 Million verified businesses
Males: 208
(51.1%)
Females: 199
(48.9%)
For population 25 years and over in 80729:
High school or higher: 90.5%
Bachelor's degree or higher: 20.2%
Graduate or professional degree: 2.5%
Unemployed: 0.5%
Mean travel time to work (commute): 31.4 minutes
For population 15 years and over in 80729:
Never married: 18.7%
Now married: 65.6%
Separated: 0.0%
Widowed: 4.5%
Divorced: 11.2%
Zip code 80729 compared to state average:
Median house value below state average.
Unemployed percentage significantly below state average.
Black race population percentage significantly below state average.
Hispanic race population percentage significantly below state average.
Median age significantly above state average.
Foreign-born population percentage significantly below state average.
Length of stay since moving in significantly above state average.
House age above state average.
Number of college students below state average.
Percentage of population with a bachelor's degree or higher below state average.
Averages for the 2020 tax year for zip code 80729, filed in 2021:
Average Adjusted Gross Income (AGI) in 2020: $64,228 (Individual Income Tax Returns)
Here:
$64,228
State:
$89,260
Salary/wage: $42,877 (reported on 72.2% of returns)
Here:
$42,877
State:
$70,330
(% of AGI for various income ranges: 1737.5% for AGIs below $25k, 4355.0% for AGIs $25k-50k, 4626.7% for AGIs $50k-75k)
Taxable interest for individuals: $1,883 (reported on 33.3% of returns)
This zip code:
$1,883
Colorado:
$2,176
(% of AGI for various income ranges: 255.0% for AGIs $25k-50k)
Ordinary dividends: $900 (reported on 16.7% of returns)
Here:
$900
State:
$8,820
(% of AGI for various income ranges: 135.0% for AGIs $25k-50k)
Net capital gain/loss in AGI: +$14,875 (reported on 22.2% of returns)
Here:
+$14,875
State:
+$37,276
(% of AGI for various income ranges: 1983.3% for AGIs $50k-75k)
Profit/loss from business: +$2,467 (reported on 16.7% of returns)
Here:
+$2,467
State:
+$15,295
(% of AGI for various income ranges: 370.0% for AGIs $25k-50k)
Earned income credit: $2,000 (reported on 11.1% of returns)
Here:
$2,000
State:
$2,053
(% of AGI for various income ranges: 100.0% for AGIs below $25k)
Percentage of individuals using paid preparers for their 2020 taxes: 94.4%
Here:
94%
State:
93%
(% for various income ranges: 85.7% for AGIs below $25k, 100.0% for AGIs $25k-50k, 166.7% for AGIs $50k-75k, 0.0% for AGIs $75k-100k, 100.0% for AGIs $100k-200k)
Averages for the 2012 tax year for zip code 80729, filed in 2013:
Average Adjusted Gross Income (AGI) in 2012: $62,135 (Individual Income Tax Returns)
Here:
$62,135
State:
$69,103
Salary/wage: $32,962 (reported on 76.5% of returns)
Here:
$32,962
State:
$54,794
(% of AGI for various income ranges: 87.4% for AGIs below $25k, 84.1% for AGIs $25k-50k, 86.4% for AGIs $50k-75k)
Taxable interest for individuals: $714 (reported on 41.2% of returns)
This zip code:
$714
Colorado:
$1,971
Ordinary dividends: $200 (reported on 17.6% of returns)
Here:
$200
State:
$7,140
Net capital gain/loss in AGI: +$5,725 (reported on 23.5% of returns)
Here:
+$5,725
State:
+$23,009
Profit/loss from business: +$1,750 (reported on 11.8% of returns)
Here:
+$1,750
State:
+$13,514
Total itemized deductions: $38,833 (26% of AGI, reported on 17.6% of returns)
Here:
$38,833
State:
$24,621
Here:
26.4% of AGI
State:
18.5% of AGI
Charity contributions: $9,600 (reported on 11.8% of returns)
Here:
$9,600
State:
$4,449
Taxes paid: $5,767 (reported on 17.6% of returns)
80729:
$5,767
State:
$7,641
Earned income credit: $2,367 (reported on 17.6% of returns)
Here:
$2,367
State:
$2,095
(% of AGI for various income ranges: 9.1% for AGIs below $25k)
Percentage of individuals using paid preparers for their 2012 taxes: 76.5%
Here:
76%
State:
49%
(% for various income ranges: 71.4% for AGIs below $25k, 75.0% for AGIs $25k-50k, 75.0% for AGIs $50k-75k, 100.0% for AGIs $100k-200k)
Averages for the 2004 tax year for zip code 80729, filed in 2005:
Average Adjusted Gross Income (AGI) in 2004: $30,342 (Individual Income Tax Returns)
Here:
$30,342
State:
$55,014
Salary/wage: $24,658 (reported on 70.8% of returns)
Here:
$24,658
State:
$46,010
(% of AGI for various income ranges: 71.1% for AGIs $10k-25k, 74.9% for AGIs $25k-50k, 77.3% for AGIs $50k-75k)
Taxable interest for individuals: $910 (reported on 48.4% of returns)
This zip code:
$910
Colorado:
$2,127
(% of AGI for various income ranges: 2.1% for AGIs $10k-25k, 1.0% for AGIs $25k-50k, 1.6% for AGIs $50k-75k)
Taxable dividends: $242 (reported on 20.5% of returns)
Here:
$242
State:
$3,782
Net capital gain/loss: +$22,314 (reported on 31.7% of returns)
Here:
+$22,314
State:
+$17,882
(% of AGI for various income ranges: 4.3% for AGIs $10k-25k, 3.7% for AGIs $25k-50k, 71.0% for AGIs $50k-75k)
Profit/loss from business: +$5,871 (reported on 19.3% of returns)
Here:
+$5,871
State:
+$11,247
Total itemized deductions: $16,467 (31% of AGI, reported on 9.3% of returns)
Here:
$16,467
State:
$20,560
Here:
30.8% of AGI
State:
21.4% of AGI
Charity contributions deductions: $1,667 (3% of AGI, reported on 7.5% of returns)
Here:
$1,667
State:
$3,518
Here:
2.8% of AGI
State:
3.4% of AGI
Total tax: $5,184 (reported on 64.0% of returns)
80729:
$5,184
State:
$9,173
(% of AGI for various income ranges: 6.3% for AGIs $10k-25k, 6.5% for AGIs $25k-50k, 8.8% for AGIs $50k-75k, 13.6% for AGIs over 100k)
Earned income credit: $1,828 (reported on 18.0% of returns)
Here:
$1,828
State:
$1,595
Percentage of individuals using paid preparers for their 2004 taxes: 75.8%
Here:
76%
State:
55%
(% for various income ranges: 79.2% for AGIs below $10k, 65.0% for AGIs $10k-25k, 73.8% for AGIs $25k-50k, 85.0% for AGIs $50k-75k, 90.9% for AGIs over 100k)
Household received Food Stamps/SNAP in the past 12 months: 22 Household did not receive Food Stamps/SNAP in the past 12 months: 165
Women who had a birth in the past 12 months: 2 (2 now married, 0 unmarried) Women who did not have a birth in the past 12 months: 50 (19 now married, 30 unmarried)
Housing units in zip code 80729 with a mortgage: 45 (5 second mortgage, 5 both second mortgage and home equity loan) Houses without a mortgage: 7
Median monthly owner costs for units with a mortgage: $1,268 Median monthly owner costs for units without a mortgage: $503
Residents with income below the poverty level in 2022:
This zip code:
12.5%
Whole state:
9.4%
Residents with income below 50% of the poverty level in 2022:
This zip code:
10.3%
Whole state:
4.6%
Median number of rooms in houses and condos:
Here:
6.2
State:
6.8
Median number of rooms in apartments:
Here:
5.4
State:
4.0
Notable locations in this zip code not listed on our city pages
Reservoirs: Eagle Rock Reservoir (A), Edward Madigan Erosion Control Reservoir Number 1 (B), Adams and Bunker Reservoir Number 3 (C), Adams and Bunker Reservoir Number 1 (D), Adams and Bunker Reservoir Number 2 (E), Wildhorse Reservoir 1 (F), Eagle Rock Reservoir (G), Wild Horse Reservoir (H). Display/hide their locations on the map
Size of family households: 83 2-persons, 16 3-persons, 12 4-persons, 11 5-persons
Size of nonfamily households: 32 1-person, 31 2-persons
41 married couples with children.
0 single-parent households ().
100.3% of residents of 80729 zip code speak English at home.
1.0% of residents speak Spanish at home (25% very well, 75% well).
Foreign born population: 0 (0.0%)
:
0.0%
Whole state:
9.5%
30%English
24%German
10%Irish
8%Scottish
5%European
4%American
3%Dutch
Facilities with environmental interests located in this zip code:
AGRICULTURAL FLYING SERVICE & SUPPLY (2 MI EAST OF HEREFORD in GROVER, CO)
(Resource Conservation and Recovery Act (tracking hazardous waste))
GRYNBERG PETROLEUM COMPANY (SW NW SEC 26 T9N 62W in GROVER, 10.3 MI S OF, CO)
AIR MINOR (AIRS/AFS) Business SIC classification: CRUDE PETROLEUM AND NATURAL GAS
Housing units lacking complete plumbing facilities: 6.0% Housing units lacking complete kitchen facilities: 6.2%
70.0%Bottled, tank, or LP gas
11.4%Electricity
8.5%Utility gas
8.5%Wood
3.4%Other fuel
Population in 1990: 492. Population change in the 1990s: +34 (+6.9%).
Place of birth for U.S.-born residents:
This state: 258
Northeast: 8
Midwest: 85
South: 22
West: 32
73% of the 80729 zip code residents lived in the same house 5 years ago. Out of people who lived in different houses, 45% lived in this county. Out of people who lived in different counties, 50% lived in Colorado.
91% of the 80729 zip code residents lived in the same house 1 year ago. Out of people who lived in different houses, 34% moved from this county. Out of people who lived in different houses, 66% moved from different state.
Private vs. public school enrollment:
Students in private schools in grades 1 to 8 (elementary and middle school):
Here:
0.0%
Colorado:
11.4%
Students in private schools in grades 9 to 12 (high school):
Here:
0.0%
Colorado:
8.5%
Students in private undergraduate colleges:
Here:
0.0%
Colorado:
14.0%
Occupation by median earnings in the past 12 months ($)
61,344Transportation occupations
58,141Farming, fishing, and forestry occupations
52,652Management occupations
39,710Production occupations
39,186Construction and extraction occupations
37,901Education, training, and library occupations
Top industries in this zip code by the number of employees in 2005:
Real Estate and Rental and Leasing: Lessors of Nonresidential Buildings (except Miniwarehouses) (1-4 employees: 1 establishment)
Information: Television Broadcasting (1-4: 1)
Professional, Scientific, and Technical Services: Veterinary Services (1-4: 1)
Fatal accident statistics in 2014:
Fatal accident count: 1
Vehicles involved in fatal accidents: 1
Fatal accidents caused by drunken drivers: 1
Fatalities: 1
Persons involved in fatal accidents: 3
Pedestrians involved in fatal accidents: 0
Home Mortgage Disclosure Act Aggregated Statistics For Year 2009 (Based on 2 partial tracts)
A) FHA, FSA/RHS & VA Home Purchase Loans
B) Conventional Home Purchase Loans
C) Refinancings
D) Home Improvement Loans
F) Non-occupant Loans on < 5 Family Dwellings (A B C & D)
G) Loans On Manufactured Home Dwelling (A B C & D)
Number
Average Value
Number
Average Value
Number
Average Value
Number
Average Value
Number
Average Value
Number
Average Value
LOANS ORIGINATED
10
$152,084
12
$145,785
41
$203,648
4
$62,870
5
$103,838
10
$137,672
APPLICATIONS APPROVED, NOT ACCEPTED
1
$166,540
2
$87,805
7
$225,170
1
$42,950
2
$196,370
3
$107,687
APPLICATIONS DENIED
2
$94,725
5
$108,992
26
$213,418
2
$37,935
2
$107,610
5
$122,926
APPLICATIONS WITHDRAWN
1
$196,130
1
$149,840
19
$236,742
2
$147,455
1
$126,460
3
$115,323
FILES CLOSED FOR INCOMPLETENESS
0
$0
0
$0
3
$269,300
0
$0
0
$0
0
$0
Aggregated Statistics For Year 2008 (Based on 2 partial tracts)
A) FHA, FSA/RHS & VA Home Purchase Loans
B) Conventional Home Purchase Loans
C) Refinancings
D) Home Improvement Loans
F) Non-occupant Loans on < 5 Family Dwellings (A B C & D)
G) Loans On Manufactured Home Dwelling (A B C & D)
Number
Average Value
Number
Average Value
Number
Average Value
Number
Average Value
Number
Average Value
Number
Average Value
LOANS ORIGINATED
10
$149,793
13
$193,266
30
$191,628
2
$68,000
3
$116,753
13
$136,846
APPLICATIONS APPROVED, NOT ACCEPTED
1
$232,400
1
$256,260
7
$179,086
0
$0
0
$0
1
$138,390
APPLICATIONS DENIED
7
$146,023
6
$101,962
32
$200,275
7
$36,609
1
$127,890
9
$129,799
APPLICATIONS WITHDRAWN
1
$219,030
3
$115,163
10
$128,080
2
$143,400
1
$137,430
3
$74,760
FILES CLOSED FOR INCOMPLETENESS
0
$0
0
$0
1
$295,390
0
$0
0
$0
0
$0
Aggregated Statistics For Year 2007 (Based on 2 partial tracts)
A) FHA, FSA/RHS & VA Home Purchase Loans
B) Conventional Home Purchase Loans
C) Refinancings
D) Home Improvement Loans
F) Non-occupant Loans on < 5 Family Dwellings (A B C & D)
G) Loans On Manufactured Home Dwelling (A B C & D)
Number
Average Value
Number
Average Value
Number
Average Value
Number
Average Value
Number
Average Value
Number
Average Value
LOANS ORIGINATED
9
$146,500
20
$166,090
42
$188,210
9
$49,258
3
$151,273
16
$148,618
APPLICATIONS APPROVED, NOT ACCEPTED
0
$0
4
$121,448
9
$146,182
3
$56,787
1
$146,500
2
$119,775
APPLICATIONS DENIED
1
$189,450
10
$220,132
75
$176,990
16
$89,684
3
$190,563
10
$127,460
APPLICATIONS WITHDRAWN
1
$144,110
4
$154,375
13
$184,052
3
$156,363
1
$41,990
3
$163,043
FILES CLOSED FOR INCOMPLETENESS
0
$0
2
$173,460
4
$264,370
0
$0
0
$0
1
$161,770
Aggregated Statistics For Year 2006 (Based on 2 partial tracts)
A) FHA, FSA/RHS & VA Home Purchase Loans
B) Conventional Home Purchase Loans
C) Refinancings
D) Home Improvement Loans
F) Non-occupant Loans on < 5 Family Dwellings (A B C & D)
G) Loans On Manufactured Home Dwelling (A B C & D)
Number
Average Value
Number
Average Value
Number
Average Value
Number
Average Value
Number
Average Value
Number
Average Value
LOANS ORIGINATED
6
$150,398
40
$146,739
63
$160,157
8
$53,566
6
$140,933
19
$147,857
APPLICATIONS APPROVED, NOT ACCEPTED
0
$0
9
$108,961
16
$182,529
2
$56,310
1
$240,990
1
$261,510
APPLICATIONS DENIED
0
$0
20
$213,952
80
$156,080
10
$64,708
3
$251,960
10
$154,326
APPLICATIONS WITHDRAWN
0
$0
9
$141,146
28
$174,485
2
$145,305
2
$93,295
4
$177,040
FILES CLOSED FOR INCOMPLETENESS
0
$0
1
$71,580
10
$153,563
0
$0
0
$0
0
$0
Aggregated Statistics For Year 2005 (Based on 2 partial tracts)
A) FHA, FSA/RHS & VA Home Purchase Loans
B) Conventional Home Purchase Loans
C) Refinancings
D) Home Improvement Loans
F) Non-occupant Loans on < 5 Family Dwellings (A B C & D)
G) Loans On Manufactured Home Dwelling (A B C & D)
Number
Average Value
Number
Average Value
Number
Average Value
Number
Average Value
Number
Average Value
Number
Average Value
LOANS ORIGINATED
5
$125,694
43
$143,304
74
$166,207
12
$87,328
6
$126,298
17
$125,504
APPLICATIONS APPROVED, NOT ACCEPTED
0
$0
5
$112,714
21
$159,521
2
$41,280
2
$92,815
4
$101,642
APPLICATIONS DENIED
0
$0
29
$143,456
88
$167,454
11
$91,015
8
$99,436
10
$142,587
APPLICATIONS WITHDRAWN
0
$0
11
$140,905
48
$164,982
4
$56,668
3
$99,417
8
$142,026
FILES CLOSED FOR INCOMPLETENESS
0
$0
1
$198,520
13
$177,372
1
$136,000
1
$249,100
0
$0
Aggregated Statistics For Year 2004 (Based on 2 partial tracts)
A) FHA, FSA/RHS & VA Home Purchase Loans
B) Conventional Home Purchase Loans
C) Refinancings
D) Home Improvement Loans
F) Non-occupant Loans on < 5 Family Dwellings (A B C & D)
G) Loans On Manufactured Home Dwelling (A B C & D)
Number
Average Value
Number
Average Value
Number
Average Value
Number
Average Value
Number
Average Value
Number
Average Value
LOANS ORIGINATED
5
$175,228
46
$162,393
92
$169,359
9
$31,919
6
$116,437
18
$151,511
APPLICATIONS APPROVED, NOT ACCEPTED
0
$0
7
$169,679
24
$162,944
0
$0
0
$0
3
$175,133
APPLICATIONS DENIED
2
$226,430
16
$154,464
84
$162,992
11
$78,087
2
$105,225
17
$144,226
APPLICATIONS WITHDRAWN
1
$224,760
5
$150,890
45
$163,192
1
$60,600
0
$0
5
$129,702
FILES CLOSED FOR INCOMPLETENESS
0
$0
1
$99,730
12
$161,850
1
$193,270
0
$0
1
$178,950
Aggregated Statistics For Year 2003 (Based on 2 partial tracts)
A) FHA, FSA/RHS & VA Home Purchase Loans
B) Conventional Home Purchase Loans
C) Refinancings
D) Home Improvement Loans
F) Non-occupant Loans on < 5 Family Dwellings (A B C & D)
Number
Average Value
Number
Average Value
Number
Average Value
Number
Average Value
Number
Average Value
LOANS ORIGINATED
8
$145,844
36
$156,243
137
$162,095
12
$40,124
3
$184,200
APPLICATIONS APPROVED, NOT ACCEPTED
0
$0
8
$192,311
22
$168,191
1
$28,630
3
$156,363
APPLICATIONS DENIED
1
$118,350
16
$135,525
84
$171,400
10
$19,565
5
$154,518
APPLICATIONS WITHDRAWN
1
$168,930
5
$150,032
27
$161,117
1
$21,470
2
$157,715
FILES CLOSED FOR INCOMPLETENESS
0
$0
1
$112,620
5
$191,262
0
$0
0
$0
Aggregated Statistics For Year 2002 (Based on 2 partial tracts)
A) FHA, FSA/RHS & VA Home Purchase Loans
B) Conventional Home Purchase Loans
C) Refinancings
D) Home Improvement Loans
F) Non-occupant Loans on < 5 Family Dwellings (A B C & D)
Number
Average Value
Number
Average Value
Number
Average Value
Number
Average Value
Number
Average Value
LOANS ORIGINATED
4
$139,820
19
$132,059
72
$157,463
8
$41,398
4
$150,080
APPLICATIONS APPROVED, NOT ACCEPTED
0
$0
8
$135,704
11
$152,140
0
$0
1
$42,470
APPLICATIONS DENIED
0
$0
11
$102,295
40
$144,090
4
$13,002
1
$133,620
APPLICATIONS WITHDRAWN
1
$127,890
4
$144,232
21
$145,637
2
$25,530
2
$124,310
FILES CLOSED FOR INCOMPLETENESS
0
$0
1
$214,740
4
$198,278
0
$0
0
$0
Aggregated Statistics For Year 2001 (Based on 2 partial tracts)
A) FHA, FSA/RHS & VA Home Purchase Loans
B) Conventional Home Purchase Loans
C) Refinancings
D) Home Improvement Loans
F) Non-occupant Loans on < 5 Family Dwellings (A B C & D)
Number
Average Value
Number
Average Value
Number
Average Value
Number
Average Value
Number
Average Value
LOANS ORIGINATED
3
$127,093
15
$123,531
47
$136,530
6
$17,180
3
$87,010
APPLICATIONS APPROVED, NOT ACCEPTED
0
$0
2
$63,945
8
$125,742
0
$0
0
$0
APPLICATIONS DENIED
0
$0
9
$111,188
21
$122,777
2
$26,005
0
$0
APPLICATIONS WITHDRAWN
0
$0
2
$169,885
13
$125,577
2
$138,150
0
$0
FILES CLOSED FOR INCOMPLETENESS
0
$0
0
$0
2
$119,300
0
$0
0
$0
Aggregated Statistics For Year 2000 (Based on 2 partial tracts)
A) FHA, FSA/RHS & VA Home Purchase Loans
B) Conventional Home Purchase Loans
C) Refinancings
D) Home Improvement Loans
F) Non-occupant Loans on < 5 Family Dwellings (A B C & D)
Number
Average Value
Number
Average Value
Number
Average Value
Number
Average Value
Number
Average Value
LOANS ORIGINATED
2
$118,345
14
$99,633
14
$129,355
8
$26,068
1
$119,300
APPLICATIONS APPROVED, NOT ACCEPTED
0
$0
4
$75,398
5
$155,280
2
$22,190
0
$0
APPLICATIONS DENIED
1
$121,210
9
$80,753
17
$75,959
5
$23,382
0
$0
APPLICATIONS WITHDRAWN
0
$0
1
$224,280
9
$120,254
0
$0
0
$0
FILES CLOSED FOR INCOMPLETENESS
0
$0
1
$97,830
3
$85,100
0
$0
0
$0
Aggregated Statistics For Year 1999 (Based on 1 partial tract)
A) FHA, FSA/RHS & VA Home Purchase Loans
B) Conventional Home Purchase Loans
C) Refinancings
D) Home Improvement Loans
F) Non-occupant Loans on < 5 Family Dwellings (A B C & D)


 Nearest zip codes: 82054, 80611, 82082, 82053, 80610, 80622.