Estimated zip code population in 2022: 818 Zip code population in 2010: 659 Zip code population in 2000: 585
Houses and condos: 296 Renter-occupied apartments: 43
% of renters here:
17%
State:
34%
March 2022 cost of living index in zip code 80611: 100.9 (near average, U.S. average is 100)
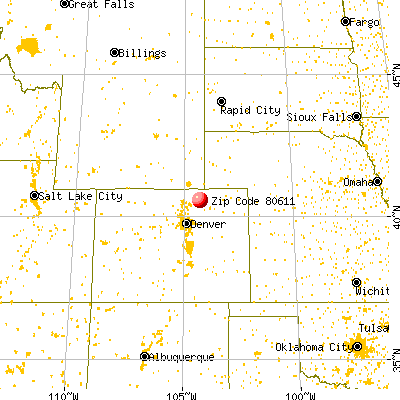
Land area: 384.6 sq. mi. Water area: 0.2 sq. mi.
Population density: 2 people per square mile
(very low).
OSM Map
General Map
Google Map
MSN Map
OSM Map
General Map
Google Map
MSN Map
OSM Map
General Map
Google Map
MSN Map
OSM Map
General Map
Google Map
MSN Map
Please wait while loading the map...
Real estate property taxes paid for housing units in 2022:
This zip code:
0.2% ($1,002)
Colorado:
0.5% ($2,422)
Median real estate property taxes paid for housing units with mortgages in 2022: $1,130 (0.2%) Median real estate property taxes paid for housing units with no mortgage in 2022: $893 (0.3%)
Business Search- 14 Million verified businesses
Males: 387
(47.3%)
Females: 431
(52.7%)
For population 25 years and over in 80611:
High school or higher: 94.9%
Bachelor's degree or higher: 21.2%
Graduate or professional degree: 4.8%
Unemployed: 1.7%
Mean travel time to work (commute): 36.8 minutes
For population 15 years and over in 80611:
Never married: 24.9%
Now married: 63.7%
Separated: 0.0%
Widowed: 5.4%
Divorced: 6.0%
Zip code 80611 compared to state average:
Unemployed percentage below state average.
Black race population percentage significantly below state average.
Foreign-born population percentage significantly below state average.
Renting percentage below state average.
Length of stay since moving in significantly above state average.
Number of college students significantly below state average.
Percentage of population with a bachelor's degree or higher below state average.
Averages for the 2020 tax year for zip code 80611, filed in 2021:
Average Adjusted Gross Income (AGI) in 2020: $68,109 (Individual Income Tax Returns)
Here:
$68,109
State:
$89,260
Salary/wage: $55,710 (reported on 82.9% of returns)
Here:
$55,710
State:
$70,330
(% of AGI for various income ranges: 1205.0% for AGIs below $25k, 3934.0% for AGIs $25k-50k, 7588.0% for AGIs $50k-75k, 12220.0% for AGIs $75k-100k, 20020.0% for AGIs $100k-200k)
Taxable interest for individuals: $645 (reported on 31.4% of returns)
This zip code:
$645
Colorado:
$2,176
(% of AGI for various income ranges: 13.3% for AGIs below $25k, 6.0% for AGIs $50k-75k, 50.0% for AGIs $75k-100k, 150.0% for AGIs $100k-200k)
Ordinary dividends: $1,567 (reported on 17.1% of returns)
Here:
$1,567
State:
$8,820
(% of AGI for various income ranges: 66.0% for AGIs $50k-75k, 203.3% for AGIs $100k-200k)
Net capital gain/loss in AGI: +$11,880 (reported on 14.3% of returns)
Here:
+$11,880
State:
+$37,276
(% of AGI for various income ranges: 120.0% for AGIs $50k-75k, 1780.0% for AGIs $100k-200k)
Profit/loss from business: +$3,078 (reported on 25.7% of returns)
Here:
+$3,078
State:
+$15,295
(% of AGI for various income ranges: 283.3% for AGIs below $25k, 12.0% for AGIs $50k-75k, 336.7% for AGIs $100k-200k)
Total itemized deductions: $21,567 (reported on 8.6% of returns)
Here:
$21,567
State:
$35,141
(% of AGI for various income ranges: 1294.0% for AGIs $50k-75k)
Taxes paid: $4,867 (reported on 8.6% of returns)
80611:
$4,867
State:
$7,710
(% of AGI for various income ranges: 292.0% for AGIs $50k-75k)
Earned income credit: $3,067 (reported on 8.6% of returns)
Here:
$3,067
State:
$2,053
(% of AGI for various income ranges: 153.3% for AGIs below $25k)
Percentage of individuals using paid preparers for their 2020 taxes: 91.4%
Here:
91%
State:
93%
(% for various income ranges: 88.9% for AGIs below $25k, 85.7% for AGIs $25k-50k, 87.5% for AGIs $50k-75k, 100.0% for AGIs $75k-100k, 100.0% for AGIs $100k-200k)
Averages for the 2012 tax year for zip code 80611, filed in 2013:
Average Adjusted Gross Income (AGI) in 2012: $63,643 (Individual Income Tax Returns)
Here:
$63,643
State:
$69,103
Salary/wage: $47,830 (reported on 82.1% of returns)
Here:
$47,830
State:
$54,794
(% of AGI for various income ranges: 72.6% for AGIs below $25k, 86.3% for AGIs $25k-50k, 89.2% for AGIs $50k-75k, 79.2% for AGIs $75k-100k, 41.5% for AGIs $100k-200k)
Taxable interest for individuals: $700 (reported on 35.7% of returns)
This zip code:
$700
Colorado:
$1,971
(% of AGI for various income ranges: 1.1% for AGIs below $25k, 0.6% for AGIs $100k-200k)
Ordinary dividends: $650 (reported on 14.3% of returns)
Here:
$650
State:
$7,140
Net capital gain/loss in AGI: +$15,000 (reported on 21.4% of returns)
Here:
+$15,000
State:
+$23,009
Profit/loss from business: +$3,140 (reported on 17.9% of returns)
Here:
+$3,140
State:
+$13,514
Total itemized deductions: $18,720 (20% of AGI, reported on 35.7% of returns)
Here:
$18,720
State:
$24,621
Here:
19.7% of AGI
State:
18.5% of AGI
(% of AGI for various income ranges: 33.2% for AGIs below $25k, 20.9% for AGIs $50k-75k, 9.7% for AGIs $100k-200k)
Charity contributions: $4,457 (reported on 25.0% of returns)
Here:
$4,457
State:
$4,449
Taxes paid: $4,560 (reported on 35.7% of returns)
80611:
$4,560
State:
$7,641
(% of AGI for various income ranges: 3.6% for AGIs below $25k, 4.2% for AGIs $50k-75k, 3.1% for AGIs $100k-200k)
Earned income credit: $2,267 (reported on 10.7% of returns)
Here:
$2,267
State:
$2,095
(% of AGI for various income ranges: 7.5% for AGIs below $25k)
Percentage of individuals using paid preparers for their 2012 taxes: 64.3%
Here:
64%
State:
49%
(% for various income ranges: 55.6% for AGIs below $25k, 60.0% for AGIs $25k-50k, 100.0% for AGIs $50k-75k, 83.3% for AGIs $100k-200k)
Averages for the 2004 tax year for zip code 80611, filed in 2005:
Average Adjusted Gross Income (AGI) in 2004: $37,014 (Individual Income Tax Returns)
Here:
$37,014
State:
$55,014
Salary/wage: $35,526 (reported on 82.0% of returns)
Here:
$35,526
State:
$46,010
(% of AGI for various income ranges: 84.1% for AGIs $10k-25k, 76.4% for AGIs $25k-50k, 86.9% for AGIs $50k-75k, 93.6% for AGIs $75k-100k, 49.7% for AGIs over 100k)
Taxable interest for individuals: $608 (reported on 45.0% of returns)
This zip code:
$608
Colorado:
$2,127
(% of AGI for various income ranges: 1.0% for AGIs $10k-25k, 0.8% for AGIs $25k-50k, 0.2% for AGIs $50k-75k, 0.9% for AGIs over 100k)
Taxable dividends: $250 (reported on 14.4% of returns)
Here:
$250
State:
$3,782
Net capital gain/loss: +$4,771 (reported on 17.3% of returns)
Here:
+$4,771
State:
+$17,882
Profit/loss from business: +$1,067 (reported on 21.6% of returns)
Here:
+$1,067
State:
+$11,247
(% of AGI for various income ranges: 7.8% for AGIs $10k-25k, -0.9% for AGIs $25k-50k, -0.1% for AGIs $50k-75k)
Total itemized deductions: $18,519 (31% of AGI, reported on 38.8% of returns)
Here:
$18,519
State:
$20,560
Here:
30.6% of AGI
State:
21.4% of AGI
(% of AGI for various income ranges: 22.8% for AGIs $10k-25k, 19.9% for AGIs $25k-50k, 25.1% for AGIs $50k-75k, 16.0% for AGIs over 100k)
Charity contributions deductions: $1,833 (3% of AGI, reported on 30.2% of returns)
Here:
$1,833
State:
$3,518
Here:
2.9% of AGI
State:
3.4% of AGI
Total tax: $4,775 (reported on 73.4% of returns)
80611:
$4,775
State:
$9,173
(% of AGI for various income ranges: 5.2% for AGIs $10k-25k, 6.2% for AGIs $25k-50k, 7.5% for AGIs $50k-75k, 9.1% for AGIs $75k-100k, 16.6% for AGIs over 100k)
Earned income credit: $1,769 (reported on 9.4% of returns)
Here:
$1,769
State:
$1,595
Percentage of individuals using paid preparers for their 2004 taxes: 68.0%
Here:
68%
State:
55%
(% for various income ranges: 56.1% for AGIs below $10k, 59.6% for AGIs $10k-25k, 79.1% for AGIs $25k-50k, 78.4% for AGIs $50k-75k, 88.9% for AGIs over 100k)
Household received Food Stamps/SNAP in the past 12 months: 3 Household did not receive Food Stamps/SNAP in the past 12 months: 254
Women who had a birth in the past 12 months: 11 (7 now married, 3 unmarried) Women who did not have a birth in the past 12 months: 172 (83 now married, 88 unmarried)
Housing units in zip code 80611 with a mortgage: 129 (4 second mortgage, 1 both second mortgage and home equity loan) Houses without a mortgage: 5
Median monthly owner costs for units with a mortgage: $1,876 Median monthly owner costs for units without a mortgage: $447
Residents with income below the poverty level in 2022:
This zip code:
3.2%
Whole state:
9.4%
Residents with income below 50% of the poverty level in 2022:
This zip code:
1.9%
Whole state:
4.6%
Median number of rooms in houses and condos:
Here:
6.3
State:
6.8
Median number of rooms in apartments:
Here:
6.4
State:
4.0
Notable locations in this zip code not listed on our city pages
Notable locations in zip code 80611: Gilney Windmill (A), Saddle Windmill (B), Crow Valley Recreation Area (C), Lee Windmill (D), Seven Cross Windmill (E), Hoffman Windmill (F), Pawnee Work Center (G), Missile Windmill (H), Arrowhead Windmill (I), Test Windmill (J), Sand Creek Windmill (K), Big Bend Windmill (L), Howard Windmill (M), Stone Corral Windmill (N), Mitchell Windmill (O), McCartney Windmill (P), Rand Windmill (Q), Kaw Windmill (R), Noble Windmill (S), Murphy Windmill (T). Display/hide their locations on the map
Lakes and reservoirs: Greasewood Lake (A), Dutch Girl Lake (B), Bidwell Lake (C), Howard Reservoir (D), Seven Reverse Y Number 1 Reservoir (E), Klingenberg Flood Control Number 1 Reservoir (F), Reno Reservoir (G), Sand Reservoir Number 2 (H). Display/hide their locations on the map
Size of family households: 87 2-persons, 29 3-persons, 42 4-persons, 22 5-persons, 10 6-persons, 20 7-or-more-persons
Size of nonfamily households: 41 1-person
153 married couples with children.
16 single-parent households (16 women).
97.9% of residents of 80611 zip code speak English at home.
1.0% of residents speak Spanish at home (100% very well).
0.8% of residents speak other Indo-European language at home (100% very well).
Foreign born population: 2 (0.3%) (100.0% of them are naturalized citizens)
This zip code:
0.3%
Whole state:
9.5%
100%Ukraine
25%German
20%Irish
16%English
12%American
5%Italian
4%European
2%Scandinavian
Year of entry for the foreign-born population
02010 or later
02000 to 2009
01990 to 1999
4Before 1990
Public high school in in zip code 80611 not listed on the city page:
Major facilities with environmental interests located in this zip code:
BRIGGSDALE ELEMENTARY SCHOOL (415 LESLIE STREET in BRIGGSDALE, CO)
(National Center for Education Statistics) - STATE ID-1008 Organizations: BRIGGSDALE RE-10 (SCHOOL DISTRICT)
BRIGGSDALE UNDIVIDED HIGH SCHOOL (515 LESLIE STREET in BRIGGSDALE, CO)
(National Center for Education Statistics) - STATE ID-1012 Organizations: BRIGGSDALE RE-10 (SCHOOL DISTRICT)
AGLAND, INC. (38657 HIGHWAY 14 in BRIGGSDALE, CO)
AIR MINOR (AIRS/AFS) CRITERIA AND HAZARDOUS AIR POLLUTANT INVENTORY (Inventory of air pollution sources) Business SIC classification: PETROLEUM BULK STATIONS AND TERMINALS Alternative names: AGLAND INC
BRIGGSDALE SCHOOL (415 LESLIE in BRIGGSDALE, CO)
(Resource Conservation and Recovery Act (tracking hazardous waste)) Organizations: WELD SCHOOL DISTRICT (CONTACT/OWNER)
CFG ENERGY INC - WILLIAMS 8-1 (NE SW SEC 8 T5N R61W in BRIGGSDALE, CO)
AIR MINOR (AIRS/AFS) CRITERIA AND HAZARDOUS AIR POLLUTANT INVENTORY (Inventory of air pollution sources) Business SIC classification: NATURAL GAS LIQUIDS
DAN DAVIS & SONS TRUCKING (44287 WCR 77 in BRIGGSDALE, CO)
(Resource Conservation and Recovery Act (tracking hazardous waste)) Organizations: DANIEL E DAVIS (CONTACT/OWNER)
BONANZA CREEK - PRONGHORN 11-17 BATTERY (NW NW SEC 17 T5N R61W in BRIGGSDALE, CO)
AIR MINOR (AIRS/AFS) Business SIC classification: NATURAL GAS LIQUIDS
BONANZA CREEK - PRONGHORN 12-10 BATTERY (SW NW SEC 10 T5N R61W in BRIGGSDALE, CO)
AIR MINOR (AIRS/AFS) Business SIC classification: NATURAL GAS LIQUIDS
BONANZA CREEK - PRONGHORN 12-9 BATTERY (SW NW SEC 9 T5N R61W in BRIGGSDALE, CO)
AIR MINOR (AIRS/AFS) Business SIC classification: NATURAL GAS LIQUIDS
BONANZA CREEK - PRONGHORN 14-4 BATTERY (SW SW SEC 4 T5N R61W in BRIGGSDALE, CO)
AIR MINOR (AIRS/AFS) Business SIC classification: NATURAL GAS LIQUIDS
BONANZA CREEK - PRONGHORN 31-17 BATTERY (NW NE SEC 17 T5N R61W in BRIGGSDALE, CO)
AIR MINOR (AIRS/AFS) Business SIC classification: NATURAL GAS LIQUIDS
BONANZA CREEK - PRONGHORN 31-8 BATTERY (NW NE SEC 8 T5N R61W in BRIGGSDALE, CO)
AIR MINOR (AIRS/AFS) Business SIC classification: NATURAL GAS LIQUIDS
BONANZA CREEK - PRONGHORN 32-8 BATTERY (SW NE SEC 8 T5N R61W in BRIGGSDALE, CO)
AIR MINOR (AIRS/AFS) Business SIC classification: NATURAL GAS LIQUIDS
Housing units lacking complete plumbing facilities: 5.7% Housing units lacking complete kitchen facilities: 2.8%
67.4%Bottled, tank, or LP gas
20.7%Electricity
11.8%Wood
0.8%Utility gas
Population in 1990: 259. Population change in the 1990s: +326 (+125.9%).
Place of birth for U.S.-born residents:
This state: 520
Northeast: 5
Midwest: 145
South: 25
West: 115
54% of the 80611 zip code residents lived in the same house 5 years ago. Out of people who lived in different houses, 66% lived in this county. Out of people who lived in different counties, 50% lived in Colorado.
91% of the 80611 zip code residents lived in the same house 1 year ago. Out of people who lived in different houses, 59% moved from this county. Out of people who lived in different houses, 22% moved from different county within same state. Out of people who lived in different houses, 18% moved from different state.
Private vs. public school enrollment:
Students in private schools in grades 1 to 8 (elementary and middle school): 5
Here:
6.2%
Colorado:
11.4%
Students in private schools in grades 9 to 12 (high school): 1
Here:
2.5%
Colorado:
8.5%
Students in private undergraduate colleges:
Here:
0.0%
Colorado:
14.0%
Occupation by median earnings in the past 12 months ($)
117,048Production occupations
68,626Construction and extraction occupations
62,225Health technologists and technicians
58,809Business and financial operations occupations
57,766Office and administrative support occupations
57,487Management occupations
Top industries in this zip code by the number of employees in 2005:
Accommodation and Food Services: Food Service Contractors (5-9 employees: 1 establishment)
Construction: Painting and Wall Covering Contractors (1-4: 1)
Professional, Scientific, and Technical Services: Graphic Design Services (1-4: 1)
Construction: Site Preparation Contractors (1-4: 1)
Utilities: Water Supply and Irrigation Systems (1-4: 1)
Finance and Insurance: Investment Advice (1-4: 1)
Accommodation and Food Services: Full-Service Restaurants (1-4: 1)
Fatal accident statistics in 2014:
Fatal accident count: 1
Vehicles involved in fatal accidents: 1
Fatal accidents caused by drunken drivers: 0
Fatalities: 1
Persons involved in fatal accidents: 2
Pedestrians involved in fatal accidents: 0
Fatal accident statistics in 2013:
Fatal accident count: 1
Vehicles involved in fatal accidents: 1
Fatal accidents caused by drunken drivers: 0
Fatalities: 1
Persons involved in fatal accidents: 2
Pedestrians involved in fatal accidents: 0
Home Mortgage Disclosure Act Aggregated Statistics For Year 2009 (Based on 2 partial tracts)
A) FHA, FSA/RHS & VA Home Purchase Loans
B) Conventional Home Purchase Loans
C) Refinancings
D) Home Improvement Loans
F) Non-occupant Loans on < 5 Family Dwellings (A B C & D)
G) Loans On Manufactured Home Dwelling (A B C & D)
Number
Average Value
Number
Average Value
Number
Average Value
Number
Average Value
Number
Average Value
Number
Average Value
LOANS ORIGINATED
8
$158,155
10
$145,540
34
$204,303
3
$69,740
4
$107,985
8
$143,169
APPLICATIONS APPROVED, NOT ACCEPTED
1
$138,550
2
$73,050
6
$218,548
1
$35,730
2
$163,365
3
$89,590
APPLICATIONS DENIED
2
$78,805
4
$113,342
21
$219,825
2
$31,560
2
$89,525
4
$127,835
APPLICATIONS WITHDRAWN
1
$163,170
1
$124,660
16
$233,882
2
$122,675
1
$105,210
2
$143,910
FILES CLOSED FOR INCOMPLETENESS
0
$0
0
$0
2
$336,060
0
$0
0
$0
0
$0
Aggregated Statistics For Year 2008 (Based on 2 partial tracts)
A) FHA, FSA/RHS & VA Home Purchase Loans
B) Conventional Home Purchase Loans
C) Refinancings
D) Home Improvement Loans
F) Non-occupant Loans on < 5 Family Dwellings (A B C & D)
G) Loans On Manufactured Home Dwelling (A B C & D)
Number
Average Value
Number
Average Value
Number
Average Value
Number
Average Value
Number
Average Value
Number
Average Value
LOANS ORIGINATED
8
$155,772
11
$190,018
25
$191,306
2
$56,575
3
$97,133
11
$134,547
APPLICATIONS APPROVED, NOT ACCEPTED
1
$193,340
1
$213,190
6
$173,820
0
$0
0
$0
1
$115,130
APPLICATIONS DENIED
6
$141,728
5
$101,790
27
$197,471
6
$35,532
1
$106,400
8
$121,482
APPLICATIONS WITHDRAWN
1
$182,220
3
$95,810
8
$133,194
2
$119,300
1
$114,340
2
$93,295
FILES CLOSED FOR INCOMPLETENESS
0
$0
0
$0
1
$245,740
0
$0
0
$0
0
$0
Aggregated Statistics For Year 2007 (Based on 2 partial tracts)
A) FHA, FSA/RHS & VA Home Purchase Loans
B) Conventional Home Purchase Loans
C) Refinancings
D) Home Improvement Loans
F) Non-occupant Loans on < 5 Family Dwellings (A B C & D)
G) Loans On Manufactured Home Dwelling (A B C & D)
Number
Average Value
Number
Average Value
Number
Average Value
Number
Average Value
Number
Average Value
Number
Average Value
LOANS ORIGINATED
7
$156,701
17
$162,560
35
$187,895
8
$46,101
3
$125,850
13
$152,173
APPLICATIONS APPROVED, NOT ACCEPTED
0
$0
3
$134,717
7
$156,361
2
$70,865
1
$121,880
2
$99,645
APPLICATIONS DENIED
1
$157,610
8
$228,920
63
$175,291
13
$91,829
3
$158,537
8
$132,549
APPLICATIONS WITHDRAWN
1
$119,890
4
$128,430
11
$180,960
3
$130,083
1
$34,940
2
$203,465
FILES CLOSED FOR INCOMPLETENESS
0
$0
2
$144,310
4
$219,938
0
$0
0
$0
1
$134,580
Aggregated Statistics For Year 2006 (Based on 2 partial tracts)
A) FHA, FSA/RHS & VA Home Purchase Loans
B) Conventional Home Purchase Loans
C) Refinancings
D) Home Improvement Loans
F) Non-occupant Loans on < 5 Family Dwellings (A B C & D)
G) Loans On Manufactured Home Dwelling (A B C & D)
Number
Average Value
Number
Average Value
Number
Average Value
Number
Average Value
Number
Average Value
Number
Average Value
LOANS ORIGINATED
5
$150,146
33
$147,973
52
$161,426
7
$50,930
5
$140,696
16
$146,071
APPLICATIONS APPROVED, NOT ACCEPTED
0
$0
7
$116,549
13
$186,895
2
$46,845
1
$200,490
1
$217,560
APPLICATIONS DENIED
0
$0
17
$209,406
67
$155,043
9
$59,814
3
$209,617
9
$142,656
APPLICATIONS WITHDRAWN
0
$0
8
$132,101
23
$176,717
2
$120,885
2
$77,615
4
$147,288
FILES CLOSED FOR INCOMPLETENESS
0
$0
1
$59,550
8
$159,694
0
$0
0
$0
0
$0
Aggregated Statistics For Year 2005 (Based on 2 partial tracts)
A) FHA, FSA/RHS & VA Home Purchase Loans
B) Conventional Home Purchase Loans
C) Refinancings
D) Home Improvement Loans
F) Non-occupant Loans on < 5 Family Dwellings (A B C & D)
G) Loans On Manufactured Home Dwelling (A B C & D)
Number
Average Value
Number
Average Value
Number
Average Value
Number
Average Value
Number
Average Value
Number
Average Value
LOANS ORIGINATED
4
$130,712
36
$142,402
62
$165,037
10
$87,181
5
$126,088
14
$126,785
APPLICATIONS APPROVED, NOT ACCEPTED
0
$0
4
$117,215
17
$163,938
2
$34,340
2
$77,215
3
$112,747
APPLICATIONS DENIED
0
$0
24
$144,210
73
$167,936
9
$92,546
7
$94,543
8
$148,280
APPLICATIONS WITHDRAWN
0
$0
9
$143,273
40
$164,706
3
$62,860
2
$124,065
7
$135,037
FILES CLOSED FOR INCOMPLETENESS
0
$0
1
$165,150
11
$174,391
1
$113,150
1
$207,230
0
$0
Aggregated Statistics For Year 2004 (Based on 2 partial tracts)
A) FHA, FSA/RHS & VA Home Purchase Loans
B) Conventional Home Purchase Loans
C) Refinancings
D) Home Improvement Loans
F) Non-occupant Loans on < 5 Family Dwellings (A B C & D)
G) Loans On Manufactured Home Dwelling (A B C & D)
Number
Average Value
Number
Average Value
Number
Average Value
Number
Average Value
Number
Average Value
Number
Average Value
LOANS ORIGINATED
4
$182,222
38
$163,543
77
$168,344
8
$29,874
5
$116,242
15
$151,257
APPLICATIONS APPROVED, NOT ACCEPTED
0
$0
6
$164,688
20
$162,671
0
$0
0
$0
3
$145,700
APPLICATIONS DENIED
2
$188,375
13
$158,158
69
$165,077
10
$71,460
2
$87,540
14
$145,699
APPLICATIONS WITHDRAWN
1
$186,990
4
$156,915
37
$165,120
1
$50,420
0
$0
4
$134,880
FILES CLOSED FOR INCOMPLETENESS
0
$0
1
$82,970
10
$161,579
1
$160,790
0
$0
1
$148,880
Aggregated Statistics For Year 2003 (Based on 2 partial tracts)
A) FHA, FSA/RHS & VA Home Purchase Loans
B) Conventional Home Purchase Loans
C) Refinancings
D) Home Improvement Loans
F) Non-occupant Loans on < 5 Family Dwellings (A B C & D)
Number
Average Value
Number
Average Value
Number
Average Value
Number
Average Value
Number
Average Value
LOANS ORIGINATED
7
$138,667
30
$155,981
114
$162,060
10
$40,057
3
$153,243
APPLICATIONS APPROVED, NOT ACCEPTED
0
$0
7
$182,847
18
$171,019
1
$23,820
2
$195,125
APPLICATIONS DENIED
1
$98,460
13
$138,767
70
$171,113
8
$20,346
4
$160,685
APPLICATIONS WITHDRAWN
1
$140,540
4
$156,020
23
$157,350
1
$17,870
2
$131,210
FILES CLOSED FOR INCOMPLETENESS
0
$0
1
$93,690
4
$198,898
0
$0
0
$0
Aggregated Statistics For Year 2002 (Based on 2 partial tracts)
A) FHA, FSA/RHS & VA Home Purchase Loans
B) Conventional Home Purchase Loans
C) Refinancings
D) Home Improvement Loans
F) Non-occupant Loans on < 5 Family Dwellings (A B C & D)
Number
Average Value
Number
Average Value
Number
Average Value
Number
Average Value
Number
Average Value
LOANS ORIGINATED
4
$116,320
16
$130,464
60
$157,199
7
$39,360
3
$166,477
APPLICATIONS APPROVED, NOT ACCEPTED
0
$0
6
$150,530
9
$154,698
0
$0
1
$35,330
APPLICATIONS DENIED
0
$0
9
$104,014
33
$145,302
3
$14,423
1
$111,160
APPLICATIONS WITHDRAWN
1
$106,400
4
$119,992
18
$141,354
2
$21,240
2
$103,420
FILES CLOSED FOR INCOMPLETENESS
0
$0
1
$178,650
4
$164,952
0
$0
0
$0
Aggregated Statistics For Year 2001 (Based on 2 partial tracts)
A) FHA, FSA/RHS & VA Home Purchase Loans
B) Conventional Home Purchase Loans
C) Refinancings
D) Home Improvement Loans
F) Non-occupant Loans on < 5 Family Dwellings (A B C & D)
Number
Average Value
Number
Average Value
Number
Average Value
Number
Average Value
Number
Average Value
LOANS ORIGINATED
2
$158,600
12
$128,462
39
$136,884
5
$17,150
2
$108,580
APPLICATIONS APPROVED, NOT ACCEPTED
0
$0
2
$53,200
7
$119,554
0
$0
0
$0
APPLICATIONS DENIED
0
$0
8
$104,064
17
$126,176
2
$21,635
0
$0
APPLICATIONS WITHDRAWN
0
$0
2
$141,330
11
$123,467
2
$114,930
0
$0
FILES CLOSED FOR INCOMPLETENESS
0
$0
0
$0
2
$99,250
0
$0
0
$0
Aggregated Statistics For Year 2000 (Based on 2 partial tracts)
A) FHA, FSA/RHS & VA Home Purchase Loans
B) Conventional Home Purchase Loans
C) Refinancings
D) Home Improvement Loans
F) Non-occupant Loans on < 5 Family Dwellings (A B C & D)
Number
Average Value
Number
Average Value
Number
Average Value
Number
Average Value
Number
Average Value
LOANS ORIGINATED
2
$98,455
12
$96,702
12
$125,552
6
$28,915
1
$99,250
APPLICATIONS APPROVED, NOT ACCEPTED
0
$0
3
$83,633
4
$161,480
2
$18,460
0
$0
APPLICATIONS DENIED
1
$100,840
7
$86,376
14
$76,734
4
$24,318
0
$0
APPLICATIONS WITHDRAWN
0
$0
1
$186,590
8
$112,550
0
$0
0
$0
FILES CLOSED FOR INCOMPLETENESS
0
$0
1
$81,390
2
$106,200
0
$0
0
$0
Aggregated Statistics For Year 1999 (Based on 1 partial tract)
A) FHA, FSA/RHS & VA Home Purchase Loans
B) Conventional Home Purchase Loans
C) Refinancings
D) Home Improvement Loans
F) Non-occupant Loans on < 5 Family Dwellings (A B C & D)


 Nearest zip codes: 80622, 80644, 80649, 80624, 80729, 80610.


 (Students: 72, Location: 515 LESLIE STREET, Grades: 6-12)


