Estimated zip code population in 2022: 449 Zip code population in 2010: 505 Zip code population in 2000: 472
Houses and condos: 210 Renter-occupied apartments: 34
% of renters here:
19%
State:
29%
March 2022 cost of living index in zip code 84069: 85.5 (less than average, U.S. average is 100)
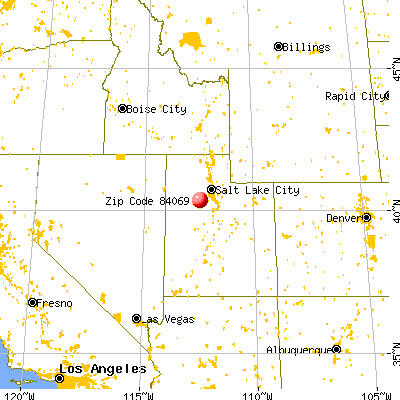
Land area: 64.1 sq. mi. Water area: 0.0 sq. mi.
Population density: 7 people per square mile
(very low).
OSM Map
General Map
Google Map
MSN Map
OSM Map
General Map
Google Map
MSN Map
OSM Map
General Map
Google Map
MSN Map
OSM Map
General Map
Google Map
MSN Map
Please wait while loading the map...
Real estate property taxes paid for housing units in 2022:
This zip code:
0.5% ($1,929)
Utah:
0.5% ($2,376)
Median real estate property taxes paid for housing units with mortgages in 2022: $1,827 (0.4%) Median real estate property taxes paid for housing units with no mortgage in 2022: $2,155 (0.5%)
Business Search- 14 Million verified businesses
Males: 230
(51.3%)
Females: 219
(48.7%)
For population 25 years and over in 84069:
High school or higher: 93.2%
Bachelor's degree or higher: 15.1%
Graduate or professional degree: 4.0%
Unemployed: 1.2%
Mean travel time to work (commute): 40.7 minutes
For population 15 years and over in 84069:
Never married: 21.6%
Now married: 61.7%
Separated: 0.0%
Widowed: 5.5%
Divorced: 11.2%
Zip code 84069 compared to state average:
Unemployed percentage below state average.
Hispanic race population percentage significantly below state average.
Median age significantly above state average.
Foreign-born population percentage significantly below state average.
Length of stay since moving in significantly above state average.
House age above state average.
Number of college students below state average.
Percentage of population with a bachelor's degree or higher below state average.
Estimated median house/condo value in 2022: $420,142
84069:
$420,142
Utah:
$499,500
According to our research of Utah and other state lists, there was 1 registered sex offender living in 84069 zip code as of May 28, 2024. The ratio of all residents to sex offenders in zip code 84069 is 448 to 1. The ratio of registered sex offenders to all residents in this zip code is near the state average.
Median resident age:
This zip code:
45.2 years
Utah median age:
32.1 years
Average household size:
This zip code:
2.5 people
Utah:
3.0 people
Averages for the 2020 tax year for zip code 84069, filed in 2021:
Average Adjusted Gross Income (AGI) in 2020: $59,546 (Individual Income Tax Returns)
Here:
$59,546
State:
$81,660
Salary/wage: $57,552 (reported on 87.5% of returns)
Here:
$57,552
State:
$63,027
(% of AGI for various income ranges: 1218.0% for AGIs below $25k, 3922.0% for AGIs $25k-50k, 6976.7% for AGIs $50k-75k, 12240.0% for AGIs $75k-100k, 16583.3% for AGIs $100k-200k)
Taxable interest for individuals: $183 (reported on 25.0% of returns)
This zip code:
$183
Utah:
$2,255
(% of AGI for various income ranges: 18.0% for AGIs $25k-50k, 10.0% for AGIs $75k-100k)
Earned income credit: $1,100 (reported on 8.3% of returns)
Here:
$1,100
State:
$2,169
(% of AGI for various income ranges: 44.0% for AGIs below $25k)
Percentage of individuals using paid preparers for their 2020 taxes: 100.0%
Here:
100%
State:
94%
(% for various income ranges: 100.0% for AGIs below $25k, 100.0% for AGIs $25k-50k, 100.0% for AGIs $50k-75k, 100.0% for AGIs $75k-100k, 100.0% for AGIs $100k-200k)
Averages for the 2012 tax year for zip code 84069, filed in 2013:
Average Adjusted Gross Income (AGI) in 2012: $55,225 (Individual Income Tax Returns)
Here:
$55,225
State:
$60,327
Salary/wage: $52,650 (reported on 90.0% of returns)
Here:
$52,650
State:
$48,762
(% of AGI for various income ranges: 67.3% for AGIs below $25k, 75.9% for AGIs $25k-50k, 91.3% for AGIs $50k-75k, 88.3% for AGIs $100k-200k)
Taxable interest for individuals: $229 (reported on 35.0% of returns)
This zip code:
$229
Utah:
$1,534
Total itemized deductions: $17,888 (23% of AGI, reported on 40.0% of returns)
Here:
$17,888
State:
$25,197
Here:
22.8% of AGI
State:
22.4% of AGI
Charity contributions: $3,157 (reported on 35.0% of returns)
Here:
$3,157
State:
$8,502
Taxes paid: $4,900 (reported on 40.0% of returns)
84069:
$4,900
State:
$7,001
Percentage of individuals using paid preparers for their 2012 taxes: 75.0%
Here:
75%
State:
51%
(% for various income ranges: 80.0% for AGIs below $25k, 66.7% for AGIs $25k-50k, 66.7% for AGIs $50k-75k, 100.0% for AGIs $100k-200k)
Averages for the 2004 tax year for zip code 84069, filed in 2005:
Average Adjusted Gross Income (AGI) in 2004: $40,687 (Individual Income Tax Returns)
Here:
$40,687
State:
$45,498
Salary/wage: $42,267 (reported on 81.6% of returns)
Here:
$42,267
State:
$38,975
(% of AGI for various income ranges: 78.1% for AGIs below $10k, 57.8% for AGIs $10k-25k, 81.7% for AGIs $25k-50k, 92.3% for AGIs $50k-75k, 88.6% for AGIs $75k-100k)
Taxable interest for individuals: $357 (reported on 46.9% of returns)
This zip code:
$357
Utah:
$1,445
(% of AGI for various income ranges: 1.5% for AGIs $10k-25k, 0.7% for AGIs $25k-50k, 0.2% for AGIs $50k-75k, 0.1% for AGIs $75k-100k)
Taxable dividends: $154 (reported on 7.3% of returns)
Here:
$154
State:
$3,152
Net capital gain/loss: +$200 (reported on 5.6% of returns)
Here:
+$200
State:
+$14,059
Total itemized deductions: $16,323 (26% of AGI, reported on 36.3% of returns)
Here:
$16,323
State:
$20,312
Here:
26.2% of AGI
State:
24.9% of AGI
Charity contributions deductions: $3,123 (5% of AGI, reported on 31.8% of returns)
Here:
$3,123
State:
$6,250
Here:
5.2% of AGI
State:
7.4% of AGI
Total tax: $3,746 (reported on 79.3% of returns)
84069:
$3,746
State:
$6,523
(% of AGI for various income ranges: 3.9% for AGIs $10k-25k, 5.7% for AGIs $25k-50k, 6.6% for AGIs $50k-75k, 11.1% for AGIs $75k-100k)
Percentage of individuals using paid preparers for their 2004 taxes: 61.5%
Here:
61%
State:
53%
(% for various income ranges: 45.8% for AGIs below $10k, 77.8% for AGIs $10k-25k, 55.1% for AGIs $25k-50k, 61.5% for AGIs $50k-75k, 59.1% for AGIs $75k-100k)
Household received Food Stamps/SNAP in the past 12 months: 2 Household did not receive Food Stamps/SNAP in the past 12 months: 176
Women who had a birth in the past 12 months: 1 (1 now married, 0 unmarried) Women who did not have a birth in the past 12 months: 86 (44 now married, 41 unmarried)
Housing units in zip code 84069 with a mortgage: 64 (6 second mortgage, 5 both second mortgage and home equity loan) Houses without a mortgage: 3
Median monthly owner costs for units with a mortgage: $1,476 Median monthly owner costs for units without a mortgage: $465
Residents with income below the poverty level in 2022:
This zip code:
6.7%
Whole state:
8.2%
Residents with income below 50% of the poverty level in 2022:
This zip code:
0.6%
Whole state:
4.3%
Median number of rooms in houses and condos:
Here:
6.8
State:
7.6
Median number of rooms in apartments:
Here:
4.7
State:
4.3
Notable locations in this zip code not listed on our city pages
Size of family households: 52 2-persons, 16 3-persons, 25 4-persons, 8 5-persons, 7 6-persons, 5 7-or-more-persons
Size of nonfamily households: 49 1-person, 12 2-persons
88 married couples with children.
14 single-parent households (14 women).
97.7% of residents of 84069 zip code speak English at home.
1.1% of residents speak Spanish at home (40% very well, 40% well, 20% not well).
0.9% of residents speak other Indo-European language at home (100% very well).
Foreign born population: 2 (0.5%) (0.0% of them are naturalized citizens)
:
0.5%
Whole state:
8.6%
100%Honduras
31%English
11%American
10%European
6%Swedish
5%German
4%Scandinavian
4%Scottish
Year of entry for the foreign-born population
02010 or later
12000 to 2009
11990 to 1999
0Before 1990
Housing units lacking complete plumbing facilities: 1.9% Housing units lacking complete kitchen facilities: 2.3%
50.1%Bottled, tank, or LP gas
19.3%Electricity
18.7%Wood
4.8%Other fuel
4.2%Fuel oil, kerosene, etc.
2.4%Utility gas
1.2%Coal or coke
0.6%No fuel used
Population in 1990: 1,893.
Place of birth for U.S.-born residents:
This state: 317
Northeast: 2
Midwest: 25
South: 12
West: 87
65% of the 84069 zip code residents lived in the same house 5 years ago. Out of people who lived in different houses, 47% lived in this county. Out of people who lived in different counties, 50% lived in Utah.
95% of the 84069 zip code residents lived in the same house 1 year ago. Out of people who lived in different houses, 47% moved from this county. Out of people who lived in different houses, 27% moved from different county within same state. Out of people who lived in different houses, 27% moved from different state.
Private vs. public school enrollment:
Students in private schools in grades 1 to 8 (elementary and middle school): 10
Here:
15.6%
Utah:
7.2%
Students in private schools in grades 9 to 12 (high school):
Here:
0.0%
Utah:
5.3%
Students in private undergraduate colleges:
Here:
0.0%
Utah:
26.7%
Occupation by median earnings in the past 12 months ($)
125,653Management occupations
80,952Construction and extraction occupations
78,852Installation, maintenance, and repair occupations
68,683Building and grounds cleaning and maintenance occupations
62,113Fire fighting and prevention, and other protective service workers including supervisors
60,764Business and financial operations occupations
Top industries in this zip code by the number of employees in 2005:
Arts, Entertainment, and Recreation: Other Spectator Sports (1-4 employees: 1 establishment)
Home Mortgage Disclosure Act Aggregated Statistics For Year 2009 (Based on 2 partial tracts)
A) FHA, FSA/RHS & VA Home Purchase Loans
B) Conventional Home Purchase Loans
C) Refinancings
D) Home Improvement Loans
F) Non-occupant Loans on < 5 Family Dwellings (A B C & D)
G) Loans On Manufactured Home Dwelling (A B C & D)
Number
Average Value
Number
Average Value
Number
Average Value
Number
Average Value
Number
Average Value
Number
Average Value
LOANS ORIGINATED
22
$209,875
9
$219,996
122
$194,245
2
$54,720
3
$138,910
2
$138,140
APPLICATIONS APPROVED, NOT ACCEPTED
2
$193,205
1
$405,670
13
$213,182
0
$0
0
$0
0
$0
APPLICATIONS DENIED
3
$178,877
3
$204,240
28
$237,972
2
$124,840
2
$152,130
0
$0
APPLICATIONS WITHDRAWN
3
$194,197
2
$208,655
23
$209,993
1
$118,040
0
$0
1
$113,450
FILES CLOSED FOR INCOMPLETENESS
0
$0
0
$0
3
$259,987
0
$0
0
$0
0
$0
Aggregated Statistics For Year 2008 (Based on 2 partial tracts)
A) FHA, FSA/RHS & VA Home Purchase Loans
B) Conventional Home Purchase Loans
C) Refinancings
D) Home Improvement Loans
F) Non-occupant Loans on < 5 Family Dwellings (A B C & D)
G) Loans On Manufactured Home Dwelling (A B C & D)
Number
Average Value
Number
Average Value
Number
Average Value
Number
Average Value
Number
Average Value
Number
Average Value
LOANS ORIGINATED
18
$210,688
17
$200,237
77
$195,458
5
$84,324
4
$211,298
2
$115,160
APPLICATIONS APPROVED, NOT ACCEPTED
1
$266,700
2
$301,420
11
$220,032
0
$0
1
$346,410
0
$0
APPLICATIONS DENIED
4
$220,808
4
$220,515
33
$229,762
7
$126,511
4
$208,925
1
$176,820
APPLICATIONS WITHDRAWN
4
$238,240
3
$218,387
17
$203,366
1
$156,680
0
$0
0
$0
FILES CLOSED FOR INCOMPLETENESS
0
$0
0
$0
3
$173,627
0
$0
0
$0
0
$0
Aggregated Statistics For Year 2007 (Based on 2 partial tracts)
A) FHA, FSA/RHS & VA Home Purchase Loans
B) Conventional Home Purchase Loans
C) Refinancings
D) Home Improvement Loans
F) Non-occupant Loans on < 5 Family Dwellings (A B C & D)
G) Loans On Manufactured Home Dwelling (A B C & D)
Number
Average Value
Number
Average Value
Number
Average Value
Number
Average Value
Number
Average Value
Number
Average Value
LOANS ORIGINATED
9
$208,868
66
$173,705
84
$173,962
10
$93,771
10
$163,287
2
$107,775
APPLICATIONS APPROVED, NOT ACCEPTED
0
$0
9
$180,528
13
$175,859
2
$97,460
1
$211,050
0
$0
APPLICATIONS DENIED
1
$265,530
13
$191,138
41
$183,728
11
$107,651
6
$181,663
2
$104,795
APPLICATIONS WITHDRAWN
1
$110,810
8
$148,411
18
$202,794
3
$121,663
1
$212,810
0
$0
FILES CLOSED FOR INCOMPLETENESS
0
$0
1
$179,460
5
$184,432
0
$0
1
$188,360
0
$0
Aggregated Statistics For Year 2006 (Based on 2 partial tracts)
A) FHA, FSA/RHS & VA Home Purchase Loans
B) Conventional Home Purchase Loans
C) Refinancings
D) Home Improvement Loans
F) Non-occupant Loans on < 5 Family Dwellings (A B C & D)
G) Loans On Manufactured Home Dwelling (A B C & D)
Number
Average Value
Number
Average Value
Number
Average Value
Number
Average Value
Number
Average Value
Number
Average Value
LOANS ORIGINATED
11
$170,065
87
$130,994
72
$138,617
8
$73,020
17
$116,727
2
$142,350
APPLICATIONS APPROVED, NOT ACCEPTED
0
$0
11
$142,236
14
$141,496
1
$128,610
3
$152,860
0
$0
APPLICATIONS DENIED
1
$223,670
18
$137,366
35
$136,526
8
$62,212
4
$133,155
2
$107,775
APPLICATIONS WITHDRAWN
1
$156,580
8
$111,712
21
$132,286
1
$91,740
2
$123,130
0
$0
FILES CLOSED FOR INCOMPLETENESS
0
$0
2
$154,230
4
$171,760
0
$0
0
$0
0
$0
Aggregated Statistics For Year 2005 (Based on 2 partial tracts)
A) FHA, FSA/RHS & VA Home Purchase Loans
B) Conventional Home Purchase Loans
C) Refinancings
D) Home Improvement Loans
F) Non-occupant Loans on < 5 Family Dwellings (A B C & D)
G) Loans On Manufactured Home Dwelling (A B C & D)
Number
Average Value
Number
Average Value
Number
Average Value
Number
Average Value
Number
Average Value
Number
Average Value
LOANS ORIGINATED
12
$152,372
87
$112,047
51
$120,904
5
$84,440
18
$102,956
2
$79,220
APPLICATIONS APPROVED, NOT ACCEPTED
0
$0
10
$116,695
12
$128,852
1
$13,590
2
$98,385
1
$54,280
APPLICATIONS DENIED
1
$207,920
18
$103,874
44
$124,973
6
$54,377
4
$86,358
2
$89,975
APPLICATIONS WITHDRAWN
1
$157,750
17
$115,968
20
$144,167
2
$186,555
4
$119,830
0
$0
FILES CLOSED FOR INCOMPLETENESS
0
$0
1
$141,710
6
$157,718
0
$0
0
$0
0
$0
Aggregated Statistics For Year 2004 (Based on 2 partial tracts)
A) FHA, FSA/RHS & VA Home Purchase Loans
B) Conventional Home Purchase Loans
C) Refinancings
D) Home Improvement Loans
F) Non-occupant Loans on < 5 Family Dwellings (A B C & D)
G) Loans On Manufactured Home Dwelling (A B C & D)
Detailed PMIC statistics for the following Tracts:1307.00
2002 - 2018 National Fire Incident Reporting System (NFIRS) incidents
According to the data from the years 2002 - 2018 the average number of fires per year is 6. The highest number of reported fire incidents - 15 took place in 2006, and the least - 0 in 2003. The data has a declining trend.
When looking into fire subcategories, the most reports belonged to: Outside Fires (53.5%), and Structure Fires (29.7%).
Fire incident types reported to NFIRS in Zip Code 84069


 Nearest zip codes: 84022, 84071, 84080, 84074, 84029, 84013.


 According to the data from the years 2002 - 2018 the average number of fires per year is 6. The highest number of reported fire incidents - 15 took place in 2006, and the least - 0 in 2003. The data has a declining trend.
 When looking into fire subcategories, the most reports belonged to: Outside Fires (53.5%), and Structure Fires (29.7%).