Estimated zip code population in 2022: 928 Zip code population in 2010: 615 Zip code population in 2000: 489
Houses and condos: 438 Renter-occupied apartments: 11
% of renters here:
3%
State:
29%
March 2022 cost of living index in zip code 84722: 83.7 (less than average, U.S. average is 100)
Land area: 13.9 sq. mi. Water area: 0.1 sq. mi.
Population density: 67 people per square mile
(very low).
OSM Map
General Map
Google Map
MSN Map
OSM Map
General Map
Google Map
MSN Map
OSM Map
General Map
Google Map
MSN Map
OSM Map
General Map
Google Map
MSN Map
Please wait while loading the map...
Real estate property taxes paid for housing units in 2022:
This zip code:
0.3% ($1,404)
Utah:
0.5% ($2,376)
Median real estate property taxes paid for housing units with mortgages in 2022: $1,258 (0.3%) Median real estate property taxes paid for housing units with no mortgage in 2022: $1,482 (0.3%)
Business Search- 14 Million verified businesses
Males: 533
(57.5%)
Females: 394
(42.5%)
For population 25 years and over in 84722:
High school or higher: 88.5%
Bachelor's degree or higher: 35.1%
Graduate or professional degree: 9.4%
Unemployed: 7.4%
Mean travel time to work (commute): 33.2 minutes
For population 15 years and over in 84722:
Never married: 13.6%
Now married: 77.1%
Separated: 4.1%
Widowed: 1.5%
Divorced: 3.8%
Zip code 84722 compared to state average:
Unemployed percentage above state average.
Black race population percentage significantly below state average.
Hispanic race population percentage significantly below state average.
Median age significantly above state average.
Foreign-born population percentage significantly below state average.
Renting percentage significantly below state average.
Length of stay since moving in below state average.
House age below state average.
Number of college students significantly below state average.
Estimated median house/condo value in 2022: $409,994
84722:
$409,994
Utah:
$499,500
According to our research of Utah and other state lists, there was 1 registered sex offender living in 84722 zip code as of June 07, 2024. The ratio of all residents to sex offenders in zip code 84722 is 774 to 1. The ratio of registered sex offenders to all residents in this zip code is lower than the state average.
Median resident age:
This zip code:
50.5 years
Utah median age:
32.1 years
Average household size:
This zip code:
2.5 people
Utah:
3.0 people
Averages for the 2020 tax year for zip code 84722, filed in 2021:
Average Adjusted Gross Income (AGI) in 2020: $47,816 (Individual Income Tax Returns)
Here:
$47,816
State:
$81,660
Salary/wage: $41,583 (reported on 77.4% of returns)
Here:
$41,583
State:
$63,027
(% of AGI for various income ranges: 1240.0% for AGIs below $25k, 4118.3% for AGIs $25k-50k, 7123.3% for AGIs $50k-75k, 6556.7% for AGIs $75k-100k)
Taxable interest for individuals: $429 (reported on 22.6% of returns)
This zip code:
$429
Utah:
$2,255
(% of AGI for various income ranges: 38.3% for AGIs $25k-50k, 23.3% for AGIs $75k-100k)
Ordinary dividends: $1,450 (reported on 6.5% of returns)
Here:
$1,450
State:
$7,362
(% of AGI for various income ranges: 41.4% for AGIs below $25k)
Net capital gain/loss in AGI: +$6,550 (reported on 6.5% of returns)
Here:
+$6,550
State:
+$43,433
(% of AGI for various income ranges: 218.3% for AGIs $25k-50k)
Profit/loss from business: +$6,320 (reported on 16.1% of returns)
Here:
+$6,320
State:
+$9,957
(% of AGI for various income ranges: 142.9% for AGIs below $25k, 360.0% for AGIs $25k-50k)
Taxable individual retirement arrangement distribution: $10,550 (reported on 6.5% of returns)
84722:
$10,550
Utah:
$21,167
(% of AGI for various income ranges: 301.4% for AGIs below $25k)
Earned income credit: $1,467 (reported on 19.4% of returns)
Here:
$1,467
State:
$2,169
(% of AGI for various income ranges: 62.9% for AGIs below $25k, 73.3% for AGIs $25k-50k)
Percentage of individuals using paid preparers for their 2020 taxes: 93.5%
Here:
94%
State:
94%
(% for various income ranges: 81.8% for AGIs below $25k, 100.0% for AGIs $25k-50k, 100.0% for AGIs $50k-75k, 100.0% for AGIs $75k-100k, 100.0% for AGIs $100k-200k)
Averages for the 2012 tax year for zip code 84722, filed in 2013:
Average Adjusted Gross Income (AGI) in 2012: $38,519 (Individual Income Tax Returns)
Here:
$38,519
State:
$60,327
Salary/wage: $34,693 (reported on 66.7% of returns)
Here:
$34,693
State:
$48,762
(% of AGI for various income ranges: 50.7% for AGIs below $25k, 62.1% for AGIs $25k-50k, 111.7% for AGIs $50k-75k)
Taxable interest for individuals: $700 (reported on 33.3% of returns)
This zip code:
$700
Utah:
$1,534
Ordinary dividends: $1,550 (reported on 9.5% of returns)
Here:
$1,550
State:
$5,711
Profit/loss from business: +$6,700 (reported on 19.0% of returns)
Here:
+$6,700
State:
+$8,845
Taxable individual retirement arrangement distribution: $8,400 (reported on 14.3% of returns)
84722:
$8,400
Utah:
$15,565
Total itemized deductions: $19,186 (32% of AGI, reported on 33.3% of returns)
Here:
$19,186
State:
$25,197
Here:
32.0% of AGI
State:
22.4% of AGI
Charity contributions: $3,550 (reported on 28.6% of returns)
Here:
$3,550
State:
$8,502
Taxes paid: $3,571 (reported on 33.3% of returns)
84722:
$3,571
State:
$7,001
Earned income credit: $2,125 (reported on 19.0% of returns)
Here:
$2,125
State:
$2,259
(% of AGI for various income ranges: 7.9% for AGIs below $25k)
Percentage of individuals using paid preparers for their 2012 taxes: 52.4%
Here:
52%
State:
51%
(% for various income ranges: 44.4% for AGIs below $25k, 50.0% for AGIs $25k-50k, 100.0% for AGIs $50k-75k)
Averages for the 2004 tax year for zip code 84722, filed in 2005:
Average Adjusted Gross Income (AGI) in 2004: $33,068 (Individual Income Tax Returns)
Here:
$33,068
State:
$45,498
Salary/wage: $29,512 (reported on 75.5% of returns)
Here:
$29,512
State:
$38,975
(% of AGI for various income ranges: 77.2% for AGIs below $10k, 65.1% for AGIs $10k-25k, 71.4% for AGIs $25k-50k, 71.1% for AGIs $50k-75k, 58.5% for AGIs $75k-100k)
Taxable interest for individuals: $379 (reported on 43.2% of returns)
This zip code:
$379
Utah:
$1,445
(% of AGI for various income ranges: 1.6% for AGIs below $10k, 1.1% for AGIs $10k-25k, 0.4% for AGIs $25k-50k, 0.6% for AGIs $50k-75k)
Taxable dividends: $240 (reported on 11.4% of returns)
Here:
$240
State:
$3,152
Profit/loss from business: +$5,103 (reported on 17.7% of returns)
Here:
+$5,103
State:
+$6,903
Total itemized deductions: $15,516 (33% of AGI, reported on 43.2% of returns)
Here:
$15,516
State:
$20,312
Here:
33.0% of AGI
State:
24.9% of AGI
(% of AGI for various income ranges: 18.2% for AGIs $10k-25k, 21.8% for AGIs $25k-50k, 18.4% for AGIs $50k-75k, 22.8% for AGIs $75k-100k)
Charity contributions deductions: $2,290 (5% of AGI, reported on 31.4% of returns)
Here:
$2,290
State:
$6,250
Here:
4.7% of AGI
State:
7.4% of AGI
(% of AGI for various income ranges: 6.3% for AGIs below $10k, 2.8% for AGIs $25k-50k, 1.3% for AGIs $50k-75k, 3.5% for AGIs $75k-100k)
Total tax: $3,096 (reported on 70.9% of returns)
84722:
$3,096
State:
$6,523
(% of AGI for various income ranges: 3.1% for AGIs $10k-25k, 6.4% for AGIs $25k-50k, 8.4% for AGIs $50k-75k, 8.7% for AGIs $75k-100k)
Earned income credit: $1,778 (reported on 16.4% of returns)
Here:
$1,778
State:
$1,703
Percentage of individuals using paid preparers for their 2004 taxes: 66.4%
Here:
66%
State:
53%
(% for various income ranges: 64.5% for AGIs below $10k, 68.9% for AGIs $10k-25k, 62.5% for AGIs $25k-50k, 73.1% for AGIs $50k-75k, 64.7% for AGIs $75k-100k)
Household received Food Stamps/SNAP in the past 12 months: 0 Household did not receive Food Stamps/SNAP in the past 12 months: 369
Women who had a birth in the past 12 months: 10 (0 now married, 9 unmarried) Women who did not have a birth in the past 12 months: 136 (98 now married, 36 unmarried)
Housing units in zip code 84722 with a mortgage: 176 Median monthly owner costs for units with a mortgage: $1,208 Median monthly owner costs for units without a mortgage: $413
Residents with income below the poverty level in 2022:
This zip code:
4.4%
Whole state:
8.2%
Residents with income below 50% of the poverty level in 2022:
This zip code:
1.5%
Whole state:
4.3%
Median number of rooms in houses and condos:
Here:
5.7
State:
7.6
Notable locations in this zip code not listed on our city pages
Size of family households: 242 2-persons, 30 3-persons, 22 4-persons, 29 6-persons
Size of nonfamily households: 42 1-person
106 married couples with children.
93 single-parent households (93 men).
96.5% of residents of 84722 zip code speak English at home.
1.0% of residents speak Spanish at home (100% very well).
2.7% of residents speak other Indo-European language at home (100% very well).
Foreign born population: 0 (0.0%)
:
0.0%
Whole state:
8.6%
59%English
16%German
7%Irish
7%Northern European
6%Dutch
2%Scotch-Irish
1%European
Year of entry for the foreign-born population
122010 or later
02000 to 2009
01990 to 1999
0Before 1990
Housing units lacking complete plumbing facilities: 1.6% Housing units lacking complete kitchen facilities: 2.0%
83.0%Utility gas
9.6%Electricity
3.5%Bottled, tank, or LP gas
2.6%Fuel oil, kerosene, etc.
2.0%Wood
Population in 1990: 1,127.
Place of birth for U.S.-born residents:
This state: 288
Northeast: 21
Midwest: 205
South: 51
West: 361
49% of the 84722 zip code residents lived in the same house 5 years ago. Out of people who lived in different houses, 56% lived in this county. Out of people who lived in different counties, 50% lived in Utah.
93% of the 84722 zip code residents lived in the same house 1 year ago. Out of people who lived in different houses, 100% moved from different state.
Private vs. public school enrollment:
Students in private schools in grades 1 to 8 (elementary and middle school):
Here:
0.0%
Utah:
7.2%
Students in private schools in grades 9 to 12 (high school):
Here:
0.0%
Utah:
5.3%
Students in private undergraduate colleges:
Here:
0.0%
Utah:
26.7%
Occupation by median earnings in the past 12 months ($)
116,134Management occupations
36,947Sales and related occupations
20,932Education, training, and library occupations
Top industries in this zip code by the number of employees in 2005:
Construction: All Other Specialty Trade Contractors (20-49 employees: 1 establishment)
Construction: Water and Sewer Line and Related Structures Construction (10-19: 1)
Accommodation and Food Services: Full-Service Restaurants (5-9: 1, 1-4: 1)
Administrative and Support and Waste Management and Remediation Services: Landscaping Services (1-4: 1)
Construction: New Single-Family Housing Construction (except Operative Builders) (1-4: 1)
Fatal accident statistics in 2013:
Fatal accident count: 1
Vehicles involved in fatal accidents: 2
Fatal accidents caused by drunken drivers: 1
Fatalities: 1
Persons involved in fatal accidents: 2
Pedestrians involved in fatal accidents: 0
Fatal accident statistics in 2010:
Fatal accident count: 1
Vehicles involved in fatal accidents: 1
Fatal accidents caused by drunken drivers: 0
Fatalities: 1
Persons involved in fatal accidents: 1
Pedestrians involved in fatal accidents: 0
Home Mortgage Disclosure Act Aggregated Statistics For Year 2009 (Based on 2 partial tracts)
A) FHA, FSA/RHS & VA Home Purchase Loans
B) Conventional Home Purchase Loans
C) Refinancings
D) Home Improvement Loans
E) Loans on Dwellings For 5+ Families
F) Non-occupant Loans on < 5 Family Dwellings (A B C & D)
G) Loans On Manufactured Home Dwelling (A B C & D)
Number
Average Value
Number
Average Value
Number
Average Value
Number
Average Value
Number
Average Value
Number
Average Value
Number
Average Value
LOANS ORIGINATED
6
$142,877
8
$164,179
63
$145,208
2
$59,390
0
$0
13
$151,881
3
$147,083
APPLICATIONS APPROVED, NOT ACCEPTED
0
$0
2
$124,515
9
$152,822
0
$0
0
$0
3
$102,900
1
$154,930
APPLICATIONS DENIED
1
$129,100
2
$294,070
23
$308,804
0
$0
1
$2,295,200
5
$710,938
1
$105,580
APPLICATIONS WITHDRAWN
2
$149,760
1
$440,100
11
$158,265
0
$0
0
$0
3
$201,213
2
$104,145
FILES CLOSED FOR INCOMPLETENESS
1
$103,860
0
$0
1
$169,270
0
$0
0
$0
0
$0
0
$0
Aggregated Statistics For Year 2008 (Based on 2 partial tracts)
A) FHA, FSA/RHS & VA Home Purchase Loans
B) Conventional Home Purchase Loans
C) Refinancings
D) Home Improvement Loans
E) Loans on Dwellings For 5+ Families
F) Non-occupant Loans on < 5 Family Dwellings (A B C & D)
G) Loans On Manufactured Home Dwelling (A B C & D)
Number
Average Value
Number
Average Value
Number
Average Value
Number
Average Value
Number
Average Value
Number
Average Value
Number
Average Value
LOANS ORIGINATED
5
$143,680
14
$185,337
42
$169,654
5
$59,560
1
$309,850
13
$199,726
5
$105,694
APPLICATIONS APPROVED, NOT ACCEPTED
1
$84,350
3
$238,700
10
$156,705
0
$0
0
$0
3
$135,607
1
$84,350
APPLICATIONS DENIED
1
$148,610
4
$300,670
29
$194,518
1
$31,560
1
$312,720
7
$200,911
4
$144,310
APPLICATIONS WITHDRAWN
1
$134,840
0
$0
9
$166,402
1
$4,590
0
$0
1
$215,170
1
$59,100
FILES CLOSED FOR INCOMPLETENESS
0
$0
0
$0
1
$86,070
0
$0
0
$0
0
$0
0
$0
Aggregated Statistics For Year 2007 (Based on 2 partial tracts)
A) FHA, FSA/RHS & VA Home Purchase Loans
B) Conventional Home Purchase Loans
C) Refinancings
D) Home Improvement Loans
E) Loans on Dwellings For 5+ Families
F) Non-occupant Loans on < 5 Family Dwellings (A B C & D)
G) Loans On Manufactured Home Dwelling (A B C & D)
Number
Average Value
Number
Average Value
Number
Average Value
Number
Average Value
Number
Average Value
Number
Average Value
Number
Average Value
LOANS ORIGINATED
3
$177,687
32
$192,187
59
$188,518
7
$100,414
1
$219,770
22
$187,633
7
$152,467
APPLICATIONS APPROVED, NOT ACCEPTED
1
$75,170
6
$194,232
13
$155,632
1
$16,070
0
$0
2
$140,005
1
$75,170
APPLICATIONS DENIED
2
$137,425
13
$236,671
28
$178,677
3
$111,890
0
$0
6
$227,033
2
$117,055
APPLICATIONS WITHDRAWN
1
$111,320
4
$130,252
14
$203,535
1
$68,860
0
$0
2
$108,735
1
$90,090
FILES CLOSED FOR INCOMPLETENESS
0
$0
1
$175,580
6
$155,787
0
$0
0
$0
0
$0
0
$0
Aggregated Statistics For Year 2006 (Based on 2 partial tracts)
A) FHA, FSA/RHS & VA Home Purchase Loans
B) Conventional Home Purchase Loans
C) Refinancings
D) Home Improvement Loans
F) Non-occupant Loans on < 5 Family Dwellings (A B C & D)
G) Loans On Manufactured Home Dwelling (A B C & D)
Number
Average Value
Number
Average Value
Number
Average Value
Number
Average Value
Number
Average Value
Number
Average Value
LOANS ORIGINATED
5
$144,138
43
$153,632
75
$156,135
11
$136,825
28
$150,786
8
$107,588
APPLICATIONS APPROVED, NOT ACCEPTED
0
$0
6
$92,477
17
$140,952
2
$151,485
4
$108,878
2
$96,970
APPLICATIONS DENIED
0
$0
15
$146,395
32
$167,747
4
$66,418
10
$217,528
3
$115,527
APPLICATIONS WITHDRAWN
0
$0
9
$146,574
14
$225,421
1
$6,310
2
$232,675
2
$165,540
FILES CLOSED FOR INCOMPLETENESS
0
$0
2
$77,750
6
$216,035
0
$0
0
$0
0
$0
Aggregated Statistics For Year 2005 (Based on 2 partial tracts)
A) FHA, FSA/RHS & VA Home Purchase Loans
B) Conventional Home Purchase Loans
C) Refinancings
D) Home Improvement Loans
F) Non-occupant Loans on < 5 Family Dwellings (A B C & D)
G) Loans On Manufactured Home Dwelling (A B C & D)
Number
Average Value
Number
Average Value
Number
Average Value
Number
Average Value
Number
Average Value
Number
Average Value
LOANS ORIGINATED
3
$119,923
64
$122,596
49
$139,223
8
$94,534
22
$142,589
9
$92,318
APPLICATIONS APPROVED, NOT ACCEPTED
1
$35,580
13
$124,558
15
$100,530
1
$98,690
2
$212,020
0
$0
APPLICATIONS DENIED
1
$45,330
22
$109,857
32
$114,886
3
$58,527
8
$121,144
4
$105,150
APPLICATIONS WITHDRAWN
2
$91,520
13
$129,635
19
$130,253
1
$148,040
3
$117,630
3
$90,470
FILES CLOSED FOR INCOMPLETENESS
1
$66,560
4
$120,642
5
$102,596
0
$0
1
$117,630
0
$0
Aggregated Statistics For Year 2004 (Based on 2 partial tracts)
A) FHA, FSA/RHS & VA Home Purchase Loans
B) Conventional Home Purchase Loans
C) Refinancings
D) Home Improvement Loans
F) Non-occupant Loans on < 5 Family Dwellings (A B C & D)
G) Loans On Manufactured Home Dwelling (A B C & D)

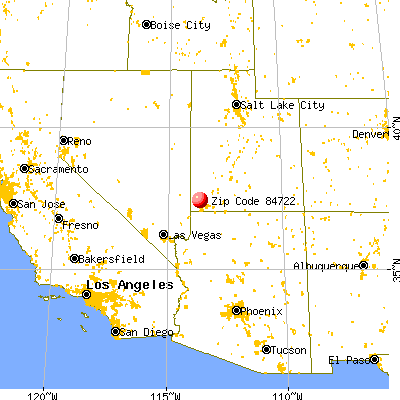


 Nearest zip codes: 84756, 84782, 84781, 84725, 84783, 84733.


