Estimated zip code population in 2022: 1,612 Zip code population in 2010: 1,964 Zip code population in 2000: 1,472
Houses and condos: 596 Renter-occupied apartments: 64
% of renters here:
12%
State:
29%
March 2022 cost of living index in zip code 84725: 85.6 (less than average, U.S. average is 100)
Land area: 168.0 sq. mi. Water area: 0.7 sq. mi.
Population density: 10 people per square mile
(very low).
OSM Map
General Map
Google Map
MSN Map
OSM Map
General Map
Google Map
MSN Map
OSM Map
General Map
Google Map
MSN Map
OSM Map
General Map
Google Map
MSN Map
Please wait while loading the map...
Real estate property taxes paid for housing units in 2022:
This zip code:
0.5% ($1,504)
Utah:
0.5% ($2,376)
Median real estate property taxes paid for housing units with mortgages in 2022: $1,534 (0.5%) Median real estate property taxes paid for housing units with no mortgage in 2022: $1,474 (0.4%)
Business Search- 14 Million verified businesses
Males: 789
(49.0%)
Females: 822
(51.0%)
For population 25 years and over in 84725:
High school or higher: 94.6%
Bachelor's degree or higher: 27.1%
Graduate or professional degree: 9.4%
Unemployed: 2.5%
Mean travel time to work (commute): 34.0 minutes
For population 15 years and over in 84725:
Never married: 20.5%
Now married: 65.6%
Separated: 0.8%
Widowed: 5.5%
Divorced: 7.6%
Zip code 84725 compared to state average:
Black race population percentage significantly below state average.
Hispanic race population percentage significantly below state average.
Foreign-born population percentage significantly below state average.
Renting percentage significantly below state average.
Length of stay since moving in significantly above state average.
Estimated median house/condo value in 2022: $333,693
84725:
$333,693
Utah:
$499,500
According to our research of Utah and other state lists, there were 3 registered sex offenders living in 84725 zip code as of May 28, 2024. The ratio of all residents to sex offenders in zip code 84725 is 595 to 1. The ratio of registered sex offenders to all residents in this zip code is lower than the state average.
Median resident age:
This zip code:
35.6 years
Utah median age:
32.1 years
Average household size:
This zip code:
3.0 people
Utah:
3.0 people
Averages for the 2004 tax year for zip code 84725, filed in 2005:
Average Adjusted Gross Income (AGI) in 2004: $34,362 (Individual Income Tax Returns)
Here:
$34,362
State:
$45,498
Salary/wage: $31,767 (reported on 83.9% of returns)
Here:
$31,767
State:
$38,975
(% of AGI for various income ranges: 224.5% for AGIs below $10k, 72.6% for AGIs $10k-25k, 80.5% for AGIs $25k-50k, 83.8% for AGIs $50k-75k, 84.9% for AGIs $75k-100k, 42.9% for AGIs over 100k)
Taxable interest for individuals: $1,311 (reported on 38.8% of returns)
This zip code:
$1,311
Utah:
$1,445
(% of AGI for various income ranges: 6.5% for AGIs below $10k, 3.1% for AGIs $10k-25k, 1.2% for AGIs $25k-50k, 1.1% for AGIs $50k-75k, 0.3% for AGIs $75k-100k, 2.1% for AGIs over 100k)
Taxable dividends: $476 (reported on 11.2% of returns)
Here:
$476
State:
$3,152
(% of AGI for various income ranges: 2.3% for AGIs below $10k, 0.2% for AGIs $25k-50k, 0.1% for AGIs $50k-75k, 0.2% for AGIs $75k-100k)
Net capital gain/loss: +$5,667 (reported on 13.8% of returns)
Here:
+$5,667
State:
+$14,059
(% of AGI for various income ranges: 1.8% for AGIs $10k-25k, 1.6% for AGIs $25k-50k, 0.1% for AGIs $50k-75k, 0.1% for AGIs $75k-100k, 10.8% for AGIs over 100k)
Profit/loss from business: +$4,817 (reported on 20.4% of returns)
Here:
+$4,817
State:
+$6,903
(% of AGI for various income ranges: 5.4% for AGIs below $10k, 5.9% for AGIs $10k-25k, 6.0% for AGIs $25k-50k, 1.0% for AGIs $50k-75k)
Profit/loss from farming: +$2,636 (reported on 3.9% of returns)
Here:
+$2,636
State:
-$6,601
Total itemized deductions: $16,512 (28% of AGI, reported on 36.3% of returns)
Here:
$16,512
State:
$20,312
Here:
28.5% of AGI
State:
24.9% of AGI
(% of AGI for various income ranges: 12.4% for AGIs $10k-25k, 17.9% for AGIs $25k-50k, 20.1% for AGIs $50k-75k, 23.3% for AGIs $75k-100k, 12.1% for AGIs over 100k)
Charity contributions deductions: $6,021 (10% of AGI, reported on 34.6% of returns)
Here:
$6,021
State:
$6,250
Here:
10.4% of AGI
State:
7.4% of AGI
(% of AGI for various income ranges: 3.6% for AGIs $10k-25k, 5.9% for AGIs $25k-50k, 7.4% for AGIs $50k-75k, 7.3% for AGIs $75k-100k, 5.2% for AGIs over 100k)
Total tax: $3,405 (reported on 68.8% of returns)
84725:
$3,405
State:
$6,523
(% of AGI for various income ranges: 7.7% for AGIs below $10k, 3.9% for AGIs $10k-25k, 4.1% for AGIs $25k-50k, 5.6% for AGIs $50k-75k, 8.1% for AGIs $75k-100k, 15.8% for AGIs over 100k)
Earned income credit: $1,873 (reported on 14.0% of returns)
Here:
$1,873
State:
$1,703
Percentage of individuals using paid preparers for their 2004 taxes: 56.6%
Here:
57%
State:
53%
(% for various income ranges: 49.6% for AGIs below $10k, 62.1% for AGIs $10k-25k, 55.9% for AGIs $25k-50k, 57.8% for AGIs $50k-75k, 48.4% for AGIs $75k-100k, 76.5% for AGIs over 100k)
Household received Food Stamps/SNAP in the past 12 months: 19 Household did not receive Food Stamps/SNAP in the past 12 months: 526
Women who had a birth in the past 12 months: 9 (9 now married, 0 unmarried) Women who did not have a birth in the past 12 months: 336 (228 now married, 105 unmarried)
Housing units in zip code 84725 with a mortgage: 260 Houses without a mortgage: 4
Median monthly owner costs for units with a mortgage: $1,215 Median monthly owner costs for units without a mortgage: $418
Residents with income below the poverty level in 2022:
This zip code:
3.1%
Whole state:
8.2%
Residents with income below 50% of the poverty level in 2022:
This zip code:
2.5%
Whole state:
4.3%
Median number of rooms in houses and condos:
Here:
7.0
State:
7.6
Median number of rooms in apartments:
Here:
5.3
State:
4.3
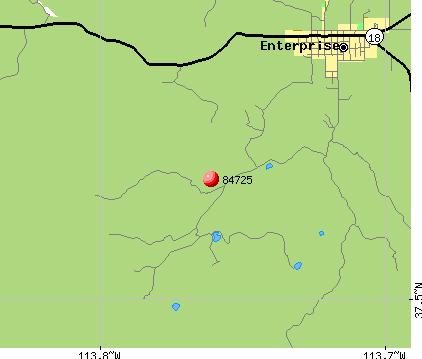
Notable locations in this zip code not listed on our city pages
Notable locations in zip code 84725: Enterprise Reservoir Campground (A), Hebron Historical Site (B), Jefferson Hunt Monument (C), Enterprise Work Center (D), Hebron (E), Honeycomb Rock Campground (F), Holt Historical Site (G), Hamblin Historical Site (H), Big Mountain Electronic Site (I), Enterprise Administrative Site (J), Enterprise Volunteer Fire Department (K). Display/hide their locations on the map
Cemeteries: Holt Cemetery (1), Hamblin Cemetery (2), Hebron Cemetery (3), Winsor Memorial Cemetery (4), Enterprise City Cemetery (5). Display/hide their locations on the map
Lakes and reservoirs: Ox Valley Lake (A), Red Pond (B), Gary and Joyce Holt Reservoir (C), Lower Enterprise Reservoir (D), Upper Enterprise Reservoir (E). Display/hide their locations on the map
Creeks: Lost Creek (A), Little Pine Creek (B), Cow Creek (C), Rattlesnake Creek (D), Grassy Creek (E), Meadow Valley Creek (F), Shinbone Creek (G), Cave Creek (H), Calf Springs Creek (I). Display/hide their locations on the map
Size of family households: 186 2-persons, 29 3-persons, 61 4-persons, 64 5-persons, 26 6-persons, 38 7-or-more-persons
Size of nonfamily households: 103 1-person, 17 2-persons, 17 3-persons
467 married couples with children.
20 single-parent households (20 women).
99.2% of residents of 84725 zip code speak English at home.
0.6% of residents speak Spanish at home (100% very well).
Foreign born population: 0 (0.0%)
:
0.0%
Whole state:
8.6%
39%English
18%American
7%German
7%Danish
7%European
4%Swiss
3%Swedish
Facilities with environmental interests located in this zip code:
ENTERPRISE ELEM SCH (216 S 100 E in ENTERPRISE, UT)
(National Center for Education Statistics) - STATE ID-33 104 Organizations: WASHINGTON SCHOOL DISTRICT (SCHOOL DISTRICT)
ENTERPRISE HIGH (186 S 100 E in ENTERPRISE, UT)
(National Center for Education Statistics) - STATE ID-33 712 Organizations: WASHINGTON SCHOOL DISTRICT (SCHOOL DISTRICT)
ENTERPRISE CITY WWTF (P.O. BOX 340 in ENTERPRISE, UT)
National Pollutant Discharge Elimination System NON-MAJOR (Tracking pollutant discharge elimination systems) - permit Business SIC classification: SEWERAGE SYSTEMS
CITY OF ENTERPRISE (115 EAST MAIN in ENTERPRISE, UT)
COMPLIANCE ACTIVITY (Tracking inspections of insecticide, fungicide, and rodenticide, and toxic substances)
HECLA MINING (NO STREET ADDRESS in ENTERPRISE, UT)
AIR SYNTHETIC MINOR (AIRS/AFS) Business SIC classification: SILVER ORES
58.4%Utility gas
31.8%Electricity
5.9%Wood
2.9%Bottled, tank, or LP gas
1.6%Fuel oil, kerosene, etc.
Place of birth for U.S.-born residents:
This state: 1,294
Northeast: 18
Midwest: 46
South: 22
West: 220
62% of the 84725 zip code residents lived in the same house 5 years ago. Out of people who lived in different houses, 61% lived in this county. Out of people who lived in different counties, 50% lived in Utah.
96% of the 84725 zip code residents lived in the same house 1 year ago. Out of people who lived in different houses, 26% moved from different county within same state. Out of people who lived in different houses, 57% moved from different state. Out of people who lived in different houses, 31% moved from abroad.
Private vs. public school enrollment:
Students in private schools in grades 1 to 8 (elementary and middle school):
Here:
0.0%
Utah:
7.2%
Students in private schools in grades 9 to 12 (high school): 4
Here:
3.4%
Utah:
5.3%
Students in private undergraduate colleges: 14
Here:
26.1%
Utah:
26.7%
Occupation by median earnings in the past 12 months ($)
76,018Management occupations
57,859Health diagnosing and treating practitioners and other technical occupations
55,590Construction and extraction occupations
51,255Education, training, and library occupations
28,518Office and administrative support occupations
14,368Sales and related occupations
Top industries in this zip code by the number of employees in 2005:
Health Care and Social Assistance: Offices of Physicians (except Mental Health Specialists) (10-19 employees: 1 establishment)
Accommodation and Food Services: Limited-Service Restaurants (10-19: 1)
Finance and Insurance: Commercial Banking (5-9: 1)
Construction: Drywall and Insulation Contractors (5-9: 1)
Health Care and Social Assistance: Home Health Care Services (5-9: 1)
Fatal accident statistics in 2011:
Fatal accident count: 1
Vehicles involved in fatal accidents: 2
Fatal accidents caused by drunken drivers: 0
Fatalities: 1
Persons involved in fatal accidents: 2
Pedestrians involved in fatal accidents: 0
Home Mortgage Disclosure Act Aggregated Statistics For Year 2009 (Based on 2 partial tracts)
A) FHA, FSA/RHS & VA Home Purchase Loans
B) Conventional Home Purchase Loans
C) Refinancings
D) Home Improvement Loans
E) Loans on Dwellings For 5+ Families
F) Non-occupant Loans on < 5 Family Dwellings (A B C & D)
G) Loans On Manufactured Home Dwelling (A B C & D)
Number
Average Value
Number
Average Value
Number
Average Value
Number
Average Value
Number
Average Value
Number
Average Value
Number
Average Value
LOANS ORIGINATED
8
$155,301
12
$158,628
91
$145,695
2
$86,070
0
$0
18
$158,974
4
$159,875
APPLICATIONS APPROVED, NOT ACCEPTED
0
$0
2
$180,455
12
$166,112
0
$0
0
$0
4
$111,850
2
$112,265
APPLICATIONS DENIED
2
$93,555
3
$284,130
33
$311,925
0
$0
1
$3,326,400
7
$735,966
1
$153,010
APPLICATIONS WITHDRAWN
2
$217,050
2
$318,920
16
$157,692
0
$0
0
$0
5
$174,968
2
$150,935
FILES CLOSED FOR INCOMPLETENESS
1
$150,520
0
$0
1
$245,320
0
$0
0
$0
0
$0
0
$0
Aggregated Statistics For Year 2008 (Based on 2 partial tracts)
A) FHA, FSA/RHS & VA Home Purchase Loans
B) Conventional Home Purchase Loans
C) Refinancings
D) Home Improvement Loans
E) Loans on Dwellings For 5+ Families
F) Non-occupant Loans on < 5 Family Dwellings (A B C & D)
G) Loans On Manufactured Home Dwelling (A B C & D)
Number
Average Value
Number
Average Value
Number
Average Value
Number
Average Value
Number
Average Value
Number
Average Value
Number
Average Value
LOANS ORIGINATED
7
$148,737
20
$188,025
62
$166,561
7
$61,657
1
$449,060
18
$209,055
7
$109,414
APPLICATIONS APPROVED, NOT ACCEPTED
1
$122,250
5
$207,568
14
$162,221
0
$0
0
$0
4
$147,400
1
$122,250
APPLICATIONS DENIED
2
$107,690
6
$290,505
42
$194,654
2
$22,870
1
$453,220
10
$203,825
6
$139,432
APPLICATIONS WITHDRAWN
2
$97,715
0
$0
12
$180,873
1
$6,650
0
$0
1
$311,850
1
$85,650
FILES CLOSED FOR INCOMPLETENESS
0
$0
0
$0
1
$124,740
0
$0
0
$0
0
$0
0
$0
Aggregated Statistics For Year 2007 (Based on 2 partial tracts)
A) FHA, FSA/RHS & VA Home Purchase Loans
B) Conventional Home Purchase Loans
C) Refinancings
D) Home Improvement Loans
E) Loans on Dwellings For 5+ Families
F) Non-occupant Loans on < 5 Family Dwellings (A B C & D)
G) Loans On Manufactured Home Dwelling (A B C & D)
Number
Average Value
Number
Average Value
Number
Average Value
Number
Average Value
Number
Average Value
Number
Average Value
Number
Average Value
LOANS ORIGINATED
5
$154,512
47
$189,640
85
$189,644
10
$101,871
1
$318,500
32
$186,954
10
$154,678
APPLICATIONS APPROVED, NOT ACCEPTED
1
$108,940
8
$211,122
18
$162,901
2
$11,640
0
$0
2
$202,910
1
$108,940
APPLICATIONS DENIED
2
$199,170
19
$234,686
40
$181,268
5
$97,298
0
$0
9
$219,358
3
$113,097
APPLICATIONS WITHDRAWN
1
$161,330
6
$125,848
20
$206,486
2
$49,895
0
$0
2
$157,590
2
$65,280
FILES CLOSED FOR INCOMPLETENESS
0
$0
2
$127,235
8
$169,335
0
$0
0
$0
0
$0
0
$0
Aggregated Statistics For Year 2006 (Based on 2 partial tracts)
A) FHA, FSA/RHS & VA Home Purchase Loans
B) Conventional Home Purchase Loans
C) Refinancings
D) Home Improvement Loans
F) Non-occupant Loans on < 5 Family Dwellings (A B C & D)
G) Loans On Manufactured Home Dwelling (A B C & D)
Number
Average Value
Number
Average Value
Number
Average Value
Number
Average Value
Number
Average Value
Number
Average Value
LOANS ORIGINATED
7
$149,213
62
$154,423
109
$155,700
17
$128,311
41
$149,242
12
$103,950
APPLICATIONS APPROVED, NOT ACCEPTED
0
$0
8
$100,520
25
$138,910
2
$219,540
6
$105,197
2
$140,540
APPLICATIONS DENIED
0
$0
22
$144,660
46
$169,122
6
$64,172
15
$210,173
5
$100,458
APPLICATIONS WITHDRAWN
0
$0
12
$159,321
21
$217,800
1
$9,150
2
$337,215
3
$159,943
FILES CLOSED FOR INCOMPLETENESS
0
$0
2
$112,680
9
$208,731
0
$0
0
$0
0
$0
Aggregated Statistics For Year 2005 (Based on 2 partial tracts)
A) FHA, FSA/RHS & VA Home Purchase Loans
B) Conventional Home Purchase Loans
C) Refinancings
D) Home Improvement Loans
F) Non-occupant Loans on < 5 Family Dwellings (A B C & D)
G) Loans On Manufactured Home Dwelling (A B C & D)
Number
Average Value
Number
Average Value
Number
Average Value
Number
Average Value
Number
Average Value
Number
Average Value
LOANS ORIGINATED
5
$104,282
92
$123,601
72
$137,318
12
$91,337
32
$142,074
12
$100,347
APPLICATIONS APPROVED, NOT ACCEPTED
1
$51,560
19
$123,515
22
$99,338
2
$71,520
3
$204,850
0
$0
APPLICATIONS DENIED
1
$65,700
32
$109,459
46
$115,827
5
$50,894
12
$117,047
6
$101,593
APPLICATIONS WITHDRAWN
2
$132,640
19
$128,548
27
$132,840
2
$107,275
4
$127,858
4
$98,338
FILES CLOSED FOR INCOMPLETENESS
1
$96,470
6
$116,563
7
$106,207
0
$0
1
$170,480
0
$0
Aggregated Statistics For Year 2004 (Based on 2 partial tracts)
A) FHA, FSA/RHS & VA Home Purchase Loans
B) Conventional Home Purchase Loans
C) Refinancings
D) Home Improvement Loans
F) Non-occupant Loans on < 5 Family Dwellings (A B C & D)
G) Loans On Manufactured Home Dwelling (A B C & D)


+$2,636
-$6,601
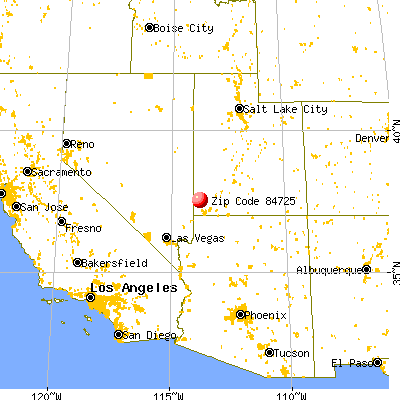
 Nearest zip codes: 84722, 84756, 84782, 84733, 84783, 84714.


