Estimated zip code population in 2022: 1,683 Zip code population in 2010: 1,289 Zip code population in 2000: 867
Houses and condos: 1,510 Renter-occupied apartments: 49
% of renters here:
5%
State:
33%
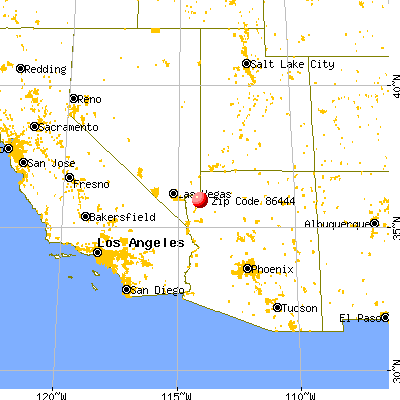
March 2022 cost of living index in zip code 86444: 82.8 (low, U.S. average is 100)
Land area: 505.7 sq. mi. Water area: 10.6 sq. mi.
Population density: 3 people per square mile
(very low).
OSM Map
General Map
Google Map
MSN Map
OSM Map
General Map
Google Map
MSN Map
OSM Map
General Map
Google Map
MSN Map
OSM Map
General Map
Google Map
MSN Map
Please wait while loading the map...
Real estate property taxes paid for housing units in 2022:
This zip code:
0.3% ($496)
Arizona:
0.4% ($1,786)
Median real estate property taxes paid for housing units with mortgages in 2022: $1,524 (0.5%) Median real estate property taxes paid for housing units with no mortgage in 2022: $433 (0.3%)
Business Search- 14 Million verified businesses
Males: 878
(52.2%)
Females: 805
(47.8%)
For population 25 years and over in 86444:
High school or higher: 83.8%
Bachelor's degree or higher: 7.1%
Graduate or professional degree: 3.1%
Unemployed: 49.0%
Mean travel time to work (commute): 105.1 minutes
For population 15 years and over in 86444:
Never married: 8.0%
Now married: 62.3%
Separated: 0.9%
Widowed: 17.6%
Divorced: 11.2%
Zip code 86444 compared to state average:
Median house value significantly below state average.
Unemployed percentage significantly above state average.
Black race population percentage significantly below state average.
Hispanic race population percentage significantly below state average.
Median age significantly above state average.
Foreign-born population percentage significantly below state average.
Renting percentage significantly below state average.
Length of stay since moving in significantly above state average.
Number of college students significantly below state average.
Percentage of population with a bachelor's degree or higher significantly below state average.
Estimated median house/condo value in 2022: $178,089
86444:
$178,089
Arizona:
$402,800
According to our research of Arizona and other state lists, there was 1 registered sex offender living in 86444 zip code as of May 28, 2024. The ratio of all residents to sex offenders in zip code 86444 is 875 to 1. The ratio of registered sex offenders to all residents in this zip code is lower than the state average.
Median resident age:
This zip code:
70.7 years
Arizona median age:
38.8 years
Average household size:
This zip code:
1.8 people
Arizona:
2.5 people
Averages for the 2020 tax year for zip code 86444, filed in 2021:
Average Adjusted Gross Income (AGI) in 2020: $45,372 (Individual Income Tax Returns)
Here:
$45,372
State:
$73,499
Salary/wage: $36,881 (reported on 42.0% of returns)
Here:
$36,881
State:
$59,499
(% of AGI for various income ranges: 497.5% for AGIs below $25k, 2238.6% for AGIs $25k-50k, 4214.0% for AGIs $50k-75k, 16375.0% for AGIs $100k-200k)
Taxable interest for individuals: $1,372 (reported on 36.0% of returns)
This zip code:
$1,372
Arizona:
$2,325
(% of AGI for various income ranges: 13.1% for AGIs below $25k, 145.7% for AGIs $25k-50k, 164.0% for AGIs $50k-75k, 210.0% for AGIs $100k-200k)
Ordinary dividends: $2,500 (reported on 16.0% of returns)
Here:
$2,500
State:
$8,711
(% of AGI for various income ranges: 23.8% for AGIs below $25k, 30.0% for AGIs $25k-50k, 282.0% for AGIs $50k-75k)
Net capital gain/loss in AGI: +$4,900 (reported on 20.0% of returns)
Here:
+$4,900
State:
+$31,332
(% of AGI for various income ranges: 56.9% for AGIs below $25k, 42.9% for AGIs $25k-50k, 1845.0% for AGIs $100k-200k)
Profit/loss from business: +$2,300 (reported on 10.0% of returns)
Here:
+$2,300
State:
+$13,214
(% of AGI for various income ranges: 71.9% for AGIs below $25k)
Taxable individual retirement arrangement distribution: $18,262 (reported on 16.0% of returns)
86444:
$18,262
Arizona:
$23,364
(% of AGI for various income ranges: 170.6% for AGIs below $25k, 465.7% for AGIs $25k-50k, 1724.0% for AGIs $50k-75k)
Earned income credit: $1,629 (reported on 14.0% of returns)
Here:
$1,629
State:
$2,383
(% of AGI for various income ranges: 71.2% for AGIs below $25k)
Percentage of individuals using paid preparers for their 2020 taxes: 92.0%
Here:
92%
State:
93%
(% for various income ranges: 91.3% for AGIs below $25k, 91.7% for AGIs $25k-50k, 100.0% for AGIs $50k-75k, 100.0% for AGIs $75k-100k, 83.3% for AGIs $100k-200k)
Averages for the 2012 tax year for zip code 86444, filed in 2013:
Average Adjusted Gross Income (AGI) in 2012: $36,703 (Individual Income Tax Returns)
Here:
$36,703
State:
$57,644
Salary/wage: $26,444 (reported on 48.6% of returns)
Here:
$26,444
State:
$47,932
(% of AGI for various income ranges: 37.1% for AGIs below $25k, 61.3% for AGIs $25k-50k, 30.4% for AGIs $75k-100k)
Taxable interest for individuals: $1,669 (reported on 35.1% of returns)
This zip code:
$1,669
Arizona:
$2,064
(% of AGI for various income ranges: 2.3% for AGIs below $25k, 0.9% for AGIs $25k-50k, 4.2% for AGIs $50k-75k, 0.5% for AGIs $75k-100k)
Ordinary dividends: $1,750 (reported on 16.2% of returns)
Here:
$1,750
State:
$7,268
Profit/loss from business: +$4,500 (reported on 13.5% of returns)
Here:
+$4,500
State:
+$12,323
Taxable individual retirement arrangement distribution: $16,586 (reported on 18.9% of returns)
86444:
$16,586
Arizona:
$18,280
(% of AGI for various income ranges: 7.4% for AGIs below $25k, 5.2% for AGIs $25k-50k, 30.5% for AGIs $50k-75k)
Total itemized deductions: $20,200 (36% of AGI, reported on 21.6% of returns)
Here:
$20,200
State:
$23,651
Here:
36.5% of AGI
State:
20.6% of AGI
(% of AGI for various income ranges: 24.0% for AGIs below $25k, 9.3% for AGIs $25k-50k, 27.9% for AGIs $50k-75k)
Charity contributions: $1,200 (reported on 16.2% of returns)
Here:
$1,200
State:
$4,114
Taxes paid: $3,912 (reported on 21.6% of returns)
86444:
$3,912
State:
$6,509
(% of AGI for various income ranges: 2.2% for AGIs below $25k, 2.3% for AGIs $25k-50k, 6.7% for AGIs $50k-75k)
Earned income credit: $1,343 (reported on 18.9% of returns)
Here:
$1,343
State:
$2,432
(% of AGI for various income ranges: 4.4% for AGIs below $25k)
Percentage of individuals using paid preparers for their 2012 taxes: 62.2%
Here:
62%
State:
52%
(% for various income ranges: 58.8% for AGIs below $25k, 63.6% for AGIs $25k-50k, 75.0% for AGIs $50k-75k, 60.0% for AGIs $75k-100k)
Averages for the 2004 tax year for zip code 86444, filed in 2005:
Average Adjusted Gross Income (AGI) in 2004: $32,186 (Individual Income Tax Returns)
Here:
$32,186
State:
$50,097
Salary/wage: $22,979 (reported on 51.8% of returns)
Here:
$22,979
State:
$42,146
(% of AGI for various income ranges: 53.8% for AGIs below $10k, 34.2% for AGIs $10k-25k, 39.4% for AGIs $25k-50k, 32.3% for AGIs $50k-75k, 51.8% for AGIs $75k-100k, 30.2% for AGIs over 100k)
Taxable interest for individuals: $1,635 (reported on 48.8% of returns)
This zip code:
$1,635
Arizona:
$2,374
(% of AGI for various income ranges: 5.7% for AGIs below $10k, 3.2% for AGIs $10k-25k, 3.1% for AGIs $25k-50k, 1.5% for AGIs $50k-75k, 4.2% for AGIs $75k-100k, 0.6% for AGIs over 100k)
Taxable dividends: $662 (reported on 21.6% of returns)
Here:
$662
State:
$3,888
(% of AGI for various income ranges: 1.0% for AGIs below $10k, 1.1% for AGIs $10k-25k, 0.4% for AGIs $25k-50k, 0.1% for AGIs $50k-75k, 0.6% for AGIs $75k-100k)
Net capital gain/loss: +$3,238 (reported on 27.2% of returns)
Here:
+$3,238
State:
+$17,569
(% of AGI for various income ranges: 6.7% for AGIs below $10k, -0.3% for AGIs $10k-25k, 1.7% for AGIs $25k-50k, 1.2% for AGIs $50k-75k, 16.4% for AGIs $75k-100k)
Profit/loss from business: +$5,771 (reported on 18.9% of returns)
Here:
+$5,771
State:
+$11,088
Total itemized deductions: $15,786 (33% of AGI, reported on 26.4% of returns)
Here:
$15,786
State:
$19,781
Here:
32.9% of AGI
State:
21.8% of AGI
(% of AGI for various income ranges: 17.5% for AGIs $10k-25k, 14.3% for AGIs $25k-50k, 12.8% for AGIs $50k-75k, 14.7% for AGIs $75k-100k, 8.4% for AGIs over 100k)
Charity contributions deductions: $1,955 (4% of AGI, reported on 24.0% of returns)
Here:
$1,955
State:
$3,389
Here:
4.1% of AGI
State:
3.5% of AGI
(% of AGI for various income ranges: 1.7% for AGIs $10k-25k, 1.6% for AGIs $25k-50k, 2.7% for AGIs $50k-75k, 2.2% for AGIs $75k-100k)
Total tax: $4,496 (reported on 72.2% of returns)
86444:
$4,496
State:
$8,323
(% of AGI for various income ranges: 3.2% for AGIs below $10k, 3.8% for AGIs $10k-25k, 6.9% for AGIs $25k-50k, 9.5% for AGIs $50k-75k, 12.5% for AGIs $75k-100k, 18.8% for AGIs over 100k)
Earned income credit: $1,364 (reported on 11.9% of returns)
Here:
$1,364
State:
$1,786
Percentage of individuals using paid preparers for their 2004 taxes: 64.2%
Here:
64%
State:
60%
(% for various income ranges: 58.2% for AGIs below $10k, 65.4% for AGIs $10k-25k, 62.2% for AGIs $25k-50k, 69.7% for AGIs $50k-75k, 64.7% for AGIs $75k-100k, 81.2% for AGIs over 100k)
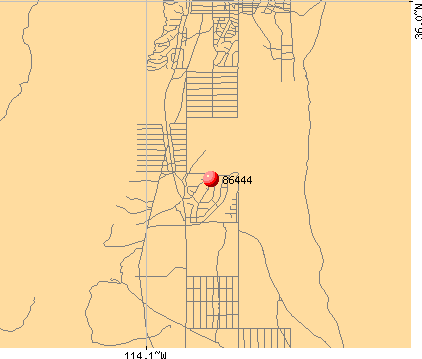
Notable locations in zip code 86444: Pearce Ferry (A), Hualapai Valley Joshua Trees (B), Patterson Corral (C), Valley Ranch (D), Burnt Mill Ranch (E), Pearce Ferry Boat Anchorage (F), Diamond Bar Ranch (G), Grapevine Mesa Fire Station (H). Display/hide their locations on the map
Reservoirs: East Tank (A), Honeymoon Tank (B), Lost Creek Reservoir (C), New Water Tank (D), North Tank (E), Reservation Tank (F), Topside Reservoir (G), Bryce Tank (H). Display/hide their locations on the map
Size of family households: 436 2-persons, 100 3-persons
Size of nonfamily households: 304 1-person, 81 2-persons
102.3% of residents of 86444 zip code speak English at home.
0.5% of residents speak Spanish at home (100% not at all).
Foreign born population: 53 (3.2%) (100.0% of them are naturalized citizens)
This zip code:
3.2%
Whole state:
13.1%
96%Belgium
16%Honduras
27%English
15%German
15%Scottish
12%Scotch-Irish
9%Welsh
7%Irish
7%French
Year of entry for the foreign-born population
02010 or later
02000 to 2009
71990 to 1999
39Before 1990
Housing units lacking complete plumbing facilities: 6.7% Housing units lacking complete kitchen facilities: 1.4%
51.3%Electricity
32.7%Bottled, tank, or LP gas
7.4%Wood
7.3%Utility gas
1.6%Solar energy
Population in 1990: 118. Population change in the 1990s: +749 (+634.7%).
Place of birth for U.S.-born residents:
This state: 28
Northeast: 15
Midwest: 555
South: 254
West: 793
56% of the 86444 zip code residents lived in the same house 5 years ago. Out of people who lived in different houses, 20% lived in this county. Out of people who lived in different counties, 50% lived in Arizona.
92% of the 86444 zip code residents lived in the same house 1 year ago. Out of people who lived in different houses, 30% moved from this county. Out of people who lived in different houses, 83% moved from different state.
Private vs. public school enrollment:
Students in private schools in grades 1 to 8 (elementary and middle school):
Here:
0.0%
Arizona:
10.4%
Top industries in this zip code by the number of employees in 2005:
Utilities: Water Supply and Irrigation Systems (5-9: 1)
Other Services (except Public Administration): Other Similar Organizations (except Business, Professional, Labor, and Political Organizations) (5-9: 1)
Other Services (except Public Administration): Civic and Social Organizations (5-9: 1)
Construction: Painting and Wall Covering Contractors (1-4: 1)
Fatal accident statistics in 2012:
Fatal accident count: 1
Vehicles involved in fatal accidents: 2
Fatal accidents caused by drunken drivers: 0
Fatalities: 1
Persons involved in fatal accidents: 5
Pedestrians involved in fatal accidents: 0
Fatal accident statistics in 2011:
Fatal accident count: 2
Vehicles involved in fatal accidents: 3
Fatal accidents caused by drunken drivers: 1
Fatalities: 2
Persons involved in fatal accidents: 5
Pedestrians involved in fatal accidents: 0
Home Mortgage Disclosure Act Aggregated Statistics For Year 2009 (Based on 2 partial tracts)
A) FHA, FSA/RHS & VA Home Purchase Loans
B) Conventional Home Purchase Loans
C) Refinancings
D) Home Improvement Loans
F) Non-occupant Loans on < 5 Family Dwellings (A B C & D)
G) Loans On Manufactured Home Dwelling (A B C & D)
Number
Average Value
Number
Average Value
Number
Average Value
Number
Average Value
Number
Average Value
Number
Average Value
LOANS ORIGINATED
11
$117,227
9
$103,377
14
$115,851
1
$67,130
6
$98,045
5
$100,452
APPLICATIONS APPROVED, NOT ACCEPTED
0
$0
1
$46,100
2
$126,440
1
$27,500
1
$63,360
1
$25,340
APPLICATIONS DENIED
3
$92,203
4
$110,670
18
$134,411
4
$38,282
2
$140,190
7
$73,677
APPLICATIONS WITHDRAWN
1
$97,860
1
$103,800
6
$144,550
2
$35,585
2
$69,690
2
$72,520
FILES CLOSED FOR INCOMPLETENESS
0
$0
0
$0
1
$305,460
1
$72,520
0
$0
1
$51,220
Aggregated Statistics For Year 2008 (Based on 2 partial tracts)
A) FHA, FSA/RHS & VA Home Purchase Loans
B) Conventional Home Purchase Loans
C) Refinancings
D) Home Improvement Loans
F) Non-occupant Loans on < 5 Family Dwellings (A B C & D)
G) Loans On Manufactured Home Dwelling (A B C & D)
Number
Average Value
Number
Average Value
Number
Average Value
Number
Average Value
Number
Average Value
Number
Average Value
LOANS ORIGINATED
4
$168,298
12
$146,056
23
$138,047
4
$105,010
8
$124,555
9
$105,982
APPLICATIONS APPROVED, NOT ACCEPTED
0
$0
1
$108,650
4
$112,355
1
$17,520
1
$142,350
2
$127,520
APPLICATIONS DENIED
2
$148,550
8
$147,909
26
$147,025
9
$58,653
5
$128,492
17
$93,868
APPLICATIONS WITHDRAWN
1
$164,730
2
$93,955
12
$159,805
2
$83,980
4
$168,432
5
$119,864
FILES CLOSED FOR INCOMPLETENESS
0
$0
0
$0
3
$173,263
2
$24,535
2
$99,080
1
$60,390
Aggregated Statistics For Year 2007 (Based on 2 partial tracts)
A) FHA, FSA/RHS & VA Home Purchase Loans
B) Conventional Home Purchase Loans
C) Refinancings
D) Home Improvement Loans
F) Non-occupant Loans on < 5 Family Dwellings (A B C & D)
G) Loans On Manufactured Home Dwelling (A B C & D)
Number
Average Value
Number
Average Value
Number
Average Value
Number
Average Value
Number
Average Value
Number
Average Value
LOANS ORIGINATED
3
$174,880
23
$157,036
46
$147,723
8
$96,281
19
$149,841
22
$93,625
APPLICATIONS APPROVED, NOT ACCEPTED
0
$0
4
$127,318
14
$143,504
2
$160,410
6
$126,128
6
$97,147
APPLICATIONS DENIED
2
$126,175
12
$164,613
53
$158,764
12
$76,184
14
$166,054
23
$91,887
APPLICATIONS WITHDRAWN
0
$0
4
$111,075
20
$165,777
2
$82,230
3
$166,613
5
$105,522
FILES CLOSED FOR INCOMPLETENESS
0
$0
2
$205,570
8
$221,915
1
$46,370
1
$231,320
0
$0
Aggregated Statistics For Year 2003 (Based on 2 partial tracts)
A) FHA, FSA/RHS & VA Home Purchase Loans
B) Conventional Home Purchase Loans
C) Refinancings
D) Home Improvement Loans
F) Non-occupant Loans on < 5 Family Dwellings (A B C & D)
Number
Average Value
Number
Average Value
Number
Average Value
Number
Average Value
Number
Average Value
LOANS ORIGINATED
2
$95,575
32
$80,484
42
$80,694
1
$25,880
9
$70,934
APPLICATIONS APPROVED, NOT ACCEPTED
0
$0
4
$71,108
9
$72,702
0
$0
1
$62,820
APPLICATIONS DENIED
0
$0
12
$73,466
34
$75,488
4
$22,512
3
$78,273
APPLICATIONS WITHDRAWN
0
$0
4
$76,835
17
$78,676
1
$12,940
2
$70,095
FILES CLOSED FOR INCOMPLETENESS
0
$0
1
$49,880
1
$104,600
0
$0
0
$0
Aggregated Statistics For Year 2002 (Based on 2 partial tracts)
A) FHA, FSA/RHS & VA Home Purchase Loans
B) Conventional Home Purchase Loans
C) Refinancings
D) Home Improvement Loans
F) Non-occupant Loans on < 5 Family Dwellings (A B C & D)
Number
Average Value
Number
Average Value
Number
Average Value
Number
Average Value
Number
Average Value
LOANS ORIGINATED
1
$62,550
7
$57,926
9
$77,794
0
$0
2
$43,945
APPLICATIONS APPROVED, NOT ACCEPTED
0
$0
2
$76,295
2
$66,455
0
$0
0
$0
APPLICATIONS DENIED
0
$0
3
$93,370
6
$58,593
1
$8,630
2
$70,230
APPLICATIONS WITHDRAWN
0
$0
1
$53,920
5
$83,036
0
$0
1
$32,890
FILES CLOSED FOR INCOMPLETENESS
0
$0
0
$0
0
$0
0
$0
0
$0
Aggregated Statistics For Year 2001 (Based on 2 partial tracts)
B) Conventional Home Purchase Loans
C) Refinancings
D) Home Improvement Loans
F) Non-occupant Loans on < 5 Family Dwellings (A B C & D)
Number
Average Value
Number
Average Value
Number
Average Value
Number
Average Value
LOANS ORIGINATED
2
$65,515
3
$46,640
0
$0
1
$35,590
APPLICATIONS APPROVED, NOT ACCEPTED
1
$27,770
1
$50,420
0
$0
0
$0
APPLICATIONS DENIED
3
$43,587
2
$48,395
0
$0
0
$0
APPLICATIONS WITHDRAWN
1
$25,340
2
$69,150
1
$15,100
0
$0
FILES CLOSED FOR INCOMPLETENESS
0
$0
0
$0
0
$0
0
$0
Aggregated Statistics For Year 2000 (Based on 2 partial tracts)
A) FHA, FSA/RHS & VA Home Purchase Loans
B) Conventional Home Purchase Loans
C) Refinancings
Number
Average Value
Number
Average Value
Number
Average Value
LOANS ORIGINATED
1
$32,620
2
$52,300
1
$47,450
APPLICATIONS APPROVED, NOT ACCEPTED
0
$0
1
$25,610
0
$0
APPLICATIONS DENIED
0
$0
3
$46,640
2
$62,410
APPLICATIONS WITHDRAWN
0
$0
1
$52,030
2
$47,585
FILES CLOSED FOR INCOMPLETENESS
0
$0
0
$0
0
$0
Aggregated Statistics For Year 1999 (Based on 1 partial tract)
A) FHA, FSA/RHS & VA Home Purchase Loans
B) Conventional Home Purchase Loans
C) Refinancings
D) Home Improvement Loans
F) Non-occupant Loans on < 5 Family Dwellings (A B C & D)


 Nearest zip codes: 86443, 86409, 86411, 86441, 86445, 86434.


