Estimated zip code population in 2022: 754 Zip code population in 2010: 1,245 Zip code population in 2000: 1,141
Houses and condos: 376 Renter-occupied apartments: 154
% of renters here:
51%
State:
44%
March 2022 cost of living index in zip code 92070: 104.3 (near average, U.S. average is 100)
Land area: 133.2 sq. mi. Water area: 3.3 sq. mi.
Population density: 6 people per square mile
(very low).
OSM Map
General Map
Google Map
MSN Map
OSM Map
General Map
Google Map
MSN Map
OSM Map
General Map
Google Map
MSN Map
OSM Map
General Map
Google Map
MSN Map
Please wait while loading the map...
Real estate property taxes paid for housing units in 2022:
This zip code:
1.0% ($4,502)
California:
0.7% ($4,831)
Median real estate property taxes paid for housing units with mortgages in 2022: $5,902 (0.9%) Median real estate property taxes paid for housing units with no mortgage in 2022: $2,445 (0.9%)
Business Search- 14 Million verified businesses
Males: 474
(62.9%)
Females: 279
(37.1%)
For population 25 years and over in 92070:
High school or higher: 89.6%
Bachelor's degree or higher: 33.1%
Graduate or professional degree: 3.0%
Unemployed: 3.0%
Mean travel time to work (commute): 37.3 minutes
For population 15 years and over in 92070:
Never married: 31.6%
Now married: 33.5%
Separated: 1.0%
Widowed: 7.0%
Divorced: 26.9%
Zip code 92070 compared to state average:
Median house value below state average.
Unemployed percentage below state average.
Black race population percentage significantly below state average.
Hispanic race population percentage below state average.
Median age above state average.
Foreign-born population percentage significantly below state average.
Averages for the 2020 tax year for zip code 92070, filed in 2021:
Average Adjusted Gross Income (AGI) in 2020: $61,839 (Individual Income Tax Returns)
Here:
$61,839
State:
$95,910
Salary/wage: $47,232 (reported on 72.1% of returns)
Here:
$47,232
State:
$77,331
(% of AGI for various income ranges: 1177.5% for AGIs below $25k, 3879.1% for AGIs $25k-50k, 5852.0% for AGIs $50k-75k, 9536.7% for AGIs $75k-100k, 23287.5% for AGIs $100k-200k)
Taxable interest for individuals: $1,741 (reported on 27.9% of returns)
This zip code:
$1,741
California:
$2,294
(% of AGI for various income ranges: 5.0% for AGIs below $25k, 29.1% for AGIs $25k-50k, 48.0% for AGIs $50k-75k, 16.7% for AGIs $75k-100k, 162.5% for AGIs $100k-200k)
Ordinary dividends: $3,833 (reported on 14.8% of returns)
Here:
$3,833
State:
$10,949
(% of AGI for various income ranges: 85.0% for AGIs below $25k, 306.0% for AGIs $50k-75k, 225.0% for AGIs $100k-200k)
Net capital gain/loss in AGI: +$20,978 (reported on 14.8% of returns)
Here:
+$20,978
State:
+$49,306
(% of AGI for various income ranges: 22.7% for AGIs $25k-50k, 243.3% for AGIs $75k-100k)
Profit/loss from business: +$11,178 (reported on 14.8% of returns)
Here:
+$11,178
State:
+$15,671
(% of AGI for various income ranges: 164.2% for AGIs below $25k, 330.9% for AGIs $25k-50k, 742.0% for AGIs $50k-75k, 185.0% for AGIs $100k-200k)
Taxable individual retirement arrangement distribution: $15,475 (reported on 6.6% of returns)
92070:
$15,475
California:
$23,505
(% of AGI for various income ranges: 1238.0% for AGIs $50k-75k)
Total itemized deductions: $29,550 (reported on 9.8% of returns)
Here:
$29,550
State:
$39,517
(% of AGI for various income ranges: 478.2% for AGIs $25k-50k, 3117.5% for AGIs $100k-200k)
Charity contributions: $4,225 (reported on 6.6% of returns)
Here:
$4,225
State:
$12,598
(% of AGI for various income ranges: 422.5% for AGIs $100k-200k)
Taxes paid: $7,900 (reported on 9.8% of returns)
92070:
$7,900
State:
$8,807
(% of AGI for various income ranges: 136.4% for AGIs $25k-50k, 810.0% for AGIs $100k-200k)
Earned income credit: $2,000 (reported on 18.0% of returns)
Here:
$2,000
State:
$2,074
(% of AGI for various income ranges: 102.5% for AGIs below $25k, 88.2% for AGIs $25k-50k)
Percentage of individuals using paid preparers for their 2020 taxes: 90.2%
Here:
90%
State:
92%
(% for various income ranges: 90.0% for AGIs below $25k, 88.9% for AGIs $25k-50k, 87.5% for AGIs $50k-75k, 80.0% for AGIs $75k-100k, 100.0% for AGIs $100k-200k, 100.0% for AGIs over 200k)
Averages for the 2012 tax year for zip code 92070, filed in 2013:
Average Adjusted Gross Income (AGI) in 2012: $41,120 (Individual Income Tax Returns)
Here:
$41,120
State:
$72,726
Salary/wage: $33,112 (reported on 75.9% of returns)
Here:
$33,112
State:
$59,079
(% of AGI for various income ranges: 65.9% for AGIs below $25k, 71.8% for AGIs $25k-50k, 62.1% for AGIs $50k-75k, 60.7% for AGIs $75k-100k, 48.8% for AGIs $100k-200k)
Taxable interest for individuals: $1,082 (reported on 31.5% of returns)
This zip code:
$1,082
California:
$2,146
(% of AGI for various income ranges: 1.1% for AGIs below $25k, 0.6% for AGIs $25k-50k, 0.9% for AGIs $50k-75k, 0.9% for AGIs $75k-100k, 0.8% for AGIs $100k-200k)
Ordinary dividends: $3,725 (reported on 14.8% of returns)
Here:
$3,725
State:
$9,308
(% of AGI for various income ranges: 1.1% for AGIs below $25k, 1.6% for AGIs $25k-50k, 3.8% for AGIs $50k-75k)
Profit/loss from business: +$10,000 (reported on 14.8% of returns)
Here:
+$10,000
State:
+$17,064
(% of AGI for various income ranges: 8.4% for AGIs below $25k, 3.7% for AGIs $25k-50k, 7.6% for AGIs $50k-75k)
Taxable individual retirement arrangement distribution: $14,125 (reported on 7.4% of returns)
92070:
$14,125
California:
$19,557
Total itemized deductions: $23,446 (29% of AGI, reported on 24.1% of returns)
Here:
$23,446
State:
$34,004
Here:
28.6% of AGI
State:
22.7% of AGI
(% of AGI for various income ranges: 12.5% for AGIs $25k-50k, 12.7% for AGIs $50k-75k, 19.9% for AGIs $75k-100k, 18.9% for AGIs $100k-200k)
Charity contributions: $2,878 (reported on 16.7% of returns)
Here:
$2,878
State:
$4,659
(% of AGI for various income ranges: 1.3% for AGIs $25k-50k, 1.7% for AGIs $50k-75k, 1.8% for AGIs $100k-200k)
Taxes paid: $7,477 (reported on 24.1% of returns)
92070:
$7,477
State:
$14,448
(% of AGI for various income ranges: 2.3% for AGIs $25k-50k, 3.6% for AGIs $50k-75k, 6.2% for AGIs $75k-100k, 8.0% for AGIs $100k-200k)
Earned income credit: $2,100 (reported on 18.5% of returns)
Here:
$2,100
State:
$2,286
(% of AGI for various income ranges: 5.0% for AGIs below $25k, 1.2% for AGIs $25k-50k)
Percentage of individuals using paid preparers for their 2012 taxes: 61.1%
Here:
61%
State:
64%
(% for various income ranges: 52.2% for AGIs below $25k, 60.0% for AGIs $25k-50k, 75.0% for AGIs $50k-75k, 75.0% for AGIs $75k-100k, 75.0% for AGIs $100k-200k)
Averages for the 2004 tax year for zip code 92070, filed in 2005:
Average Adjusted Gross Income (AGI) in 2004: $41,772 (Individual Income Tax Returns)
Here:
$41,772
State:
$58,600
Salary/wage: $33,843 (reported on 78.0% of returns)
Here:
$33,843
State:
$49,455
(% of AGI for various income ranges: 145.6% for AGIs below $10k, 72.8% for AGIs $10k-25k, 78.5% for AGIs $25k-50k, 69.6% for AGIs $50k-75k, 64.5% for AGIs $75k-100k, 43.2% for AGIs over 100k)
Taxable interest for individuals: $1,825 (reported on 42.4% of returns)
This zip code:
$1,825
California:
$2,365
(% of AGI for various income ranges: 12.6% for AGIs below $10k, 3.2% for AGIs $10k-25k, 1.1% for AGIs $25k-50k, 1.5% for AGIs $50k-75k, 0.4% for AGIs $75k-100k, 2.3% for AGIs over 100k)
Taxable dividends: $2,116 (reported on 15.9% of returns)
Here:
$2,116
State:
$4,746
(% of AGI for various income ranges: 13.1% for AGIs below $10k, 1.1% for AGIs $25k-50k, 1.7% for AGIs $50k-75k, 0.3% for AGIs over 100k)
Net capital gain/loss: +$17,105 (reported on 17.6% of returns)
Here:
+$17,105
State:
+$23,418
(% of AGI for various income ranges: -5.3% for AGIs below $10k, -0.3% for AGIs $25k-50k, 0.5% for AGIs $50k-75k, 20.9% for AGIs over 100k)
Profit/loss from business: +$5,389 (reported on 17.6% of returns)
Here:
+$5,389
State:
+$16,826
(% of AGI for various income ranges: 10.2% for AGIs below $10k, 4.8% for AGIs $10k-25k, 4.7% for AGIs $25k-50k, 0.7% for AGIs $50k-75k, 3.4% for AGIs $75k-100k)
IRA payment deduction: $2,000 (reported on 2.0% of returns)
92070:
$2,000
California:
$3,192
Total itemized deductions: $23,638 (28% of AGI, reported on 25.6% of returns)
Here:
$23,638
State:
$28,113
Here:
27.8% of AGI
State:
25.3% of AGI
(% of AGI for various income ranges: 16.4% for AGIs $10k-25k, 11.1% for AGIs $25k-50k, 15.9% for AGIs $50k-75k, 12.9% for AGIs $75k-100k, 16.3% for AGIs over 100k)
Charity contributions deductions: $3,000 (3% of AGI, reported on 21.9% of returns)
Here:
$3,000
State:
$3,923
Here:
3.4% of AGI
State:
3.3% of AGI
(% of AGI for various income ranges: 0.3% for AGIs $10k-25k, 1.3% for AGIs $25k-50k, 0.8% for AGIs $50k-75k, 0.9% for AGIs $75k-100k, 2.8% for AGIs over 100k)
Total tax: $6,166 (reported on 74.6% of returns)
92070:
$6,166
State:
$10,761
(% of AGI for various income ranges: 11.2% for AGIs below $10k, 4.0% for AGIs $10k-25k, 6.9% for AGIs $25k-50k, 9.2% for AGIs $50k-75k, 12.4% for AGIs $75k-100k, 16.8% for AGIs over 100k)
Earned income credit: $1,398 (reported on 17.2% of returns)
Here:
$1,398
State:
$1,763
Percentage of individuals using paid preparers for their 2004 taxes: 63.7%
Here:
64%
State:
66%
(% for various income ranges: 55.8% for AGIs below $10k, 52.6% for AGIs $10k-25k, 66.4% for AGIs $25k-50k, 78.3% for AGIs $50k-75k, 75.0% for AGIs $75k-100k, 81.0% for AGIs over 100k)
Household received Food Stamps/SNAP in the past 12 months: 13 Household did not receive Food Stamps/SNAP in the past 12 months: 286
Women who had a birth in the past 12 months: 10 (9 now married, 1 unmarried) Women who did not have a birth in the past 12 months: 137 (36 now married, 101 unmarried)
Housing units in zip code 92070 with a mortgage: 59 (3 second mortgage, 3 both second mortgage and home equity loan) Median monthly owner costs for units with a mortgage: $2,936 Median monthly owner costs for units without a mortgage: $390
Residents with income below the poverty level in 2022:
This zip code:
13.2%
Whole state:
12.2%
Residents with income below 50% of the poverty level in 2022:
This zip code:
6.5%
Whole state:
6.2%
Median number of rooms in houses and condos:
Here:
5.1
State:
6.0
Median number of rooms in apartments:
Here:
3.5
State:
3.9
Notable locations in this zip code not listed on our city pages
Notable locations in zip code 92070: Mesa Chiquita Ranch (A), Matagua Ranch (B), Black Canyon Campground (C), San Luis Rey Camp (D), Santa Ysabel Ranch (E), Henshaw Work Center (F), San Luis Rey Picnic Ground (G), Mesa Grande Fire Department (H), Henshaw Fire Station (I). Display/hide their locations on the map
Creeks: Coleman Creek (A), Mariette Creek (B), Carrizo Creek (C), Carrista Creek (D), Buena Vista Creek (E), Boring Creek (F), Wigham Creek (G), Witch Creek (H), Bloomdale Creek (I). Display/hide their locations on the map
Size of family households: 58 2-persons, 41 3-persons, 36 4-persons, 30 5-persons, 4 7-or-more-persons
Size of nonfamily households: 42 1-person, 92 2-persons
70 married couples with children.
19 single-parent households (5 men, 14 women).
86.0% of residents of 92070 zip code speak English at home.
8.8% of residents speak Spanish at home (75% very well, 11% well, 14% not well).
4.4% of residents speak other Indo-European language at home (81% very well, 19% not well).
Foreign born population: 64 (8.5%) (72.2% of them are naturalized citizens)
This zip code:
8.5%
Whole state:
26.7%
40%Honduras
25%Netherlands
10%France
10%Poland
6%Italy
15%German
11%Norwegian
4%Swiss
2%Irish
2%English
1%Romanian
1%British
Year of entry for the foreign-born population
72010 or later
02000 to 2009
231990 to 1999
31Before 1990
Facilities with environmental interests located in this zip code:
CALTRANS LAKE HENSHAW MTC STA (ROUTE 79 STAR ROUTE in SANTA YSABEL, CA)
STATE MASTER (California - Hazardous Waste Tracking) - HAZARDOU WASTE PROGRAM Small Quantity Generators, between 100 kg and 1000 kg of hazardous waste/month (Resource Conservation and Recovery Act (tracking hazardous waste)) - notification Alternative names: CALTRANS LK HENSHAW LANNY CHRONERT MS57
CAMP KEARNEY MESA (CAMP KEARNEY in MESA GRANDE, CA)
CRITERIA AND HAZARDOUS AIR POLLUTANT INVENTORY (Inventory of air pollution sources) Business SIC classification: REFUSE SYSTEMS Business NAICS classification: SOLID WASTE LANDFILL.
Housing units lacking complete plumbing facilities: 4.3% Housing units lacking complete kitchen facilities: 4.0%
50.0%Bottled, tank, or LP gas
29.9%Electricity
10.4%Utility gas
7.7%Wood
2.0%Other fuel
0.7%Fuel oil, kerosene, etc.
Population in 1990: 1,263.
Place of birth for U.S.-born residents:
This state: 480
Northeast: 69
Midwest: 37
South: 26
West: 72
66% of the 92070 zip code residents lived in the same house 5 years ago. Out of people who lived in different houses, 76% lived in this county. Out of people who lived in different counties, 50% lived in California.
97% of the 92070 zip code residents lived in the same house 1 year ago. Out of people who lived in different houses, 94% moved from this county. Out of people who lived in different houses, 12% moved from different county within same state.
Private vs. public school enrollment:
Students in private schools in grades 1 to 8 (elementary and middle school):
Here:
0.0%
California:
10.5%
Students in private schools in grades 9 to 12 (high school): 6
Here:
18.9%
California:
8.5%
Students in private undergraduate colleges: 8
Here:
37.5%
California:
15.9%
Occupation by median earnings in the past 12 months ($)
117,108Law enforcement workers including supervisors
73,272Production occupations
69,737Education, training, and library occupations
59,696Arts, design, entertainment, sports, and media occupations
58,737Office and administrative support occupations
57,059Community and social service occupations
Companies with federal contracts located in this zip code:
PACIFIC WEST ARCHAEOLOGY, INC (3166 WILLIAMS RANCH RD in SANTA YSABEL, CA; small business)
$33,380 with Navy for Maintenance, Repair or Alteration of Real Property -- Other Non-Building Facilities. Signed on 2003-11-24. Completion date: 2004-04-27.
Top industries in this zip code by the number of employees in 2005:
Accommodation and Food Services: Full-Service Restaurants (10-19 employees: 2 establishments)
Accommodation and Food Services: Hotels (except Casino Hotels) and Motels (10-19: 1)
Information: Software Publishers (10-19: 1)
Fatal accident statistics in 2014:
Fatal accident count: 2
Vehicles involved in fatal accidents: 2
Fatal accidents caused by drunken drivers: 1
Fatalities: 2
Persons involved in fatal accidents: 2
Pedestrians involved in fatal accidents: 0
Fatal accident statistics in 2013:
Fatal accident count: 4
Vehicles involved in fatal accidents: 6
Fatal accidents caused by drunken drivers: 0
Fatalities: 4
Persons involved in fatal accidents: 7
Pedestrians involved in fatal accidents: 0
Home Mortgage Disclosure Act Aggregated Statistics For Year 2009 (Based on 2 partial tracts)
A) FHA, FSA/RHS & VA Home Purchase Loans
B) Conventional Home Purchase Loans
C) Refinancings
D) Home Improvement Loans
F) Non-occupant Loans on < 5 Family Dwellings (A B C & D)
G) Loans On Manufactured Home Dwelling (A B C & D)
Number
Average Value
Number
Average Value
Number
Average Value
Number
Average Value
Number
Average Value
Number
Average Value
LOANS ORIGINATED
0
$0
3
$193,880
15
$239,346
0
$0
5
$190,864
2
$211,230
APPLICATIONS APPROVED, NOT ACCEPTED
1
$133,910
1
$119,570
2
$235,185
0
$0
1
$122,590
1
$186,340
APPLICATIONS DENIED
1
$150,130
2
$202,370
9
$206,789
1
$129,000
4
$211,328
3
$87,133
APPLICATIONS WITHDRAWN
0
$0
2
$275,545
5
$276,262
1
$65,630
3
$230,093
2
$141,640
FILES CLOSED FOR INCOMPLETENESS
0
$0
0
$0
1
$134,280
0
$0
1
$91,280
0
$0
Aggregated Statistics For Year 2008 (Based on 2 partial tracts)
A) FHA, FSA/RHS & VA Home Purchase Loans
B) Conventional Home Purchase Loans
C) Refinancings
D) Home Improvement Loans
F) Non-occupant Loans on < 5 Family Dwellings (A B C & D)
G) Loans On Manufactured Home Dwelling (A B C & D)
Number
Average Value
Number
Average Value
Number
Average Value
Number
Average Value
Number
Average Value
Number
Average Value
LOANS ORIGINATED
0
$0
4
$251,875
9
$267,226
1
$124,850
3
$255,240
1
$232,730
APPLICATIONS APPROVED, NOT ACCEPTED
0
$0
3
$264,793
2
$225,565
1
$363,620
1
$426,610
1
$90,530
APPLICATIONS DENIED
1
$231,600
2
$385,875
12
$237,353
3
$141,200
2
$208,780
6
$193,252
APPLICATIONS WITHDRAWN
0
$0
0
$0
6
$246,187
0
$0
0
$0
1
$252,720
FILES CLOSED FOR INCOMPLETENESS
0
$0
2
$377,200
1
$237,260
0
$0
1
$94,300
0
$0
Aggregated Statistics For Year 2007 (Based on 2 partial tracts)
B) Conventional Home Purchase Loans
C) Refinancings
D) Home Improvement Loans
F) Non-occupant Loans on < 5 Family Dwellings (A B C & D)
G) Loans On Manufactured Home Dwelling (A B C & D)
Number
Average Value
Number
Average Value
Number
Average Value
Number
Average Value
Number
Average Value
LOANS ORIGINATED
12
$234,964
21
$234,403
4
$158,708
6
$211,923
11
$155,304
APPLICATIONS APPROVED, NOT ACCEPTED
3
$253,480
6
$218,965
1
$164,460
1
$274,600
4
$131,265
APPLICATIONS DENIED
7
$301,276
29
$283,069
6
$134,787
3
$423,093
8
$127,871
APPLICATIONS WITHDRAWN
2
$308,925
11
$217,370
1
$126,740
1
$279,880
2
$184,450
FILES CLOSED FOR INCOMPLETENESS
1
$237,260
2
$314,020
0
$0
2
$211,045
1
$154,650
Aggregated Statistics For Year 2006 (Based on 2 partial tracts)
A) FHA, FSA/RHS & VA Home Purchase Loans
B) Conventional Home Purchase Loans
C) Refinancings
D) Home Improvement Loans
F) Non-occupant Loans on < 5 Family Dwellings (A B C & D)
G) Loans On Manufactured Home Dwelling (A B C & D)
Number
Average Value
Number
Average Value
Number
Average Value
Number
Average Value
Number
Average Value
Number
Average Value
LOANS ORIGINATED
3
$242,540
19
$194,615
27
$255,169
4
$157,952
7
$281,660
11
$170,323
APPLICATIONS APPROVED, NOT ACCEPTED
0
$0
2
$229,525
12
$241,251
1
$176,150
2
$290,065
2
$98,640
APPLICATIONS DENIED
0
$0
8
$253,290
37
$242,173
7
$166,830
3
$203,060
9
$196,438
APPLICATIONS WITHDRAWN
1
$144,840
2
$569,570
11
$214,455
3
$87,133
0
$0
2
$98,070
FILES CLOSED FOR INCOMPLETENESS
0
$0
3
$180,427
3
$238,390
0
$0
0
$0
1
$138,430
Aggregated Statistics For Year 2005 (Based on 2 partial tracts)
A) FHA, FSA/RHS & VA Home Purchase Loans
B) Conventional Home Purchase Loans
C) Refinancings
D) Home Improvement Loans
F) Non-occupant Loans on < 5 Family Dwellings (A B C & D)
G) Loans On Manufactured Home Dwelling (A B C & D)
Number
Average Value
Number
Average Value
Number
Average Value
Number
Average Value
Number
Average Value
Number
Average Value
LOANS ORIGINATED
1
$78,830
29
$199,487
39
$258,034
6
$112,532
9
$213,202
14
$138,486
APPLICATIONS APPROVED, NOT ACCEPTED
0
$0
5
$326,956
9
$180,260
1
$179,170
2
$359,470
2
$160,875
APPLICATIONS DENIED
0
$0
16
$240,724
31
$232,781
5
$132,624
5
$202,782
14
$155,784
APPLICATIONS WITHDRAWN
1
$172,380
4
$212,270
26
$238,652
3
$158,047
2
$137,110
6
$132,397
FILES CLOSED FOR INCOMPLETENESS
0
$0
3
$136,420
5
$251,894
0
$0
0
$0
1
$75,440
Aggregated Statistics For Year 2004 (Based on 2 partial tracts)
B) Conventional Home Purchase Loans
C) Refinancings
D) Home Improvement Loans
F) Non-occupant Loans on < 5 Family Dwellings (A B C & D)
G) Loans On Manufactured Home Dwelling (A B C & D)
Number
Average Value
Number
Average Value
Number
Average Value
Number
Average Value
Number
Average Value
LOANS ORIGINATED
29
$202,309
34
$189,698
4
$188,222
7
$229,499
16
$135,486
APPLICATIONS APPROVED, NOT ACCEPTED
5
$187,996
14
$181,029
1
$211,230
2
$169,930
5
$127,946
APPLICATIONS DENIED
12
$218,462
23
$187,517
3
$148,743
4
$200,860
7
$119,734
APPLICATIONS WITHDRAWN
4
$182,660
17
$228,916
2
$110,330
0
$0
3
$138,683
FILES CLOSED FOR INCOMPLETENESS
1
$363,620
3
$221,417
1
$63,750
0
$0
1
$157,290
Aggregated Statistics For Year 2003 (Based on 2 partial tracts)
A) FHA, FSA/RHS & VA Home Purchase Loans
B) Conventional Home Purchase Loans
C) Refinancings
D) Home Improvement Loans
F) Non-occupant Loans on < 5 Family Dwellings (A B C & D)
Number
Average Value
Number
Average Value
Number
Average Value
Number
Average Value
Number
Average Value
LOANS ORIGINATED
2
$157,860
17
$176,685
59
$194,239
1
$21,120
13
$230,730
APPLICATIONS APPROVED, NOT ACCEPTED
0
$0
4
$154,462
11
$147,554
1
$9,430
3
$163,453
APPLICATIONS DENIED
0
$0
6
$206,203
24
$170,856
1
$11,690
3
$187,343
APPLICATIONS WITHDRAWN
0
$0
4
$211,232
18
$186,043
0
$0
1
$208,210
FILES CLOSED FOR INCOMPLETENESS
0
$0
0
$0
2
$169,740
0
$0
0
$0
Aggregated Statistics For Year 1999 (Based on 1 partial tract)
A) FHA, FSA/RHS & VA Home Purchase Loans
B) Conventional Home Purchase Loans
C) Refinancings
D) Home Improvement Loans
F) Non-occupant Loans on < 5 Family Dwellings (A B C & D)

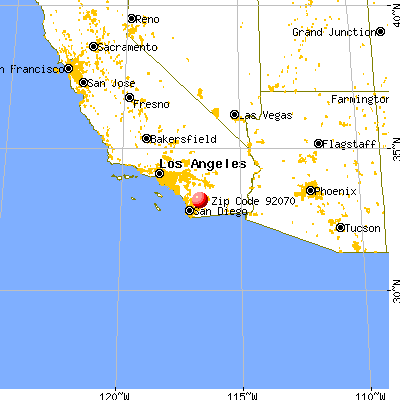


 Nearest zip codes: 92065, 92086, 92066, 92060, 92036, 92061.


