Estimated zip code population in 2022: 1,397 Zip code population in 2010: 1,573 Zip code population in 2000: 1,185
Houses and condos: 750 Renter-occupied apartments: 77
% of renters here:
14%
State:
44%
March 2022 cost of living index in zip code 92086: 105.2 (more than average, U.S. average is 100)
Land area: 220.4 sq. mi. Water area: 0.4 sq. mi.
Population density: 6 people per square mile
(very low).
OSM Map
General Map
Google Map
MSN Map
OSM Map
General Map
Google Map
MSN Map
OSM Map
General Map
Google Map
MSN Map
OSM Map
General Map
Google Map
MSN Map
Please wait while loading the map...
Real estate property taxes paid for housing units in 2022:
This zip code:
0.7% ($2,486)
California:
0.7% ($4,831)
Median real estate property taxes paid for housing units with mortgages in 2022: $2,779 (0.7%) Median real estate property taxes paid for housing units with no mortgage in 2022: $1,565 (0.7%)
Business Search- 14 Million verified businesses
Males: 680
(48.7%)
Females: 716
(51.3%)
For population 25 years and over in 92086:
High school or higher: 93.4%
Bachelor's degree or higher: 33.7%
Graduate or professional degree: 16.4%
Unemployed: 4.1%
Mean travel time to work (commute): 49.4 minutes
For population 15 years and over in 92086:
Never married: 27.2%
Now married: 47.9%
Separated: 3.4%
Widowed: 8.5%
Divorced: 13.1%
Zip code 92086 compared to state average:
Median household income below state average.
Median house value below state average.
Black race population percentage significantly below state average.
Hispanic race population percentage below state average.
Median age significantly above state average.
Renting percentage significantly below state average.
Length of stay since moving in significantly below state average.
Averages for the 2020 tax year for zip code 92086, filed in 2021:
Average Adjusted Gross Income (AGI) in 2020: $51,403 (Individual Income Tax Returns)
Here:
$51,403
State:
$95,910
Salary/wage: $43,695 (reported on 61.9% of returns)
Here:
$43,695
State:
$77,331
(% of AGI for various income ranges: 695.6% for AGIs below $25k, 3060.0% for AGIs $25k-50k, 5678.3% for AGIs $50k-75k, 7546.7% for AGIs $75k-100k, 22970.0% for AGIs $100k-200k)
Taxable interest for individuals: $583 (reported on 36.5% of returns)
This zip code:
$583
California:
$2,294
(% of AGI for various income ranges: 26.2% for AGIs below $25k, 9.1% for AGIs $25k-50k, 65.0% for AGIs $50k-75k, 53.3% for AGIs $75k-100k, 90.0% for AGIs $100k-200k)
Ordinary dividends: $1,888 (reported on 12.7% of returns)
Here:
$1,888
State:
$10,949
(% of AGI for various income ranges: 80.9% for AGIs $25k-50k, 206.7% for AGIs $100k-200k)
Net capital gain/loss in AGI: +$10,650 (reported on 15.9% of returns)
Here:
+$10,650
State:
+$49,306
(% of AGI for various income ranges: 7.5% for AGIs below $25k, 43.6% for AGIs $25k-50k, 3.3% for AGIs $50k-75k, 3343.3% for AGIs $100k-200k)
Profit/loss from business: +$6,333 (reported on 19.0% of returns)
Here:
+$6,333
State:
+$15,671
(% of AGI for various income ranges: 161.2% for AGIs below $25k, 303.6% for AGIs $25k-50k, 560.0% for AGIs $75k-100k)
Taxable individual retirement arrangement distribution: $13,150 (reported on 9.5% of returns)
92086:
$13,150
California:
$23,505
(% of AGI for various income ranges: 190.0% for AGIs $25k-50k, 1933.3% for AGIs $75k-100k)
Total itemized deductions: $31,100 (reported on 7.9% of returns)
Here:
$31,100
State:
$39,517
(% of AGI for various income ranges: 577.3% for AGIs $25k-50k, 3066.7% for AGIs $100k-200k)
Charity contributions: $4,933 (reported on 4.8% of returns)
Here:
$4,933
State:
$12,598
(% of AGI for various income ranges: 493.3% for AGIs $75k-100k)
Taxes paid: $6,900 (reported on 7.9% of returns)
92086:
$6,900
State:
$8,807
(% of AGI for various income ranges: 116.4% for AGIs $25k-50k, 723.3% for AGIs $100k-200k)
Earned income credit: $2,189 (reported on 14.3% of returns)
Here:
$2,189
State:
$2,074
(% of AGI for various income ranges: 73.1% for AGIs below $25k, 72.7% for AGIs $25k-50k)
Percentage of individuals using paid preparers for their 2020 taxes: 92.1%
Here:
92%
State:
92%
(% for various income ranges: 91.7% for AGIs below $25k, 93.8% for AGIs $25k-50k, 88.9% for AGIs $50k-75k, 83.3% for AGIs $75k-100k, 100.0% for AGIs $100k-200k)
Averages for the 2012 tax year for zip code 92086, filed in 2013:
Average Adjusted Gross Income (AGI) in 2012: $40,782 (Individual Income Tax Returns)
Here:
$40,782
State:
$72,726
Salary/wage: $32,651 (reported on 62.5% of returns)
Here:
$32,651
State:
$59,079
(% of AGI for various income ranges: 54.1% for AGIs below $25k, 59.2% for AGIs $25k-50k, 52.6% for AGIs $50k-75k, 53.6% for AGIs $75k-100k, 37.8% for AGIs $100k-200k)
Taxable interest for individuals: $1,055 (reported on 39.3% of returns)
This zip code:
$1,055
California:
$2,146
(% of AGI for various income ranges: 1.1% for AGIs below $25k, 1.2% for AGIs $25k-50k, 0.3% for AGIs $50k-75k, 0.1% for AGIs $75k-100k, 1.8% for AGIs $100k-200k)
Ordinary dividends: $2,433 (reported on 16.1% of returns)
Here:
$2,433
State:
$9,308
(% of AGI for various income ranges: 1.5% for AGIs below $25k, 1.4% for AGIs $50k-75k, 1.5% for AGIs $100k-200k)
Net capital gain/loss in AGI: +$3,529 (reported on 12.5% of returns)
Here:
+$3,529
State:
+$30,460
Profit/loss from business: +$6,836 (reported on 19.6% of returns)
Here:
+$6,836
State:
+$17,064
(% of AGI for various income ranges: 7.3% for AGIs below $25k, 3.1% for AGIs $25k-50k, 7.2% for AGIs $50k-75k)
Taxable individual retirement arrangement distribution: $16,367 (reported on 16.1% of returns)
92086:
$16,367
California:
$19,557
(% of AGI for various income ranges: 7.8% for AGIs below $25k, 7.2% for AGIs $50k-75k, 23.8% for AGIs $75k-100k)
Total itemized deductions: $20,711 (30% of AGI, reported on 32.1% of returns)
Here:
$20,711
State:
$34,004
Here:
29.9% of AGI
State:
22.7% of AGI
(% of AGI for various income ranges: 12.0% for AGIs below $25k, 16.0% for AGIs $25k-50k, 16.0% for AGIs $50k-75k, 21.0% for AGIs $75k-100k, 16.6% for AGIs $100k-200k)
Charity contributions: $2,220 (reported on 26.8% of returns)
Here:
$2,220
State:
$4,659
(% of AGI for various income ranges: 1.1% for AGIs $25k-50k, 2.2% for AGIs $50k-75k, 1.8% for AGIs $75k-100k, 1.7% for AGIs $100k-200k)
Taxes paid: $6,078 (reported on 32.1% of returns)
92086:
$6,078
State:
$14,448
(% of AGI for various income ranges: 2.6% for AGIs below $25k, 4.4% for AGIs $25k-50k, 4.1% for AGIs $50k-75k, 5.9% for AGIs $75k-100k, 6.2% for AGIs $100k-200k)
Earned income credit: $1,709 (reported on 19.6% of returns)
Here:
$1,709
State:
$2,286
(% of AGI for various income ranges: 3.9% for AGIs below $25k, 1.2% for AGIs $25k-50k)
Percentage of individuals using paid preparers for their 2012 taxes: 64.3%
Here:
64%
State:
64%
(% for various income ranges: 55.6% for AGIs below $25k, 66.7% for AGIs $25k-50k, 62.5% for AGIs $50k-75k, 75.0% for AGIs $75k-100k, 100.0% for AGIs $100k-200k)
Averages for the 2004 tax year for zip code 92086, filed in 2005:
Average Adjusted Gross Income (AGI) in 2004: $39,560 (Individual Income Tax Returns)
Here:
$39,560
State:
$58,600
Salary/wage: $33,537 (reported on 69.8% of returns)
Here:
$33,537
State:
$49,455
(% of AGI for various income ranges: 103.3% for AGIs below $10k, 63.2% for AGIs $10k-25k, 63.7% for AGIs $25k-50k, 66.1% for AGIs $50k-75k, 64.4% for AGIs $75k-100k, 42.3% for AGIs over 100k)
Taxable interest for individuals: $1,106 (reported on 48.9% of returns)
This zip code:
$1,106
California:
$2,365
(% of AGI for various income ranges: 9.2% for AGIs below $10k, 1.7% for AGIs $10k-25k, 1.7% for AGIs $25k-50k, 0.8% for AGIs $50k-75k, 1.9% for AGIs $75k-100k, 0.6% for AGIs over 100k)
Taxable dividends: $1,455 (reported on 20.9% of returns)
Here:
$1,455
State:
$4,746
(% of AGI for various income ranges: 10.9% for AGIs below $10k, 1.7% for AGIs $10k-25k, 0.6% for AGIs $25k-50k, 0.7% for AGIs $50k-75k, 0.3% for AGIs $75k-100k, 0.2% for AGIs over 100k)
Net capital gain/loss: +$4,593 (reported on 18.7% of returns)
Here:
+$4,593
State:
+$23,418
(% of AGI for various income ranges: -2.3% for AGIs below $10k, 0.7% for AGIs $10k-25k, 0.6% for AGIs $25k-50k, 0.8% for AGIs $50k-75k, 1.8% for AGIs $75k-100k, 5.8% for AGIs over 100k)
Profit/loss from business: +$5,802 (reported on 17.4% of returns)
Here:
+$5,802
State:
+$16,826
(% of AGI for various income ranges: 8.6% for AGIs below $10k, 5.5% for AGIs $10k-25k, 7.9% for AGIs $25k-50k, -0.9% for AGIs $75k-100k)
Total itemized deductions: $19,330 (32% of AGI, reported on 34.0% of returns)
Here:
$19,330
State:
$28,113
Here:
32.3% of AGI
State:
25.3% of AGI
(% of AGI for various income ranges: 57.4% for AGIs below $10k, 12.3% for AGIs $10k-25k, 17.3% for AGIs $25k-50k, 18.5% for AGIs $50k-75k, 18.9% for AGIs $75k-100k, 13.3% for AGIs over 100k)
Charity contributions deductions: $2,456 (4% of AGI, reported on 27.3% of returns)
Here:
$2,456
State:
$3,923
Here:
3.8% of AGI
State:
3.3% of AGI
(% of AGI for various income ranges: 1.3% for AGIs $10k-25k, 1.8% for AGIs $25k-50k, 1.7% for AGIs $50k-75k, 2.3% for AGIs $75k-100k, 1.6% for AGIs over 100k)
Total tax: $5,211 (reported on 74.4% of returns)
92086:
$5,211
State:
$10,761
(% of AGI for various income ranges: 7.6% for AGIs below $10k, 4.4% for AGIs $10k-25k, 6.3% for AGIs $25k-50k, 9.1% for AGIs $50k-75k, 11.1% for AGIs $75k-100k, 15.6% for AGIs over 100k)
Earned income credit: $1,581 (reported on 12.8% of returns)
Here:
$1,581
State:
$1,763
Percentage of individuals using paid preparers for their 2004 taxes: 71.3%
Here:
71%
State:
66%
(% for various income ranges: 67.3% for AGIs below $10k, 65.7% for AGIs $10k-25k, 76.7% for AGIs $25k-50k, 77.6% for AGIs $50k-75k, 68.3% for AGIs $75k-100k, 80.0% for AGIs over 100k)
Household received Food Stamps/SNAP in the past 12 months: 89 Household did not receive Food Stamps/SNAP in the past 12 months: 472
Women who had a birth in the past 12 months: 14 (9 now married, 5 unmarried) Women who did not have a birth in the past 12 months: 174 (54 now married, 120 unmarried)
Housing units in zip code 92086 with a mortgage: 311 (12 second mortgage, 8 both second mortgage and home equity loan) Houses without a mortgage: 9
Median monthly owner costs for units with a mortgage: $2,361 Median monthly owner costs for units without a mortgage: $622
Residents with income below the poverty level in 2022:
This zip code:
15.5%
Whole state:
12.2%
Residents with income below 50% of the poverty level in 2022:
This zip code:
2.5%
Whole state:
6.2%
Median number of rooms in houses and condos:
Here:
5.3
State:
6.0
Median number of rooms in apartments:
Here:
4.5
State:
3.9
Notable locations in this zip code not listed on our city pages
Notable locations in zip code 92086: Treanor Ranch (A), Inspiration Point (B), Indian Flats Campground (C), Indian Flats Group Campground (D), Oak Grove Campground (E), Mitchell Camp (F), Omaya Ranch (G), Puerta La Cruz (H), Puerta La Cruz Conservation Camp (I), Los Coyotes Reservation Campground (J), Spring Combs Camp (K), Warners Ranch (L), Taylor Ranch (M), Chaney Ranch (N), Chamberlain Ranch (O), Hot Springs Mountain Lookout (P), Butterfield Stage Station (Q), Sunshine Summit Volunteer Fire Department Station 59 (R), California Department of Forestry and Fire Protection Station 52 - Warner Springs (S), United States Forest Service Cleveland National Forest Station Oak Grove (T). Display/hide their locations on the map
Lakes and swamps: Lost Lake (A), Lake Jean (B), Twin Lakes (C), Big Lake (D), Chimney Lake (E), Swan Lake (F), Cooper Cienega (G). Display/hide their locations on the map
Streams, rivers, and creeks: Cañada Buena Vista (A), Agua Caliente Creek (B), Chihuahua Creek (C), San Ysidro Creek (D), Rattlesnake Creek (E). Display/hide their locations on the map
Parks in zip code 92086 include: Camp Wright Historical Marker (1), Boden Field (2), Oak Grove Stage Station Historical Marker (3). Display/hide their locations on the map
In group quarters: 155 (-1 institutionalized population)
Size of family households: 238 2-persons, 84 3-persons, 50 4-persons, 13 5-persons
Size of nonfamily households: 112 1-person, 52 2-persons, 8 4-persons
36 married couples with children.
117 single-parent households (107 men, 10 women).
81.3% of residents of 92086 zip code speak English at home.
9.5% of residents speak Spanish at home (82% very well, 12% well, 3% not well, 3% not at all).
1.9% of residents speak other Indo-European language at home (100% very well).
7.1% of residents speak Asian or Pacific Island language at home (62% very well, 32% well, 6% not well).
0.5% of residents speak other language at home (100% very well).
Foreign born population: 253 (18.2%) (61.5% of them are naturalized citizens)
This zip code:
18.2%
Whole state:
26.7%
26%Honduras
19%Japan
14%Malaysia
6%Sweden
5%Georgia
5%Chile
4%England
14%English
14%German
5%American
3%Dutch
2%French
2%Irish
1%Italian
Year of entry for the foreign-born population
52010 or later
682000 to 2009
341990 to 1999
180Before 1990
Facilities with environmental interests located in this zip code:
LAKE HENSHAW RESORT (1/2 MI N OF RESORT in WARNER SPRINGS, CA)
CRITERIA AND HAZARDOUS AIR POLLUTANT INVENTORY (Inventory of air pollution sources) Business SIC classification: REFUSE SYSTEMS Business NAICS classification: SOLID WASTE LANDFILL.
NORTH ISLAND NAVAL AIR STATION (FASOTRAGRUPAC DET SERE CAMP in WARNER SPRINGS, CA)
SUPERFUND (Superfund database) Alternative names: CLEVELAND NATIONAL FOREST, NAS NORTH ISL CHEM DSPL SITE, NAS NORTH ISLAND BLDG 380, NAVAL AIR STATION NORTH ISLAND, SERE CAMP, UNITED STATES FOREST SERVICE
Housing units lacking complete plumbing facilities: 1.5% Housing units lacking complete kitchen facilities: 1.4%
50.6%Bottled, tank, or LP gas
22.0%Utility gas
17.2%Electricity
7.9%Wood
1.8%Other fuel
0.9%Solar energy
Population in 1990: 780. Population change in the 1990s: +405 (+51.9%).
Place of birth for U.S.-born residents:
This state: 743
Northeast: 62
Midwest: 104
South: 124
West: 55
70% of the 92086 zip code residents lived in the same house 5 years ago. Out of people who lived in different houses, 43% lived in this county. Out of people who lived in different counties, 50% lived in California.
82% of the 92086 zip code residents lived in the same house 1 year ago. Out of people who lived in different houses, 52% moved from this county. Out of people who lived in different houses, 32% moved from different county within same state. Out of people who lived in different houses, 11% moved from different state.
Private vs. public school enrollment:
Students in private schools in grades 1 to 8 (elementary and middle school): 27
Here:
42.3%
California:
10.5%
Students in private schools in grades 9 to 12 (high school): 1
Here:
3.0%
California:
8.5%
Students in private undergraduate colleges: 5
Here:
28.7%
California:
15.9%
Occupation by median earnings in the past 12 months ($)
85,750Management occupations
56,680Fire fighting and prevention, and other protective service workers including supervisors
55,997Office and administrative support occupations
54,681Transportation occupations
47,956Installation, maintenance, and repair occupations
46,592Business and financial operations occupations
Companies with federal contracts located in this zip code:
SKY SAILING, INC (31930 HIGHWAY 79 in WARNER SPRINGS, CA; small business)
$3,000 with Air Force for Other Management Support Services. Signed on 2005-09-10. Completion date: 2005-10-23.
Top industries in this zip code by the number of employees in 2005:
Accommodation and Food Services: Hotels (except Casino Hotels) and Motels (100-249 employees: 1 establishment)
Arts, Entertainment, and Recreation: Fitness and Recreational Sports Centers (20-49: 1)
Accommodation and Food Services: Full-Service Restaurants (20-49: 1)
Health Care and Social Assistance: Homes for the Elderly (10-19: 1)
Construction: New Single-Family Housing Construction (except Operative Builders) (5-9: 1, 1-4: 1)
Construction: Tile and Terrazzo Contractors (1-4: 1)
Other Services (except Public Administration): Beauty Salons (1-4: 1)
Construction: Site Preparation Contractors (1-4: 1)
People in group quarters in 2010:
99 people in state prisons
30 people in residential treatment centers for adults
15 people in workers' group living quarters and job corps centers
5 people in group homes intended for adults
3 people in other noninstitutional facilities
Fatal accident statistics in 2012:
Fatal accident count: 3
Vehicles involved in fatal accidents: 3
Fatal accidents caused by drunken drivers: 2
Fatalities: 3
Persons involved in fatal accidents: 3
Pedestrians involved in fatal accidents: 0
Home Mortgage Disclosure Act Aggregated Statistics For Year 2009 (Based on 4 partial tracts)
A) FHA, FSA/RHS & VA Home Purchase Loans
B) Conventional Home Purchase Loans
C) Refinancings
D) Home Improvement Loans
F) Non-occupant Loans on < 5 Family Dwellings (A B C & D)
G) Loans On Manufactured Home Dwelling (A B C & D)
Number
Average Value
Number
Average Value
Number
Average Value
Number
Average Value
Number
Average Value
Number
Average Value
LOANS ORIGINATED
1
$86,550
6
$175,740
27
$240,614
1
$248,170
9
$192,259
3
$254,650
APPLICATIONS APPROVED, NOT ACCEPTED
1
$242,060
1
$216,740
3
$284,037
0
$0
1
$223,110
1
$336,840
APPLICATIONS DENIED
2
$135,730
3
$244,503
16
$210,724
2
$116,580
7
$218,864
5
$94,564
APPLICATIONS WITHDRAWN
1
$185,420
4
$248,982
8
$312,465
2
$59,320
5
$249,628
3
$170,737
FILES CLOSED FOR INCOMPLETENESS
0
$0
1
$80,930
1
$243,420
0
$0
1
$165,360
1
$158,320
Aggregated Statistics For Year 2008 (Based on 4 partial tracts)
A) FHA, FSA/RHS & VA Home Purchase Loans
B) Conventional Home Purchase Loans
C) Refinancings
D) Home Improvement Loans
E) Loans on Dwellings For 5+ Families
F) Non-occupant Loans on < 5 Family Dwellings (A B C & D)
G) Loans On Manufactured Home Dwelling (A B C & D)
Number
Average Value
Number
Average Value
Number
Average Value
Number
Average Value
Number
Average Value
Number
Average Value
Number
Average Value
LOANS ORIGINATED
1
$410,120
8
$228,201
16
$271,929
2
$112,895
0
$0
5
$277,800
2
$210,550
APPLICATIONS APPROVED, NOT ACCEPTED
0
$0
5
$287,476
3
$272,357
2
$328,530
0
$0
2
$386,280
1
$163,860
APPLICATIONS DENIED
1
$418,630
4
$349,962
22
$234,335
5
$153,192
1
$4,225,920
4
$189,442
12
$174,682
APPLICATIONS WITHDRAWN
0
$0
1
$355,860
10
$267,111
1
$284,290
0
$0
1
$355,030
1
$456,680
FILES CLOSED FOR INCOMPLETENESS
0
$0
3
$454,400
1
$429,420
0
$0
0
$0
1
$170,670
1
$102,480
Aggregated Statistics For Year 2007 (Based on 4 partial tracts)
A) FHA, FSA/RHS & VA Home Purchase Loans
B) Conventional Home Purchase Loans
C) Refinancings
D) Home Improvement Loans
F) Non-occupant Loans on < 5 Family Dwellings (A B C & D)
G) Loans On Manufactured Home Dwelling (A B C & D)
Number
Average Value
Number
Average Value
Number
Average Value
Number
Average Value
Number
Average Value
Number
Average Value
LOANS ORIGINATED
1
$221,900
23
$222,097
38
$234,580
8
$143,621
10
$231,178
20
$154,443
APPLICATIONS APPROVED, NOT ACCEPTED
0
$0
6
$229,513
11
$216,201
1
$297,800
2
$249,480
7
$135,629
APPLICATIONS DENIED
0
$0
13
$293,370
52
$285,491
11
$132,958
6
$382,835
15
$123,363
APPLICATIONS WITHDRAWN
0
$0
4
$279,422
20
$216,237
1
$229,440
2
$253,850
4
$166,710
FILES CLOSED FOR INCOMPLETENESS
0
$0
1
$429,310
3
$379,193
1
$34,200
3
$254,733
2
$139,790
Aggregated Statistics For Year 2006 (Based on 4 partial tracts)
A) FHA, FSA/RHS & VA Home Purchase Loans
B) Conventional Home Purchase Loans
C) Refinancings
D) Home Improvement Loans
F) Non-occupant Loans on < 5 Family Dwellings (A B C & D)
G) Loans On Manufactured Home Dwelling (A B C & D)
Number
Average Value
Number
Average Value
Number
Average Value
Number
Average Value
Number
Average Value
Number
Average Value
LOANS ORIGINATED
5
$263,252
35
$191,489
49
$254,557
7
$163,491
13
$275,283
20
$169,401
APPLICATIONS APPROVED, NOT ACCEPTED
0
$0
4
$208,042
21
$249,409
1
$318,760
3
$350,157
3
$118,890
APPLICATIONS DENIED
0
$0
15
$244,462
66
$245,535
13
$162,438
6
$184,012
17
$188,058
APPLICATIONS WITHDRAWN
1
$261,730
4
$515,355
20
$213,676
5
$94,630
1
$37,350
3
$118,240
FILES CLOSED FOR INCOMPLETENESS
0
$0
5
$195,676
5
$258,834
0
$0
1
$95,700
2
$125,125
Aggregated Statistics For Year 2005 (Based on 4 partial tracts)
A) FHA, FSA/RHS & VA Home Purchase Loans
B) Conventional Home Purchase Loans
C) Refinancings
D) Home Improvement Loans
F) Non-occupant Loans on < 5 Family Dwellings (A B C & D)
G) Loans On Manufactured Home Dwelling (A B C & D)
Number
Average Value
Number
Average Value
Number
Average Value
Number
Average Value
Number
Average Value
Number
Average Value
LOANS ORIGINATED
1
$143,040
53
$197,659
70
$260,074
10
$122,172
16
$217,816
25
$140,199
APPLICATIONS APPROVED, NOT ACCEPTED
0
$0
10
$295,798
17
$172,588
2
$162,065
3
$433,747
4
$145,398
APPLICATIONS DENIED
1
$23,860
29
$240,250
56
$233,016
9
$133,311
9
$203,992
26
$151,628
APPLICATIONS WITHDRAWN
1
$311,490
8
$192,351
47
$238,654
5
$171,594
3
$166,050
12
$119,659
FILES CLOSED FOR INCOMPLETENESS
0
$0
5
$148,080
9
$253,174
1
$170,500
1
$9,110
1
$136,910
Aggregated Statistics For Year 2004 (Based on 4 partial tracts)
A) FHA, FSA/RHS & VA Home Purchase Loans
B) Conventional Home Purchase Loans
C) Refinancings
D) Home Improvement Loans
F) Non-occupant Loans on < 5 Family Dwellings (A B C & D)
G) Loans On Manufactured Home Dwelling (A B C & D)
Number
Average Value
Number
Average Value
Number
Average Value
Number
Average Value
Number
Average Value
Number
Average Value
LOANS ORIGINATED
0
$0
52
$204,250
62
$188,183
8
$170,180
13
$224,342
29
$135,125
APPLICATIONS APPROVED, NOT ACCEPTED
0
$0
9
$189,116
25
$183,344
2
$190,880
4
$154,208
8
$144,634
APPLICATIONS DENIED
1
$82,470
21
$225,724
42
$185,706
6
$134,480
7
$207,560
12
$126,318
APPLICATIONS WITHDRAWN
1
$85,470
8
$165,398
30
$234,605
3
$133,027
1
$228,230
5
$150,442
FILES CLOSED FOR INCOMPLETENESS
0
$0
2
$328,530
5
$240,358
2
$57,595
0
$0
2
$142,145
Aggregated Statistics For Year 2003 (Based on 4 partial tracts)
A) FHA, FSA/RHS & VA Home Purchase Loans
B) Conventional Home Purchase Loans
C) Refinancings
D) Home Improvement Loans
F) Non-occupant Loans on < 5 Family Dwellings (A B C & D)
Number
Average Value
Number
Average Value
Number
Average Value
Number
Average Value
Number
Average Value
LOANS ORIGINATED
3
$190,287
30
$181,347
107
$193,757
1
$38,360
23
$236,202
APPLICATIONS APPROVED, NOT ACCEPTED
1
$196,980
8
$139,795
20
$146,787
1
$17,040
5
$177,336
APPLICATIONS DENIED
1
$160,860
12
$186,536
44
$168,480
2
$10,645
5
$203,430
APPLICATIONS WITHDRAWN
0
$0
8
$191,105
33
$183,566
1
$136,380
2
$188,960
FILES CLOSED FOR INCOMPLETENESS
0
$0
0
$0
3
$204,623
0
$0
0
$0
Aggregated Statistics For Year 1999 (Based on 2 partial tracts)
A) FHA, FSA/RHS & VA Home Purchase Loans
B) Conventional Home Purchase Loans
C) Refinancings
D) Home Improvement Loans
F) Non-occupant Loans on < 5 Family Dwellings (A B C & D)
Detailed PMIC statistics for the following Tracts:0209.03
, 0210.00
2002 - 2018 National Fire Incident Reporting System (NFIRS) incidents
According to the data from the years 2002 - 2018 the average number of fires per year is 8. The highest number of fire incidents - 24 took place in 2011, and the least - 0 in 2003. The data has an increasing trend.
When looking into fire subcategories, the most incidents belonged to: Outside Fires (70.1%), and Mobile Property/Vehicle Fires (15.3%).
Fire incident types reported to NFIRS in Zip Code 92086

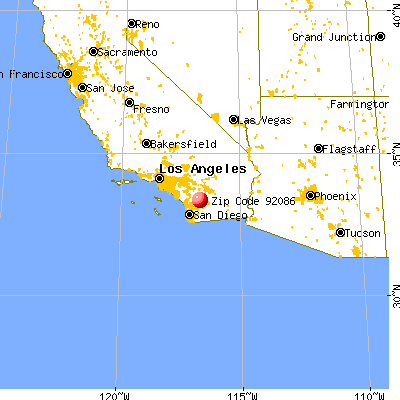


 Nearest zip codes: 92066, 92070, 92060, 92539, 92536, 92061.


 According to the data from the years 2002 - 2018 the average number of fires per year is 8. The highest number of fire incidents - 24 took place in 2011, and the least - 0 in 2003. The data has an increasing trend.
 When looking into fire subcategories, the most incidents belonged to: Outside Fires (70.1%), and Mobile Property/Vehicle Fires (15.3%).