Cities: Phelan, CA (42.48%) ,
Pinon Hills, CA (2.33%) ,
Adelanto, CA (1.08%) ,
Wrightwood, CA (0.09%) ,
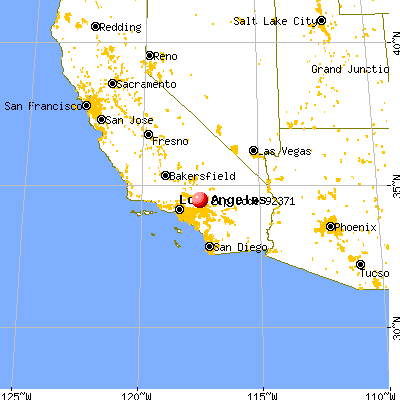
Oak Hills, CA (0.01%) County: San Bernardino County, CA Estimated zip code population in 2022: 21,088
Zip code population in 2010: 16,763
Zip code population in 2000: 12,449
Houses and condos: 6,256
Renter-occupied apartments: 1,451
% of renters here:
25%State:
44%
March 2022 cost of living index in zip code 92371: 74.0
(low, U.S. average is 100)
Land area: 139.7
sq. mi.
Water area: 0.0
sq. mi.
Population density: 151 people per square mile (very low).
OSM Map
General Map
Google Map
MSN Map
OSM Map
General Map
Google Map
MSN Map
OSM Map
General Map
Google Map
MSN Map
OSM Map
General Map
Google Map
MSN Map
Please wait while loading the map...
Real estate property taxes paid for housing units in 2022:
This zip code:
0.7% ($2,512)California:
0.7% ($4,831)
Median real estate property taxes paid for housing units with mortgages in 2022: $2,726 (0.7%)
Median real estate property taxes paid for housing units with no mortgage in 2022: $2,116 (0.8%)
Business Search - 14 Million verified businesses
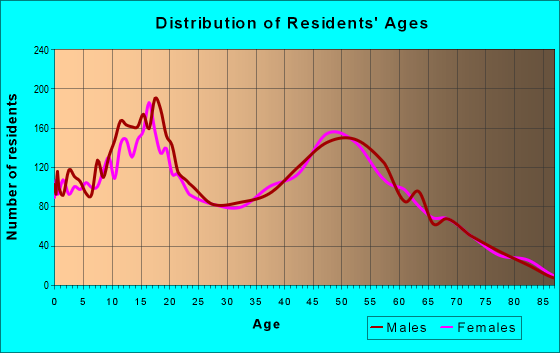
Males: 10,340 Females: 10,747
For population 25 years and over in 92371:
High school or higher: 86.4%Bachelor's degree or higher: 10.3%Graduate or professional degree: 4.2%Unemployed: 10.7%Mean travel time to work (commute): 43.1 minutes
For population 15 years and over in 92371:
Never married: 36.6%Now married: 48.8%Separated: 2.4%Widowed: 2.5%Divorced: 9.8%
Zip code 92371 compared to state average:
Median house value below state average. Unemployed percentage above state average. Black race population percentage significantly below state average. Median age below state average. Foreign-born population percentage significantly below state average. Renting percentage below state average. House age below state average. Percentage of population with a bachelor's degree or higher significantly below state average. 9,908 47.0% Hispanic or Latino 9,419 44.7% White 911 4.3% Two or more races 565 2.7% Asian 134 0.6% Black 96 0.5% Native Hawaiian and Other 37 0.2% Some other race 15 0.07% American Indian
Data:
Median household income ($)
Median household income (% change since 2000)
Household income diversity
Ratio of average income to average house value (%)
Ratio of average income to average rent
Median household income ($) - White
Median household income ($) - Black or African American
Median household income ($) - Asian
Median household income ($) - Hispanic or Latino
Median household income ($) - American Indian and Alaska Native
Median household income ($) - Multirace
Median household income ($) - Other Race
Median household income for houses/condos with a mortgage ($)
Median household income for apartments without a mortgage ($)
Races - White alone (%)
Races - White alone (% change since 2000)
Races - Black alone (%)
Races - Black alone (% change since 2000)
Races - American Indian alone (%)
Races - American Indian alone (% change since 2000)
Races - Asian alone (%)
Races - Asian alone (% change since 2000)
Races - Hispanic (%)
Races - Hispanic (% change since 2000)
Races - Native Hawaiian and Other Pacific Islander alone (%)
Races - Native Hawaiian and Other Pacific Islander alone (% change since 2000)
Races - Two or more races (%)
Races - Two or more races (% change since 2000)
Races - Other race alone (%)
Races - Other race alone (% change since 2000)
Racial diversity
Unemployment (%)
Unemployment (% change since 2000)
Unemployment (%) - White
Unemployment (%) - Black or African American
Unemployment (%) - Asian
Unemployment (%) - Hispanic or Latino
Unemployment (%) - American Indian and Alaska Native
Unemployment (%) - Multirace
Unemployment (%) - Other Race
Population density (people per square mile)
Population - Males (%)
Population - Females (%)
Population - Males (%) - White
Population - Males (%) - Black or African American
Population - Males (%) - Asian
Population - Males (%) - Hispanic or Latino
Population - Males (%) - American Indian and Alaska Native
Population - Males (%) - Multirace
Population - Males (%) - Other Race
Population - Females (%) - White
Population - Females (%) - Black or African American
Population - Females (%) - Asian
Population - Females (%) - Hispanic or Latino
Population - Females (%) - American Indian and Alaska Native
Population - Females (%) - Multirace
Population - Females (%) - Other Race
Coronavirus confirmed cases (May 29, 2024)
Deaths caused by coronavirus (May 29, 2024)
Coronavirus confirmed cases (per 100k population) (May 29, 2024)
Deaths caused by coronavirus (per 100k population) (May 29, 2024)
Daily increase in number of cases (May 29, 2024)
Weekly increase in number of cases (May 29, 2024)
Cases doubled (in days) (May 29, 2024)
Hospitalized patients (Apr 18, 2022)
Negative test results (Apr 18, 2022)
Total test results (Apr 18, 2022)
COVID Vaccine doses distributed (per 100k population) (Sep 19, 2023)
COVID Vaccine doses administered (per 100k population) (Sep 19, 2023)
COVID Vaccine doses distributed (Sep 19, 2023)
COVID Vaccine doses administered (Sep 19, 2023)
Likely homosexual households (%)
Likely homosexual households (% change since 2000)
Likely homosexual households - Lesbian couples (%)
Likely homosexual households - Lesbian couples (% change since 2000)
Likely homosexual households - Gay men (%)
Likely homosexual households - Gay men (% change since 2000)
Cost of living index
Median gross rent ($)
Median contract rent ($)
Median monthly housing costs ($)
Median house or condo value ($)
Median house or condo value ($ change since 2000)
Mean house or condo value by units in structure - 1, detached ($)
Mean house or condo value by units in structure - 1, attached ($)
Mean house or condo value by units in structure - 2 ($)
Mean house or condo value by units in structure by units in structure - 3 or 4 ($)
Mean house or condo value by units in structure - 5 or more ($)
Mean house or condo value by units in structure - Boat, RV, van, etc. ($)
Mean house or condo value by units in structure - Mobile home ($)
Median house or condo value ($) - White
Median house or condo value ($) - Black or African American
Median house or condo value ($) - Asian
Median house or condo value ($) - Hispanic or Latino
Median house or condo value ($) - American Indian and Alaska Native
Median house or condo value ($) - Multirace
Median house or condo value ($) - Other Race
Median resident age
Resident age diversity
Median resident age - Males
Median resident age - Females
Median resident age - White
Median resident age - Black or African American
Median resident age - Asian
Median resident age - Hispanic or Latino
Median resident age - American Indian and Alaska Native
Median resident age - Multirace
Median resident age - Other Race
Median resident age - Males - White
Median resident age - Males - Black or African American
Median resident age - Males - Asian
Median resident age - Males - Hispanic or Latino
Median resident age - Males - American Indian and Alaska Native
Median resident age - Males - Multirace
Median resident age - Males - Other Race
Median resident age - Females - White
Median resident age - Females - Black or African American
Median resident age - Females - Asian
Median resident age - Females - Hispanic or Latino
Median resident age - Females - American Indian and Alaska Native
Median resident age - Females - Multirace
Median resident age - Females - Other Race
Commute - mean travel time to work (minutes)
Travel time to work - Less than 5 minutes (%)
Travel time to work - Less than 5 minutes (% change since 2000)
Travel time to work - 5 to 9 minutes (%)
Travel time to work - 5 to 9 minutes (% change since 2000)
Travel time to work - 10 to 19 minutes (%)
Travel time to work - 10 to 19 minutes (% change since 2000)
Travel time to work - 20 to 29 minutes (%)
Travel time to work - 20 to 29 minutes (% change since 2000)
Travel time to work - 30 to 39 minutes (%)
Travel time to work - 30 to 39 minutes (% change since 2000)
Travel time to work - 40 to 59 minutes (%)
Travel time to work - 40 to 59 minutes (% change since 2000)
Travel time to work - 60 to 89 minutes (%)
Travel time to work - 60 to 89 minutes (% change since 2000)
Travel time to work - 90 or more minutes (%)
Travel time to work - 90 or more minutes (% change since 2000)
Marital status - Never married (%)
Marital status - Now married (%)
Marital status - Separated (%)
Marital status - Widowed (%)
Marital status - Divorced (%)
Median family income ($)
Median family income (% change since 2000)
Median non-family income ($)
Median non-family income (% change since 2000)
Median per capita income ($)
Median per capita income (% change since 2000)
Median family income ($) - White
Median family income ($) - Black or African American
Median family income ($) - Asian
Median family income ($) - Hispanic or Latino
Median family income ($) - American Indian and Alaska Native
Median family income ($) - Multirace
Median family income ($) - Other Race
Median year house/condo built
Median year apartment built
Year house built - Built 2005 or later (%)
Year house built - Built 2000 to 2004 (%)
Year house built - Built 1990 to 1999 (%)
Year house built - Built 1980 to 1989 (%)
Year house built - Built 1970 to 1979 (%)
Year house built - Built 1960 to 1969 (%)
Year house built - Built 1950 to 1959 (%)
Year house built - Built 1940 to 1949 (%)
Year house built - Built 1939 or earlier (%)
Average household size
Household density (households per square mile)
Average household size - White
Average household size - Black or African American
Average household size - Asian
Average household size - Hispanic or Latino
Average household size - American Indian and Alaska Native
Average household size - Multirace
Average household size - Other Race
Occupied housing units (%)
Vacant housing units (%)
Owner occupied housing units (%)
Renter occupied housing units (%)
Vacancy status - For rent (%)
Vacancy status - For sale only (%)
Vacancy status - Rented or sold, not occupied (%)
Vacancy status - For seasonal, recreational, or occasional use (%)
Vacancy status - For migrant workers (%)
Vacancy status - Other vacant (%)
Residents with income below the poverty level (%)
Residents with income below 50% of the poverty level (%)
Children below poverty level (%)
Poor families by family type - Married-couple family (%)
Poor families by family type - Male, no wife present (%)
Poor families by family type - Female, no husband present (%)
Poverty status for native-born residents (%)
Poverty status for foreign-born residents (%)
Poverty among high school graduates not in families (%)
Poverty among people who did not graduate high school not in families (%)
Residents with income below the poverty level (%) - White
Residents with income below the poverty level (%) - Black or African American
Residents with income below the poverty level (%) - Asian
Residents with income below the poverty level (%) - Hispanic or Latino
Residents with income below the poverty level (%) - American Indian and Alaska Native
Residents with income below the poverty level (%) - Multirace
Residents with income below the poverty level (%) - Other Race
Air pollution - Air Quality Index (AQI)
Air pollution - CO
Air pollution - NO2
Air pollution - SO2
Air pollution - Ozone
Air pollution - PM10
Air pollution - PM25
Air pollution - Pb
Crime - Murders per 100,000 population
Crime - Rapes per 100,000 population
Crime - Robberies per 100,000 population
Crime - Assaults per 100,000 population
Crime - Burglaries per 100,000 population
Crime - Thefts per 100,000 population
Crime - Auto thefts per 100,000 population
Crime - Arson per 100,000 population
Crime - City-data.com crime index
Crime - Violent crime index
Crime - Property crime index
Crime - Murders per 100,000 population (5 year average)
Crime - Rapes per 100,000 population (5 year average)
Crime - Robberies per 100,000 population (5 year average)
Crime - Assaults per 100,000 population (5 year average)
Crime - Burglaries per 100,000 population (5 year average)
Crime - Thefts per 100,000 population (5 year average)
Crime - Auto thefts per 100,000 population (5 year average)
Crime - Arson per 100,000 population (5 year average)
Crime - City-data.com crime index (5 year average)
Crime - Violent crime index (5 year average)
Crime - Property crime index (5 year average)
1996 Presidential Elections Results (%) - Democratic Party (Clinton)
1996 Presidential Elections Results (%) - Republican Party (Dole)
1996 Presidential Elections Results (%) - Other
2000 Presidential Elections Results (%) - Democratic Party (Gore)
2000 Presidential Elections Results (%) - Republican Party (Bush)
2000 Presidential Elections Results (%) - Other
2004 Presidential Elections Results (%) - Democratic Party (Kerry)
2004 Presidential Elections Results (%) - Republican Party (Bush)
2004 Presidential Elections Results (%) - Other
2008 Presidential Elections Results (%) - Democratic Party (Obama)
2008 Presidential Elections Results (%) - Republican Party (McCain)
2008 Presidential Elections Results (%) - Other
2012 Presidential Elections Results (%) - Democratic Party (Obama)
2012 Presidential Elections Results (%) - Republican Party (Romney)
2012 Presidential Elections Results (%) - Other
2016 Presidential Elections Results (%) - Democratic Party (Clinton)
2016 Presidential Elections Results (%) - Republican Party (Trump)
2016 Presidential Elections Results (%) - Other
2020 Presidential Elections Results (%) - Democratic Party (Biden)
2020 Presidential Elections Results (%) - Republican Party (Trump)
2020 Presidential Elections Results (%) - Other
Ancestries Reported - Arab (%)
Ancestries Reported - Czech (%)
Ancestries Reported - Danish (%)
Ancestries Reported - Dutch (%)
Ancestries Reported - English (%)
Ancestries Reported - French (%)
Ancestries Reported - French Canadian (%)
Ancestries Reported - German (%)
Ancestries Reported - Greek (%)
Ancestries Reported - Hungarian (%)
Ancestries Reported - Irish (%)
Ancestries Reported - Italian (%)
Ancestries Reported - Lithuanian (%)
Ancestries Reported - Norwegian (%)
Ancestries Reported - Polish (%)
Ancestries Reported - Portuguese (%)
Ancestries Reported - Russian (%)
Ancestries Reported - Scotch-Irish (%)
Ancestries Reported - Scottish (%)
Ancestries Reported - Slovak (%)
Ancestries Reported - Subsaharan African (%)
Ancestries Reported - Swedish (%)
Ancestries Reported - Swiss (%)
Ancestries Reported - Ukrainian (%)
Ancestries Reported - United States (%)
Ancestries Reported - Welsh (%)
Ancestries Reported - West Indian (%)
Ancestries Reported - Other (%)
Educational Attainment - No schooling completed (%)
Educational Attainment - Less than high school (%)
Educational Attainment - High school or equivalent (%)
Educational Attainment - Less than 1 year of college (%)
Educational Attainment - 1 or more years of college (%)
Educational Attainment - Associate degree (%)
Educational Attainment - Bachelor's degree (%)
Educational Attainment - Master's degree (%)
Educational Attainment - Professional school degree (%)
Educational Attainment - Doctorate degree (%)
School Enrollment - Nursery, preschool (%)
School Enrollment - Kindergarten (%)
School Enrollment - Grade 1 to 4 (%)
School Enrollment - Grade 5 to 8 (%)
School Enrollment - Grade 9 to 12 (%)
School Enrollment - College undergrad (%)
School Enrollment - Graduate or professional (%)
School Enrollment - Not enrolled in school (%)
School enrollment - Public schools (%)
School enrollment - Private schools (%)
School enrollment - Not enrolled (%)
Median number of rooms in houses and condos
Median number of rooms in apartments
Housing units lacking complete plumbing facilities (%)
Housing units lacking complete kitchen facilities (%)
Density of houses
Urban houses (%)
Rural houses (%)
Households with people 60 years and over (%)
Households with people 65 years and over (%)
Households with people 75 years and over (%)
Households with one or more nonrelatives (%)
Households with no nonrelatives (%)
Population in households (%)
Family households (%)
Nonfamily households (%)
Population in families (%)
Family households with own children (%)
Median number of bedrooms in owner occupied houses
Mean number of bedrooms in owner occupied houses
Median number of bedrooms in renter occupied houses
Mean number of bedrooms in renter occupied houses
Median number of vehichles in owner occupied houses
Mean number of vehichles in owner occupied houses
Median number of vehichles in renter occupied houses
Mean number of vehichles in renter occupied houses
Mortgage status - with mortgage (%)
Mortgage status - with second mortgage (%)
Mortgage status - with home equity loan (%)
Mortgage status - with both second mortgage and home equity loan (%)
Mortgage status - without a mortgage (%)
Average family size
Average family size - White
Average family size - Black or African American
Average family size - Asian
Average family size - Hispanic or Latino
Average family size - American Indian and Alaska Native
Average family size - Multirace
Average family size - Other Race
Geographical mobility - Same house 1 year ago (%)
Geographical mobility - Moved within same county (%)
Geographical mobility - Moved from different county within same state (%)
Geographical mobility - Moved from different state (%)
Geographical mobility - Moved from abroad (%)
Place of birth - Born in state of residence (%)
Place of birth - Born in other state (%)
Place of birth - Native, outside of US (%)
Place of birth - Foreign born (%)
Housing units in structures - 1, detached (%)
Housing units in structures - 1, attached (%)
Housing units in structures - 2 (%)
Housing units in structures - 3 or 4 (%)
Housing units in structures - 5 to 9 (%)
Housing units in structures - 10 to 19 (%)
Housing units in structures - 20 to 49 (%)
Housing units in structures - 50 or more (%)
Housing units in structures - Mobile home (%)
Housing units in structures - Boat, RV, van, etc. (%)
House/condo owner moved in on average (years ago)
Renter moved in on average (years ago)
Year householder moved into unit - Moved in 1999 to March 2000 (%)
Year householder moved into unit - Moved in 1995 to 1998 (%)
Year householder moved into unit - Moved in 1990 to 1994 (%)
Year householder moved into unit - Moved in 1980 to 1989 (%)
Year householder moved into unit - Moved in 1970 to 1979 (%)
Year householder moved into unit - Moved in 1969 or earlier (%)
Means of transportation to work - Drove car alone (%)
Means of transportation to work - Carpooled (%)
Means of transportation to work - Public transportation (%)
Means of transportation to work - Bus or trolley bus (%)
Means of transportation to work - Streetcar or trolley car (%)
Means of transportation to work - Subway or elevated (%)
Means of transportation to work - Railroad (%)
Means of transportation to work - Ferryboat (%)
Means of transportation to work - Taxicab (%)
Means of transportation to work - Motorcycle (%)
Means of transportation to work - Bicycle (%)
Means of transportation to work - Walked (%)
Means of transportation to work - Other means (%)
Working at home (%)
Industry diversity
Most Common Industries - Agriculture, forestry, fishing and hunting, and mining (%)
Most Common Industries - Agriculture, forestry, fishing and hunting (%)
Most Common Industries - Mining, quarrying, and oil and gas extraction (%)
Most Common Industries - Construction (%)
Most Common Industries - Manufacturing (%)
Most Common Industries - Wholesale trade (%)
Most Common Industries - Retail trade (%)
Most Common Industries - Transportation and warehousing, and utilities (%)
Most Common Industries - Transportation and warehousing (%)
Most Common Industries - Utilities (%)
Most Common Industries - Information (%)
Most Common Industries - Finance and insurance, and real estate and rental and leasing (%)
Most Common Industries - Finance and insurance (%)
Most Common Industries - Real estate and rental and leasing (%)
Most Common Industries - Professional, scientific, and management, and administrative and waste management services (%)
Most Common Industries - Professional, scientific, and technical services (%)
Most Common Industries - Management of companies and enterprises (%)
Most Common Industries - Administrative and support and waste management services (%)
Most Common Industries - Educational services, and health care and social assistance (%)
Most Common Industries - Educational services (%)
Most Common Industries - Health care and social assistance (%)
Most Common Industries - Arts, entertainment, and recreation, and accommodation and food services (%)
Most Common Industries - Arts, entertainment, and recreation (%)
Most Common Industries - Accommodation and food services (%)
Most Common Industries - Other services, except public administration (%)
Most Common Industries - Public administration (%)
Occupation diversity
Most Common Occupations - Management, business, science, and arts occupations (%)
Most Common Occupations - Management, business, and financial occupations (%)
Most Common Occupations - Management occupations (%)
Most Common Occupations - Business and financial operations occupations (%)
Most Common Occupations - Computer, engineering, and science occupations (%)
Most Common Occupations - Computer and mathematical occupations (%)
Most Common Occupations - Architecture and engineering occupations (%)
Most Common Occupations - Life, physical, and social science occupations (%)
Most Common Occupations - Education, legal, community service, arts, and media occupations (%)
Most Common Occupations - Community and social service occupations (%)
Most Common Occupations - Legal occupations (%)
Most Common Occupations - Education, training, and library occupations (%)
Most Common Occupations - Arts, design, entertainment, sports, and media occupations (%)
Most Common Occupations - Healthcare practitioners and technical occupations (%)
Most Common Occupations - Health diagnosing and treating practitioners and other technical occupations (%)
Most Common Occupations - Health technologists and technicians (%)
Most Common Occupations - Service occupations (%)
Most Common Occupations - Healthcare support occupations (%)
Most Common Occupations - Protective service occupations (%)
Most Common Occupations - Fire fighting and prevention, and other protective service workers including supervisors (%)
Most Common Occupations - Law enforcement workers including supervisors (%)
Most Common Occupations - Food preparation and serving related occupations (%)
Most Common Occupations - Building and grounds cleaning and maintenance occupations (%)
Most Common Occupations - Personal care and service occupations (%)
Most Common Occupations - Sales and office occupations (%)
Most Common Occupations - Sales and related occupations (%)
Most Common Occupations - Office and administrative support occupations (%)
Most Common Occupations - Natural resources, construction, and maintenance occupations (%)
Most Common Occupations - Farming, fishing, and forestry occupations (%)
Most Common Occupations - Construction and extraction occupations (%)
Most Common Occupations - Installation, maintenance, and repair occupations (%)
Most Common Occupations - Production, transportation, and material moving occupations (%)
Most Common Occupations - Production occupations (%)
Most Common Occupations - Transportation occupations (%)
Most Common Occupations - Material moving occupations (%)
People in Group quarters - Institutionalized population (%)
People in Group quarters - Correctional institutions (%)
People in Group quarters - Federal prisons and detention centers (%)
People in Group quarters - Halfway houses (%)
People in Group quarters - Local jails and other confinement facilities (including police lockups) (%)
People in Group quarters - Military disciplinary barracks (%)
People in Group quarters - State prisons (%)
People in Group quarters - Other types of correctional institutions (%)
People in Group quarters - Nursing homes (%)
People in Group quarters - Hospitals/wards, hospices, and schools for the handicapped (%)
People in Group quarters - Hospitals/wards and hospices for chronically ill (%)
People in Group quarters - Hospices or homes for chronically ill (%)
People in Group quarters - Military hospitals or wards for chronically ill (%)
People in Group quarters - Other hospitals or wards for chronically ill (%)
People in Group quarters - Hospitals or wards for drug/alcohol abuse (%)
People in Group quarters - Mental (Psychiatric) hospitals or wards (%)
People in Group quarters - Schools, hospitals, or wards for the mentally retarded (%)
People in Group quarters - Schools, hospitals, or wards for the physically handicapped (%)
People in Group quarters - Institutions for the deaf (%)
People in Group quarters - Institutions for the blind (%)
People in Group quarters - Orthopedic wards and institutions for the physically handicapped (%)
People in Group quarters - Wards in general hospitals for patients who have no usual home elsewhere (%)
People in Group quarters - Wards in military hospitals for patients who have no usual home elsewhere (%)
People in Group quarters - Juvenile institutions (%)
People in Group quarters - Long-term care (%)
People in Group quarters - Homes for abused, dependent, and neglected children (%)
People in Group quarters - Residential treatment centers for emotionally disturbed children (%)
People in Group quarters - Training schools for juvenile delinquents (%)
People in Group quarters - Short-term care, detention or diagnostic centers for delinquent children (%)
People in Group quarters - Type of juvenile institution unknown (%)
People in Group quarters - Noninstitutionalized population (%)
People in Group quarters - College dormitories (includes college quarters off campus) (%)
People in Group quarters - Military quarters (%)
People in Group quarters - On base (%)
People in Group quarters - Barracks, unaccompanied personnel housing (UPH), (Enlisted/Officer), ;and similar group living quarters for military personnel (%)
People in Group quarters - Transient quarters for temporary residents (%)
People in Group quarters - Military ships (%)
People in Group quarters - Group homes (%)
People in Group quarters - Homes or halfway houses for drug/alcohol abuse (%)
People in Group quarters - Homes for the mentally ill (%)
People in Group quarters - Homes for the mentally retarded (%)
People in Group quarters - Homes for the physically handicapped (%)
People in Group quarters - Other group homes (%)
People in Group quarters - Religious group quarters (%)
People in Group quarters - Dormitories (%)
People in Group quarters - Agriculture workers' dormitories on farms (%)
People in Group quarters - Job Corps and vocational training facilities (%)
People in Group quarters - Other workers' dormitories (%)
People in Group quarters - Crews of maritime vessels (%)
People in Group quarters - Other nonhousehold living situations (%)
People in Group quarters - Other noninstitutional group quarters (%)
Residents speaking English at home (%)
Residents speaking English at home - Born in the United States (%)
Residents speaking English at home - Native, born elsewhere (%)
Residents speaking English at home - Foreign born (%)
Residents speaking Spanish at home (%)
Residents speaking Spanish at home - Born in the United States (%)
Residents speaking Spanish at home - Native, born elsewhere (%)
Residents speaking Spanish at home - Foreign born (%)
Residents speaking other language at home (%)
Residents speaking other language at home - Born in the United States (%)
Residents speaking other language at home - Native, born elsewhere (%)
Residents speaking other language at home - Foreign born (%)
Class of Workers - Employee of private company (%)
Class of Workers - Self-employed in own incorporated business (%)
Class of Workers - Private not-for-profit wage and salary workers (%)
Class of Workers - Local government workers (%)
Class of Workers - State government workers (%)
Class of Workers - Federal government workers (%)
Class of Workers - Self-employed workers in own not incorporated business and Unpaid family workers (%)
House heating fuel used in houses and condos - Utility gas (%)
House heating fuel used in houses and condos - Bottled, tank, or LP gas (%)
House heating fuel used in houses and condos - Electricity (%)
House heating fuel used in houses and condos - Fuel oil, kerosene, etc. (%)
House heating fuel used in houses and condos - Coal or coke (%)
House heating fuel used in houses and condos - Wood (%)
House heating fuel used in houses and condos - Solar energy (%)
House heating fuel used in houses and condos - Other fuel (%)
House heating fuel used in houses and condos - No fuel used (%)
House heating fuel used in apartments - Utility gas (%)
House heating fuel used in apartments - Bottled, tank, or LP gas (%)
House heating fuel used in apartments - Electricity (%)
House heating fuel used in apartments - Fuel oil, kerosene, etc. (%)
House heating fuel used in apartments - Coal or coke (%)
House heating fuel used in apartments - Wood (%)
House heating fuel used in apartments - Solar energy (%)
House heating fuel used in apartments - Other fuel (%)
House heating fuel used in apartments - No fuel used (%)
Armed forces status - In Armed Forces (%)
Armed forces status - Civilian (%)
Armed forces status - Civilian - Veteran (%)
Armed forces status - Civilian - Nonveteran (%)
Fatal accidents locations in years 2005-2021
Fatal accidents locations in 2005
Fatal accidents locations in 2006
Fatal accidents locations in 2007
Fatal accidents locations in 2008
Fatal accidents locations in 2009
Fatal accidents locations in 2010
Fatal accidents locations in 2011
Fatal accidents locations in 2012
Fatal accidents locations in 2013
Fatal accidents locations in 2014
Fatal accidents locations in 2015
Fatal accidents locations in 2016
Fatal accidents locations in 2017
Fatal accidents locations in 2018
Fatal accidents locations in 2019
Fatal accidents locations in 2020
Fatal accidents locations in 2021
Alcohol use - People drinking some alcohol every month (%)
Alcohol use - People not drinking at all (%)
Alcohol use - Average days/month drinking alcohol
Alcohol use - Average drinks/week
Alcohol use - Average days/year people drink much
Audiometry - Average condition of hearing (%)
Audiometry - People that can hear a whisper from across a quiet room (%)
Audiometry - People that can hear normal voice from across a quiet room (%)
Audiometry - Ears ringing, roaring, buzzing (%)
Audiometry - Had a job exposure to loud noise (%)
Audiometry - Had off-work exposure to loud noise (%)
Blood Pressure & Cholesterol - Has high blood pressure (%)
Blood Pressure & Cholesterol - Checking blood pressure at home (%)
Blood Pressure & Cholesterol - Frequently checking blood cholesterol (%)
Blood Pressure & Cholesterol - Has high cholesterol level (%)
Consumer Behavior - Money monthly spent on food at supermarket/grocery store
Consumer Behavior - Money monthly spent on food at other stores
Consumer Behavior - Money monthly spent on eating out
Consumer Behavior - Money monthly spent on carryout/delivered foods
Consumer Behavior - Income spent on food at supermarket/grocery store (%)
Consumer Behavior - Income spent on food at other stores (%)
Consumer Behavior - Income spent on eating out (%)
Consumer Behavior - Income spent on carryout/delivered foods (%)
Current Health Status - General health condition (%)
Current Health Status - Blood donors (%)
Current Health Status - Has blood ever tested for HIV virus (%)
Current Health Status - Left-handed people (%)
Dermatology - People using sunscreen (%)
Diabetes - Diabetics (%)
Diabetes - Had a blood test for high blood sugar (%)
Diabetes - People taking insulin (%)
Diet Behavior & Nutrition - Diet health (%)
Diet Behavior & Nutrition - Milk product consumption (# of products/month)
Diet Behavior & Nutrition - Meals not home prepared (#/week)
Diet Behavior & Nutrition - Meals from fast food or pizza place (#/week)
Diet Behavior & Nutrition - Ready-to-eat foods (#/month)
Diet Behavior & Nutrition - Frozen meals/pizza (#/month)
Drug Use - People that ever used marijuana or hashish (%)
Drug Use - Ever used hard drugs (%)
Drug Use - Ever used any form of cocaine (%)
Drug Use - Ever used heroin (%)
Drug Use - Ever used methamphetamine (%)
Health Insurance - People covered by health insurance (%)
Kidney Conditions-Urology - Avg. # of times urinating at night
Medical Conditions - People with asthma (%)
Medical Conditions - People with anemia (%)
Medical Conditions - People with psoriasis (%)
Medical Conditions - People with overweight (%)
Medical Conditions - Elderly people having difficulties in thinking or remembering (%)
Medical Conditions - People who ever received blood transfusion (%)
Medical Conditions - People having trouble seeing even with glass/contacts (%)
Medical Conditions - People with arthritis (%)
Medical Conditions - People with gout (%)
Medical Conditions - People with congestive heart failure (%)
Medical Conditions - People with coronary heart disease (%)
Medical Conditions - People with angina pectoris (%)
Medical Conditions - People who ever had heart attack (%)
Medical Conditions - People who ever had stroke (%)
Medical Conditions - People with emphysema (%)
Medical Conditions - People with thyroid problem (%)
Medical Conditions - People with chronic bronchitis (%)
Medical Conditions - People with any liver condition (%)
Medical Conditions - People who ever had cancer or malignancy (%)
Mental Health - People who have little interest in doing things (%)
Mental Health - People feeling down, depressed, or hopeless (%)
Mental Health - People who have trouble sleeping or sleeping too much (%)
Mental Health - People feeling tired or having little energy (%)
Mental Health - People with poor appetite or overeating (%)
Mental Health - People feeling bad about themself (%)
Mental Health - People who have trouble concentrating on things (%)
Mental Health - People moving or speaking slowly or too fast (%)
Mental Health - People having thoughts they would be better off dead (%)
Oral Health - Average years since last visit a dentist
Oral Health - People embarrassed because of mouth (%)
Oral Health - People with gum disease (%)
Oral Health - General health of teeth and gums (%)
Oral Health - Average days a week using dental floss/device
Oral Health - Average days a week using mouthwash for dental problem
Oral Health - Average number of teeth
Pesticide Use - Households using pesticides to control insects (%)
Pesticide Use - Households using pesticides to kill weeds (%)
Physical Activity - People doing vigorous-intensity work activities (%)
Physical Activity - People doing moderate-intensity work activities (%)
Physical Activity - People walking or bicycling (%)
Physical Activity - People doing vigorous-intensity recreational activities (%)
Physical Activity - People doing moderate-intensity recreational activities (%)
Physical Activity - Average hours a day doing sedentary activities
Physical Activity - Average hours a day watching TV or videos
Physical Activity - Average hours a day using computer
Physical Functioning - People having limitations keeping them from working (%)
Physical Functioning - People limited in amount of work they can do (%)
Physical Functioning - People that need special equipment to walk (%)
Physical Functioning - People experiencing confusion/memory problems (%)
Physical Functioning - People requiring special healthcare equipment (%)
Prescription Medications - Average number of prescription medicines taking
Preventive Aspirin Use - Adults 40+ taking low-dose aspirin (%)
Reproductive Health - Vaginal deliveries (%)
Reproductive Health - Cesarean deliveries (%)
Reproductive Health - Deliveries resulted in a live birth (%)
Reproductive Health - Pregnancies resulted in a delivery (%)
Reproductive Health - Women breastfeeding newborns (%)
Reproductive Health - Women that had a hysterectomy (%)
Reproductive Health - Women that had both ovaries removed (%)
Reproductive Health - Women that have ever taken birth control pills (%)
Reproductive Health - Women taking birth control pills (%)
Reproductive Health - Women that have ever used Depo-Provera or injectables (%)
Reproductive Health - Women that have ever used female hormones (%)
Sexual Behavior - People 18+ that ever had sex (vaginal, anal, or oral) (%)
Sexual Behavior - Males 18+ that ever had vaginal sex with a woman (%)
Sexual Behavior - Males 18+ that ever performed oral sex on a woman (%)
Sexual Behavior - Males 18+ that ever had anal sex with a woman (%)
Sexual Behavior - Males 18+ that ever had any sex with a man (%)
Sexual Behavior - Females 18+ that ever had vaginal sex with a man (%)
Sexual Behavior - Females 18+ that ever performed oral sex on a man (%)
Sexual Behavior - Females 18+ that ever had anal sex with a man (%)
Sexual Behavior - Females 18+ that ever had any kind of sex with a woman (%)
Sexual Behavior - Average age people first had sex
Sexual Behavior - Average number of female sex partners in lifetime (males 18+)
Sexual Behavior - Average number of female vaginal sex partners in lifetime (males 18+)
Sexual Behavior - Average age people first performed oral sex on a woman (18+)
Sexual Behavior - Average number of woman performed oral sex on in lifetime (18+)
Sexual Behavior - Average number of male sex partners in lifetime (males 18+)
Sexual Behavior - Average number of male anal sex partners in lifetime (males 18+)
Sexual Behavior - Average age people first performed oral sex on a man (18+)
Sexual Behavior - Average number of male oral sex partners in lifetime (18+)
Sexual Behavior - People using protection when performing oral sex (%)
Sexual Behavior - Average number of times people have vaginal or anal sex a year
Sexual Behavior - People having sex without condom (%)
Sexual Behavior - Average number of male sex partners in lifetime (females 18+)
Sexual Behavior - Average number of male vaginal sex partners in lifetime (females 18+)
Sexual Behavior - Average number of female sex partners in lifetime (females 18+)
Sexual Behavior - Circumcised males 18+ (%)
Sleep Disorders - Average hours sleeping at night
Sleep Disorders - People that has trouble sleeping (%)
Smoking-Cigarette Use - People smoking cigarettes (%)
Taste & Smell - People 40+ having problems with smell (%)
Taste & Smell - People 40+ having problems with taste (%)
Taste & Smell - People 40+ that ever had wisdom teeth removed (%)
Taste & Smell - People 40+ that ever had tonsils teeth removed (%)
Taste & Smell - People 40+ that ever had a loss of consciousness because of a head injury (%)
Taste & Smell - People 40+ that ever had a broken nose or other serious injury to face or skull (%)
Taste & Smell - People 40+ that ever had two or more sinus infections (%)
Weight - Average height (inches)
Weight - Average weight (pounds)
Weight - Average BMI
Weight - People that are obese (%)
Weight - People that ever were obese (%)
Weight - People trying to lose weight (%)
Urban population: 108
Rural population: 20,979
Estimated median house/condo value in 2022: $359,199
92371:
$359,199California:
$715,900
Median resident age: This zip code:
32.2 yearsCalifornia median age:
37.9 years
Average household size: This zip code:
3.6 peopleCalifornia:
2.8 people
Averages for the 2020 tax year for zip code 92371, filed in 2021:
Average Adjusted Gross Income (AGI) in 2020: $49,991 (Individual Income Tax Returns) Here:
$49,991State:
$95,910
Salary/wage: $48,741 (reported on 79.1% of returns )Here:
$48,741State:
$77,331
(% of AGI for various income ranges: 1025.8% for AGIs below $25k , 3528.6% for AGIs $25k-50k , 6859.8% for AGIs $50k-75k , 10513.9% for AGIs $75k-100k , 19157.7% for AGIs $100k-200k , 43116.7% for AGIs over 200k ) Taxable interest for individuals: $343 (reported on 26.8% of returns )This zip code:
$343California:
$2,294
(% of AGI for various income ranges: 6.8% for AGIs below $25k , 7.6% for AGIs $25k-50k , 17.9% for AGIs $50k-75k , 17.9% for AGIs $75k-100k , 32.0% for AGIs $100k-200k , 116.7% for AGIs over 200k ) Ordinary dividends: $1,674 (reported on 6.6% of returns )(% of AGI for various income ranges: 2.4% for AGIs below $25k , 11.6% for AGIs $25k-50k , 37.1% for AGIs $50k-75k , 12.9% for AGIs $75k-100k , 50.7% for AGIs $100k-200k ) Net capital gain/loss in AGI: +$9,105 (reported on 7.9% of returns )Here:
+$9,105State:
+$49,306
(% of AGI for various income ranges: 2.1% for AGIs below $25k , 23.8% for AGIs $25k-50k , 78.1% for AGIs $50k-75k , 35.4% for AGIs $75k-100k , 230.7% for AGIs $100k-200k , 6420.0% for AGIs over 200k ) Profit/loss from business: +$9,839 (reported on 20.4% of returns )Here:
+$9,839State:
+$15,671
(% of AGI for various income ranges: 240.8% for AGIs below $25k , 307.0% for AGIs $25k-50k , 341.0% for AGIs $50k-75k , 206.4% for AGIs $75k-100k , 380.0% for AGIs $100k-200k ) Taxable individual retirement arrangement distribution: $14,977 (reported on 2.8% of returns )92371:
$14,977California:
$23,505
(% of AGI for various income ranges: 15.9% for AGIs below $25k , 20.2% for AGIs $25k-50k , 116.5% for AGIs $50k-75k , 316.0% for AGIs $100k-200k ) Total itemized deductions: $27,953 (reported on 9.6% of returns )Here:
$27,953State:
$39,517
(% of AGI for various income ranges: 32.0% for AGIs below $25k , 148.5% for AGIs $25k-50k , 410.2% for AGIs $50k-75k , 821.1% for AGIs $75k-100k , 1565.7% for AGIs $100k-200k , 5560.0% for AGIs over 200k ) Charity contributions: $6,611 (reported on 7.4% of returns )(% of AGI for various income ranges: 17.5% for AGIs $25k-50k , 53.8% for AGIs $50k-75k , 110.7% for AGIs $75k-100k , 334.0% for AGIs $100k-200k , 1870.0% for AGIs over 200k ) Taxes paid: $7,876 (reported on 9.6% of returns )(% of AGI for various income ranges: 51.8% for AGIs $25k-50k , 120.2% for AGIs $50k-75k , 240.0% for AGIs $75k-100k , 472.3% for AGIs $100k-200k , 1176.7% for AGIs over 200k ) Earned income credit: $2,414 (reported on 22.3% of returns )(% of AGI for various income ranges: 122.0% for AGIs below $25k , 103.2% for AGIs $25k-50k ) Percentage of individuals using paid preparers for their 2020 taxes: 93.6%(% for various income ranges: 91.6% for AGIs below $25k , 94.1% for AGIs $25k-50k , 94.5% for AGIs $50k-75k , 97.5% for AGIs $75k-100k , 94.3% for AGIs $100k-200k , 100.0% for AGIs over 200k )
Averages for the 2012 tax year for zip code 92371, filed in 2013:
Average Adjusted Gross Income (AGI) in 2012: $43,516 (Individual Income Tax Returns) Here:
$43,516State:
$72,726
Salary/wage: $43,216 (reported on 79.7% of returns )Here:
$43,216State:
$59,079
(% of AGI for various income ranges: 62.9% for AGIs below $25k , 78.0% for AGIs $25k-50k , 81.6% for AGIs $50k-75k , 85.4% for AGIs $75k-100k , 81.9% for AGIs $100k-200k , 76.7% for AGIs over 200k ) Taxable interest for individuals: $432 (reported on 30.2% of returns )This zip code:
$432California:
$2,146
(% of AGI for various income ranges: 0.6% for AGIs below $25k , 0.3% for AGIs $25k-50k , 0.2% for AGIs $50k-75k , 0.4% for AGIs $75k-100k , 0.3% for AGIs $100k-200k ) Ordinary dividends: $1,371 (reported on 6.8% of returns )(% of AGI for various income ranges: 0.1% for AGIs below $25k , 0.4% for AGIs $25k-50k , 0.2% for AGIs $50k-75k , 0.3% for AGIs $100k-200k ) Net capital gain/loss in AGI: +$3,248 (reported on 6.5% of returns )Here:
+$3,248State:
+$30,460
(% of AGI for various income ranges: 0.2% for AGIs $25k-50k , 0.3% for AGIs $50k-75k , 1.7% for AGIs $100k-200k ) Profit/loss from business: +$8,979 (reported on 21.2% of returns )Here:
+$8,979State:
+$17,064
(% of AGI for various income ranges: 19.9% for AGIs below $25k , 6.3% for AGIs $25k-50k , 1.1% for AGIs $50k-75k , 0.6% for AGIs $75k-100k , 1.6% for AGIs $100k-200k ) Taxable individual retirement arrangement distribution: $12,571 (reported on 4.8% of returns )92371:
$12,571California:
$19,557
(% of AGI for various income ranges: 1.7% for AGIs below $25k , 1.0% for AGIs $25k-50k , 2.5% for AGIs $50k-75k , 1.9% for AGIs $100k-200k ) Total itemized deductions: $22,086 (29% of AGI, reported on 34.7% of returns )Here:
$22,086State:
$34,004
Here:
28.6% of AGIState:
22.7% of AGI
(% of AGI for various income ranges: 9.0% for AGIs below $25k , 15.4% for AGIs $25k-50k , 17.4% for AGIs $50k-75k , 20.5% for AGIs $75k-100k , 21.5% for AGIs $100k-200k , 18.0% for AGIs over 200k ) Charity contributions: $2,774 (reported on 27.1% of returns )(% of AGI for various income ranges: 0.5% for AGIs below $25k , 1.4% for AGIs $25k-50k , 1.5% for AGIs $50k-75k , 1.7% for AGIs $75k-100k , 2.9% for AGIs $100k-200k , 1.1% for AGIs over 200k ) Taxes paid: $6,024 (reported on 34.7% of returns )92371:
$6,024State:
$14,448
(% of AGI for various income ranges: 1.6% for AGIs below $25k , 3.0% for AGIs $25k-50k , 4.3% for AGIs $50k-75k , 5.7% for AGIs $75k-100k , 6.8% for AGIs $100k-200k , 8.4% for AGIs over 200k ) Earned income credit: $2,482 (reported on 27.4% of returns )(% of AGI for various income ranges: 10.3% for AGIs below $25k , 1.7% for AGIs $25k-50k ) Percentage of individuals using paid preparers for their 2012 taxes: 65.8%(% for various income ranges: 61.3% for AGIs below $25k , 65.9% for AGIs $25k-50k , 69.8% for AGIs $50k-75k , 73.3% for AGIs $75k-100k , 71.0% for AGIs $100k-200k , 100.0% for AGIs over 200k )
Averages for the 2004 tax year for zip code 92371, filed in 2005:
Average Adjusted Gross Income (AGI) in 2004: $40,183 (Individual Income Tax Returns) Here:
$40,183State:
$58,600
Salary/wage: $39,741 (reported on 83.7% of returns )Here:
$39,741State:
$49,455
(% of AGI for various income ranges: 136.3% for AGIs below $10k , 71.6% for AGIs $10k-25k , 80.3% for AGIs $25k-50k , 89.2% for AGIs $50k-75k , 89.7% for AGIs $75k-100k , 74.6% for AGIs over 100k ) Taxable interest for individuals: $497 (reported on 37.5% of returns )This zip code:
$497California:
$2,365
(% of AGI for various income ranges: 3.1% for AGIs below $10k , 0.7% for AGIs $10k-25k , 0.6% for AGIs $25k-50k , 0.3% for AGIs $50k-75k , 0.3% for AGIs $75k-100k , 0.2% for AGIs over 100k ) Taxable dividends: $601 (reported on 9.6% of returns )(% of AGI for various income ranges: 0.8% for AGIs below $10k , 0.4% for AGIs $10k-25k , 0.1% for AGIs $25k-50k , 0.1% for AGIs $50k-75k , 0.0% for AGIs $75k-100k , 0.2% for AGIs over 100k ) Net capital gain/loss: +$15,154 (reported on 10.0% of returns )Here:
+$15,154State:
+$23,418
(% of AGI for various income ranges: -1.0% for AGIs below $10k , 0.9% for AGIs $10k-25k , 0.9% for AGIs $25k-50k , 1.0% for AGIs $50k-75k , 1.3% for AGIs $75k-100k , 13.5% for AGIs over 100k ) Profit/loss from business: +$9,380 (reported on 20.3% of returns )Here:
+$9,380State:
+$16,826
(% of AGI for various income ranges: 5.0% for AGIs below $10k , 12.0% for AGIs $10k-25k , 7.2% for AGIs $25k-50k , 2.8% for AGIs $50k-75k , 2.8% for AGIs $75k-100k , 2.6% for AGIs over 100k ) IRA payment deduction: $2,429 (reported on 1.3% of returns )92371:
$2,429California:
$3,192
Self-employed pension: $18,200 (reported on 0.4% of returns )Here:
$18,200California:
$17,688
Total itemized deductions: $19,584 (30% of AGI, reported on 42.8% of returns )Here:
$19,584State:
$28,113
Here:
29.6% of AGIState:
25.3% of AGI
(% of AGI for various income ranges: 25.6% for AGIs below $10k , 13.0% for AGIs $10k-25k , 19.3% for AGIs $25k-50k , 23.2% for AGIs $50k-75k , 24.5% for AGIs $75k-100k , 20.2% for AGIs over 100k ) Charity contributions deductions: $2,644 (4% of AGI, reported on 36.1% of returns )Here:
3.8% of AGIState:
3.3% of AGI
(% of AGI for various income ranges: 1.2% for AGIs below $10k , 0.8% for AGIs $10k-25k , 1.8% for AGIs $25k-50k , 2.3% for AGIs $50k-75k , 3.2% for AGIs $75k-100k , 3.2% for AGIs over 100k ) Total tax: $4,619 (reported on 71.7% of returns )92371:
$4,619State:
$10,761
(% of AGI for various income ranges: 5.8% for AGIs below $10k , 4.6% for AGIs $10k-25k , 5.8% for AGIs $25k-50k , 7.1% for AGIs $50k-75k , 8.5% for AGIs $75k-100k , 13.8% for AGIs over 100k ) Earned income credit: $1,775 (reported on 19.9% of returns )Percentage of individuals using paid preparers for their 2004 taxes: 68.5%(% for various income ranges: 57.3% for AGIs below $10k , 68.1% for AGIs $10k-25k , 71.2% for AGIs $25k-50k , 71.1% for AGIs $50k-75k , 73.9% for AGIs $75k-100k , 78.3% for AGIs over 100k )
Estimated median household income in 2022: This zip code:
$73,127California:
$91,551
Nearest zip codes: 92372 ,
92397 ,
92392 ,
92344 ,
92301 ,
92358 .
Wrightwood Zip Code Map
Percentage of family households: This zip code:
59.4%California:
46.8%
Percentage of households with unmarried partners: This zip code:
4.8%California:
48.1%
No gay or lesbian households reported
Household received Food Stamps/SNAP in the past 12 months: 1,333Household did not receive Food Stamps/SNAP in the past 12 months: 4,681
Women who had a birth in the past 12 months: 396 (285 now married , 110 unmarried) Women who did not have a birth in the past 12 months: 4,636 (1,823 now married , 2,814 unmarried)
Housing units in zip code 92371 with a mortgage: 3,157 (238
second mortgage , 22
home equity loan , 100
both second mortgage and home equity loan )
Median monthly owner costs for units with a mortgage: $1,753
Median monthly owner costs for units without a mortgage: $577
Residents with income below the poverty level in 2022:
This zip code:
15.8%Whole state:
12.2%
Residents with income below 50% of the poverty level in 2022:
This zip code:
7.3%Whole state:
6.2%
Median number of rooms in houses and condos: Median number of rooms in apartments: Notable locations in this zip code not listed on our city pages
Click to draw/clear zip code borders Notable locations in zip code 92371: (A) , Horse Target Shooting Area (B) , Johnson Ranch (C) , Patterson Ranch (D) , Goss Ranch (E) , Buttemer Ranch (F) , Nuss Ranch (G) , Prudhon Ranch (H) , Warner Ranch (I) , White Ranch (J) , Wilson Ranch (K) , Yucca Forest Ranch (L) , Warner Ranch (M) , Cajon Summit Lookout (N) , San Bernardino County Fire Department Station 10 Phelan (O) , California Department of Forestry and Fire Protection Station 10 Phelan (P) . Display/hide their locations on the map
Shopping Center: (1) . Display/hide its location on the map
Park in zip code 92371: (1) . Display/hide its location on the map
Year house built (houses)
0 2020 or later132 2010 to 20191,871 2000 to 20091,117 1990 to 19991,853 1980 to 1989903 1970 to 197977 1960 to 1969142 1950 to 195920 1940 to 194999 1939 or earlier
Zip code 92371 household income distribution in 2022 258 Less than $10,000100 $10,000 to $14,999243 $15,000 to $19,999209 $20,000 to $24,999369 $25,000 to $29,999141 $30,000 to $34,999122 $35,000 to $39,999353 $40,000 to $44,999235 $45,000 to $49,999573 $50,000 to $59,999466 $60,000 to $74,999800 $75,000 to $99,999579 $100,000 to $124,999596 $125,000 to $149,999388 $150,000 to $199,999422 $200,000 or moreEstimate of home value of owner-occupied houses/condos in 2022 in zip code 92371 107 Less than $10,00033 $10,000 to $14,99941 $15,000 to $19,99922 $20,000 to $24,99943 $25,000 to $29,99936 $30,000 to $34,999111 $35,000 to $39,99972 $50,000 to $59,99943 $60,000 to $69,99910 $80,000 to $89,99947 $100,000 to $124,999159 $125,000 to $149,999101 $150,000 to $174,99928 $175,000 to $199,999318 $200,000 to $249,999254 $250,000 to $299,9991,076 $300,000 to $399,999670 $400,000 to $499,999446 $500,000 to $749,99946 $750,000 to $999,99920 $1,000,000 to $1,499,99962 $2,000,000 or moreRent paid by renters in 2022 in zip code 92371 77 $450 to $4991 $500 to $54921 $550 to $59911 $600 to $64921 $750 to $79997 $800 to $89958 $900 to $999344 $1,000 to $1,249301 $1,250 to $1,499159 $1,500 to $1,99943 $2,000 to $2,499254 No cash rent
Median gross rent in 2022: $1,506.
Median price asked for vacant for-sale houses and condos in 2022: $1,661,816.
Estimated median house (or condo) value in 2022 for: White Non-Hispanic householders: $442,951American Indian or Alaska Native householders: $586,631Asian householders: $419,847Native Hawaiian and other Pacific Islander householders: $406,129Some other race householders: $389,523Two or more races householders: $317,683Hispanic or Latino householders: $466,777Estimated median house or condo value in 2022: $359,199
92371:
$359,199California:
$715,900
Lower value quartile - upper value quartile: $237,214 - $467,035
Mean price in 2022: Detached houses: $317,867Here:
$317,867State:
$988,808
Mobile homes: $186,873Here:
$186,873State:
$184,506
Housing units in structures:
One, detached: 4,381One, attached: 323 or 4: 4520 to 49: 21Mobile homes: 1,732Unemployment : 10.7%
Means of transportation to work in zip code 92371 74.4% 5,759 Drove a car alone8.4% 647 Carpooled0.9% 70 Walked3.8% 298 Other means12.0% 933 Worked at homeTravel time to work (commute) in zip code 92371 139 Less than 5 minutes448 5 to 9 minutes420 10 to 14 minutes96 15 to 19 minutes422 20 to 24 minutes296 25 to 29 minutes1,042 30 to 34 minutes248 35 to 39 minutes385 40 to 44 minutes1,221 45 to 59 minutes1,196 60 to 89 minutes795 90 or more minutes
Percentage of zip code residents living and working in this county: 85.8%
Household type by relationship:
Households: 21,088
Male householders: 3,015 (398 living alone ), Female householders: 2,876 (389 living alone )3,245 spouses (3,245 opposite-sex spouses ), 757 unmarried partners , (757 opposite-sex unmarried partners ), 7,217 children (6,805 natural , 195 adopted , 217 stepchildren ), 1,037 grandchildren , 545 brothers or sisters , 436 parents , 0 foster children , 1,206 other relatives , 553 non-relatives In group quarters: 129 (-1 institutionalized population )
Size of family households: 1,601 2-persons , 503 3-persons , 1,031 4-persons , 847 5-persons , 352 6-persons , 429 7-or-more-persons
Size of nonfamily households: 786 1-person , 266 2-persons , 28 3-persons , 3 6-persons
3,127 married couples with children. single-parent households (297 men , 1,601 women ).
70.4% of residents of 92371 zip code speak English at home. of residents speak Spanish at home (73% very well, 11% well, 10% not well, 6% not at all ).of residents speak other Indo-European language at home (92% very well, 8% well ).of residents speak Asian or Pacific Island language at home (16% very well, 47% well, 37% not well ).of residents speak other language at home (100% well ).
Foreign born population: 2,298 (10.9%)
(53.4%
of them are naturalized citizens )
This zip code:
10.9%Whole state:
26.7%
68% Honduras 15% Japan 4% Saudi Arabia 3% Costa Rica 2% Malaysia 2% Poland 2% Thailand 9% American 5% Irish 4% English 4% German 3% Italian 3% European 1% Dutch
Year of entry for the foreign-born population
495 2010 or later 313 2000 to 2009 555 1990 to 1999 993 Before 1990
Facilities with environmental interests located in this zip code:
HERITAGE (9542 WILSON RANCH ROAD in PHELAN, CA)
(National Center for Education Statistics) - STATE ID-6112924 Organizations: SNOWLINE JOINT UNIFIED (SCHOOL DISTRICT)
Housing units lacking complete plumbing facilities: 1.9%
Housing units lacking complete kitchen facilities: 2.3%
44.0% Bottled, tank, or LP gas 19.5% Wood 14.3% Utility gas 12.4% Electricity 8.2% Other fuel 1.6% No fuel used
Population in 1990: 13,508.
Place of birth for U.S.-born residents:
This state: 16,557Northeast: 353Midwest: 504South: 704West: 616
56% of the 92371 zip code residents lived in the same house 5 years ago.
Out of people who lived in different houses, 69% lived in this county.
Out of people who lived in different counties, 50% lived in California.
89% of the 92371 zip code residents lived in the same house 1 year ago.
Out of people who lived in different houses, 53% moved from this county.
Out of people who lived in different houses, 45% moved from different county within same state.
Private vs. public school enrollment:
Students in private schools in grades 1 to 8 (elementary and middle school): 224
Here:
8.3%California:
10.5%
Students in private schools in grades 9 to 12 (high school): 179
Here:
12.8%California:
8.5%
Students in private undergraduate colleges: 349
Here:
35.1%California:
15.9%
Occupation by median earnings in the past 12 months ($)
110,608 Architecture and engineering occupations 85,082 Business and financial operations occupations 74,603 Management occupations 72,014 Fire fighting and prevention, and other protective service workers including supervisors 68,047 Arts, design, entertainment, sports, and media occupations 64,671 Production occupations
Top industries in this zip code by the number of employees in 2005:
Accommodation and Food Services: Limited-Service Restaurants (50-99 employees: 2 establishments, 20-49 employees: 2 establishments, 10-19 employees: 1 establishment, 5-9 employees: 2 establishments, 1-4 employees: 1 establishment)Accommodation and Food Services: Full-Service Restaurants (10-19: 3, 1-4: 3)Construction: All Other Specialty Trade Contractors (20-49: 1, 1-4: 2)Construction: New Single-Family Housing Construction (except Operative Builders) (10-19: 1, 5-9: 2, 1-4: 3)Construction: Structural Steel and Precast Concrete Contractors (20-49: 1)Construction: Commercial and Institutional Building Construction (10-19: 1, 5-9: 1)Construction: Site Preparation Contractors (5-9: 2, 1-4: 3)
People in group quarters in 2010:
37 people in emergency and transitional shelters (with sleeping facilities) for people experiencing homelessness
5 people in other noninstitutional facilities
People in group quarters in 2000:
15 people in other group homes
Fatal accident statistics in 2014:
Fatal accident count: 6Vehicles involved in fatal accidents: 10Fatal accidents caused by drunken drivers: 1Fatalities: 6Persons involved in fatal accidents: 13Pedestrians involved in fatal accidents: 2
Fatal accident statistics in 2013:
Fatal accident count: 6Vehicles involved in fatal accidents: 12Fatal accidents caused by drunken drivers: 1Fatalities: 6Persons involved in fatal accidents: 19Pedestrians involved in fatal accidents: 2
Home Mortgage Disclosure Act Aggregated Statistics For Year 2009(Based on 2 full and 8 partial tracts) A) FHA, FSA/RHS & VA B) Conventional C) Refinancings D) Home Improvement Loans F) Non-occupant Loans on G) Loans On Manufactured Number Average Value Number Average Value Number Average Value Number Average Value Number Average Value Number Average Value
LOANS ORIGINATED 843 $148,460 342 $120,959 495 $180,125 22 $85,162 182 $103,369 98 $133,487 APPLICATIONS APPROVED, NOT ACCEPTED 60 $158,326 50 $125,453 100 $172,544 3 $146,617 24 $109,704 21 $119,343 APPLICATIONS DENIED 178 $149,348 101 $121,177 331 $190,844 46 $69,553 67 $111,942 51 $109,942 APPLICATIONS WITHDRAWN 116 $146,670 57 $111,958 184 $180,527 18 $80,110 40 $98,940 39 $139,454 FILES CLOSED FOR INCOMPLETENESS 37 $159,274 20 $124,962 32 $195,826 3 $215,360 8 $113,388 2 $52,940
Aggregated Statistics For Year 2008(Based on 2 full and 8 partial tracts) A) FHA, FSA/RHS & VA B) Conventional C) Refinancings D) Home Improvement Loans F) Non-occupant Loans on G) Loans On Manufactured Number Average Value Number Average Value Number Average Value Number Average Value Number Average Value Number Average Value
LOANS ORIGINATED 600 $204,833 489 $186,181 551 $200,170 80 $118,332 167 $165,726 161 $149,655 APPLICATIONS APPROVED, NOT ACCEPTED 61 $220,766 114 $193,936 198 $238,000 19 $72,473 32 $209,042 63 $141,290 APPLICATIONS DENIED 151 $212,232 200 $219,553 898 $244,230 155 $115,840 115 $215,640 177 $147,801 APPLICATIONS WITHDRAWN 75 $207,515 124 $193,476 265 $231,276 38 $111,817 45 $188,530 49 $124,158 FILES CLOSED FOR INCOMPLETENESS 29 $206,449 34 $220,994 68 $251,086 8 $139,036 16 $216,516 6 $118,985
Aggregated Statistics For Year 2007(Based on 2 full and 8 partial tracts) A) FHA, FSA/RHS & VA B) Conventional C) Refinancings D) Home Improvement Loans E) Loans on Dwellings For 5+ Families F) Non-occupant Loans on G) Loans On Manufactured Number Average Value Number Average Value Number Average Value Number Average Value Number Average Value Number Average Value Number Average Value
LOANS ORIGINATED 100 $241,566 1,154 $229,026 1,828 $228,940 306 $129,366 1 $1,722,440 283 $230,493 443 $156,990 APPLICATIONS APPROVED, NOT ACCEPTED 15 $194,057 370 $223,195 578 $249,211 83 $123,453 0 $0 67 $226,064 86 $153,726 APPLICATIONS DENIED 25 $277,937 741 $248,632 1,765 $260,696 425 $144,319 0 $0 197 $233,777 355 $159,522 APPLICATIONS WITHDRAWN 19 $215,777 289 $233,703 590 $252,054 109 $165,061 0 $0 63 $245,496 75 $131,119 FILES CLOSED FOR INCOMPLETENESS 6 $218,077 98 $241,121 289 $273,776 20 $168,664 0 $0 33 $258,726 30 $184,302
Aggregated Statistics For Year 2006(Based on 2 full and 8 partial tracts) A) FHA, FSA/RHS & VA B) Conventional C) Refinancings D) Home Improvement Loans E) Loans on Dwellings For 5+ Families F) Non-occupant Loans on G) Loans On Manufactured Number Average Value Number Average Value Number Average Value Number Average Value Number Average Value Number Average Value Number Average Value
LOANS ORIGINATED 114 $235,402 2,970 $205,999 2,817 $227,261 527 $121,951 2 $1,700,775 411 $210,598 570 $158,053 APPLICATIONS APPROVED, NOT ACCEPTED 3 $217,517 548 $210,217 572 $238,803 103 $123,739 0 $0 106 $213,191 100 $145,583 APPLICATIONS DENIED 22 $226,099 1,199 $207,167 1,818 $242,616 498 $126,066 1 $230,690 242 $219,767 386 $154,818 APPLICATIONS WITHDRAWN 17 $210,119 773 $209,912 1,169 $243,119 194 $162,372 0 $0 124 $209,550 119 $149,819 FILES CLOSED FOR INCOMPLETENESS 3 $181,490 132 $211,200 247 $220,527 21 $153,330 0 $0 21 $220,097 35 $151,198
Aggregated Statistics For Year 2005(Based on 2 full and 8 partial tracts) A) FHA, FSA/RHS & VA B) Conventional C) Refinancings D) Home Improvement Loans E) Loans on Dwellings For 5+ Families F) Non-occupant Loans on G) Loans On Manufactured Number Average Value Number Average Value Number Average Value Number Average Value Number Average Value Number Average Value Number Average Value
LOANS ORIGINATED 133 $197,286 2,691 $184,440 3,216 $196,451 500 $123,512 2 $843,315 505 $184,490 593 $138,511 APPLICATIONS APPROVED, NOT ACCEPTED 15 $160,913 523 $184,043 534 $205,471 73 $102,451 0 $0 93 $182,598 110 $116,033 APPLICATIONS DENIED 48 $190,317 888 $181,854 1,834 $197,374 415 $112,031 0 $0 183 $185,455 422 $129,770 APPLICATIONS WITHDRAWN 15 $224,298 730 $191,078 1,446 $196,191 198 $151,594 0 $0 125 $173,454 203 $130,052 FILES CLOSED FOR INCOMPLETENESS 8 $177,114 109 $182,712 394 $186,666 19 $78,156 0 $0 22 $174,145 62 $124,415
Aggregated Statistics For Year 2004(Based on 2 full and 8 partial tracts) A) FHA, FSA/RHS & VA B) Conventional C) Refinancings D) Home Improvement Loans E) Loans on Dwellings For 5+ Families F) Non-occupant Loans on G) Loans On Manufactured Number Average Value Number Average Value Number Average Value Number Average Value Number Average Value Number Average Value Number Average Value
LOANS ORIGINATED 319 $155,714 2,164 $148,191 2,947 $157,426 442 $93,976 3 $845,293 367 $138,221 597 $110,898 APPLICATIONS APPROVED, NOT ACCEPTED 14 $140,354 464 $150,426 668 $155,376 79 $93,986 0 $0 93 $140,303 195 $114,138 APPLICATIONS DENIED 40 $149,014 626 $150,846 1,622 $146,025 372 $73,958 1 $435,590 150 $135,416 358 $104,430 APPLICATIONS WITHDRAWN 66 $151,028 493 $156,816 1,301 $156,051 154 $88,953 0 $0 94 $141,758 148 $109,291 FILES CLOSED FOR INCOMPLETENESS 10 $168,786 92 $149,941 271 $157,844 53 $98,910 0 $0 24 $115,447 20 $120,062
Aggregated Statistics For Year 2003(Based on 2 full and 8 partial tracts) A) FHA, FSA/RHS & VA B) Conventional C) Refinancings D) Home Improvement Loans E) Loans on Dwellings For 5+ Families F) Non-occupant Loans on Number Average Value Number Average Value Number Average Value Number Average Value Number Average Value Number Average Value
LOANS ORIGINATED 433 $131,190 1,281 $117,126 2,706 $120,923 112 $48,623 2 $606,070 243 $106,746 APPLICATIONS APPROVED, NOT ACCEPTED 23 $149,421 242 $121,241 522 $125,305 31 $50,922 0 $0 52 $111,647 APPLICATIONS DENIED 47 $136,344 302 $114,397 1,292 $115,596 146 $39,018 0 $0 77 $112,254 APPLICATIONS WITHDRAWN 44 $144,590 181 $114,550 1,077 $127,037 38 $63,070 0 $0 48 $129,519 FILES CLOSED FOR INCOMPLETENESS 22 $124,545 45 $117,559 184 $126,376 9 $36,278 0 $0 12 $95,504
Aggregated Statistics For Year 2002(Based on 4 partial tracts) A) FHA, FSA/RHS & VA B) Conventional C) Refinancings D) Home Improvement Loans F) Non-occupant Loans on Number Average Value Number Average Value Number Average Value Number Average Value Number Average Value
LOANS ORIGINATED 65 $103,592 179 $107,639 281 $120,034 11 $34,948 54 $98,906 APPLICATIONS APPROVED, NOT ACCEPTED 4 $102,488 20 $110,498 69 $117,623 6 $28,532 9 $93,983 APPLICATIONS DENIED 10 $113,115 38 $99,548 157 $106,924 19 $32,046 14 $87,814 APPLICATIONS WITHDRAWN 9 $110,681 23 $109,870 100 $112,709 6 $25,677 7 $112,453 FILES CLOSED FOR INCOMPLETENESS 4 $103,555 10 $117,213 36 $112,071 1 $60,610 4 $88,442
Aggregated Statistics For Year 2001(Based on 4 partial tracts) A) FHA, FSA/RHS & VA B) Conventional C) Refinancings D) Home Improvement Loans F) Non-occupant Loans on Number Average Value Number Average Value Number Average Value Number Average Value Number Average Value
LOANS ORIGINATED 60 $96,142 116 $106,262 165 $111,259 7 $21,693 38 $88,037 APPLICATIONS APPROVED, NOT ACCEPTED 2 $131,270 15 $137,277 37 $104,975 3 $30,900 7 $87,070 APPLICATIONS DENIED 9 $106,101 32 $99,011 130 $87,858 14 $23,196 12 $87,291 APPLICATIONS WITHDRAWN 6 $81,615 19 $99,731 74 $104,298 5 $32,218 8 $107,201 FILES CLOSED FOR INCOMPLETENESS 1 $150,980 2 $149,375 19 $113,402 0 $0 2 $122,250
Aggregated Statistics For Year 2000(Based on 4 partial tracts) A) FHA, FSA/RHS & VA B) Conventional C) Refinancings D) Home Improvement Loans E) Loans on Dwellings For 5+ Families F) Non-occupant Loans on Number Average Value Number Average Value Number Average Value Number Average Value Number Average Value Number Average Value
LOANS ORIGINATED 62 $80,428 83 $100,727 43 $88,951 14 $31,369 1 $92,650 20 $70,714 APPLICATIONS APPROVED, NOT ACCEPTED 4 $75,472 10 $118,501 14 $101,999 15 $29,571 0 $0 3 $53,677 APPLICATIONS DENIED 6 $74,208 25 $85,784 63 $70,970 28 $23,014 0 $0 8 $64,001 APPLICATIONS WITHDRAWN 6 $101,267 15 $78,166 26 $65,610 4 $19,675 0 $0 4 $65,200 FILES CLOSED FOR INCOMPLETENESS 2 $77,345 3 $91,847 11 $119,337 1 $11,320 0 $0 1 $41,640
Aggregated Statistics For Year 1999(Based on 3 partial tracts) A) FHA, FSA/RHS & VA B) Conventional C) Refinancings D) Home Improvement Loans E) Loans on Dwellings For 5+ Families F) Non-occupant Loans on Number Average Value Number Average Value Number Average Value Number Average Value Number Average Value Number Average Value
LOANS ORIGINATED 162 $91,920 156 $86,061 280 $95,626 50 $27,042 4 $143,075 42 $72,140 APPLICATIONS APPROVED, NOT ACCEPTED 9 $102,891 17 $91,294 68 $84,713 29 $27,154 1 $68,780 9 $78,304 APPLICATIONS DENIED 18 $102,063 57 $81,189 248 $80,220 66 $21,097 3 $89,280 17 $57,708 APPLICATIONS WITHDRAWN 19 $105,997 23 $90,904 122 $87,149 6 $38,373 1 $71,860 8 $68,515 FILES CLOSED FOR INCOMPLETENESS 2 $73,055 5 $91,584 46 $95,657 1 $48,020 0 $0 1 $32,480
Private Mortgage Insurance Companies Aggregated Statistics For Year 2009(Based on 2 full and 8 partial tracts) A) Conventional B) Refinancings C) Non-occupant Loans on Number Average Value Number Average Value Number Average Value
LOANS ORIGINATED 30 $153,234 5 $208,822 1 $223,320 APPLICATIONS APPROVED, NOT ACCEPTED 26 $174,065 3 $305,890 2 $182,915 APPLICATIONS DENIED 7 $160,327 0 $0 0 $0 APPLICATIONS WITHDRAWN 2 $131,155 0 $0 0 $0 FILES CLOSED FOR INCOMPLETENESS 6 $215,887 0 $0 0 $0
Aggregated Statistics For Year 2008(Based on 2 full and 8 partial tracts) A) Conventional B) Refinancings C) Non-occupant Loans on D) Loans On Manufactured Number Average Value Number Average Value Number Average Value Number Average Value
LOANS ORIGINATED 182 $235,138 49 $286,958 11 $201,740 0 $0 APPLICATIONS APPROVED, NOT ACCEPTED 149 $288,671 67 $299,337 11 $245,055 2 $232,975 APPLICATIONS DENIED 35 $230,605 12 $322,018 9 $196,837 0 $0 APPLICATIONS WITHDRAWN 14 $233,136 1 $375,590 3 $236,510 0 $0 FILES CLOSED FOR INCOMPLETENESS 6 $179,877 3 $274,040 3 $186,363 0 $0
Aggregated Statistics For Year 2007(Based on 2 full and 8 partial tracts) A) Conventional B) Refinancings C) Non-occupant Loans on D) Loans On Manufactured Number Average Value Number Average Value Number Average Value Number Average Value
LOANS ORIGINATED 190 $295,660 110 $312,025 22 $306,894 16 $188,628 APPLICATIONS APPROVED, NOT ACCEPTED 39 $323,559 46 $326,417 4 $284,018 5 $198,606 APPLICATIONS DENIED 15 $258,151 8 $334,992 1 $347,490 1 $200,840 APPLICATIONS WITHDRAWN 12 $312,439 11 $368,399 1 $337,200 0 $0 FILES CLOSED FOR INCOMPLETENESS 1 $427,070 0 $0 0 $0 0 $0
Aggregated Statistics For Year 2006(Based on 2 full and 8 partial tracts) A) Conventional B) Refinancings C) Non-occupant Loans on D) Loans On Manufactured Number Average Value Number Average Value Number Average Value Number Average Value
LOANS ORIGINATED 91 $279,091 45 $318,617 9 $304,263 25 $210,337 APPLICATIONS APPROVED, NOT ACCEPTED 32 $274,522 35 $312,339 5 $206,412 10 $206,338 APPLICATIONS DENIED 6 $313,765 10 $372,354 2 $378,820 0 $0 APPLICATIONS WITHDRAWN 9 $271,400 14 $344,904 1 $291,150 0 $0 FILES CLOSED FOR INCOMPLETENESS 2 $152,985 0 $0 2 $152,985 2 $152,985
Aggregated Statistics For Year 2005(Based on 2 full and 8 partial tracts) A) Conventional B) Refinancings C) Non-occupant Loans on D) Loans On Manufactured Number Average Value Number Average Value Number Average Value Number Average Value
LOANS ORIGINATED 139 $241,263 53 $247,906 19 $248,456 25 $182,972 APPLICATIONS APPROVED, NOT ACCEPTED 36 $213,703 36 $271,115 8 $170,960 2 $177,910 APPLICATIONS DENIED 7 $274,556 0 $0 3 $258,937 0 $0 APPLICATIONS WITHDRAWN 11 $191,193 5 $253,226 5 $167,022 4 $115,988 FILES CLOSED FOR INCOMPLETENESS 1 $218,080 2 $177,350 0 $0 0 $0
Aggregated Statistics For Year 2004(Based on 2 full and 8 partial tracts) A) Conventional B) Refinancings C) Non-occupant Loans on D) Loans On Manufactured Number Average Value Number Average Value Number Average Value Number Average Value
LOANS ORIGINATED 218 $186,949 112 $185,872 55 $163,215 18 $124,619 APPLICATIONS APPROVED, NOT ACCEPTED 74 $177,200 68 $176,888 13 $150,878 2 $74,520 APPLICATIONS DENIED 3 $134,120 1 $166,070 0 $0 0 $0 APPLICATIONS WITHDRAWN 11 $125,873 4 $139,660 3 $133,250 0 $0 FILES CLOSED FOR INCOMPLETENESS 3 $151,100 3 $164,567 0 $0 0 $0
Aggregated Statistics For Year 2003(Based on 2 full and 8 partial tracts) A) Conventional B) Refinancings C) Non-occupant Loans on Number Average Value Number Average Value Number Average Value
LOANS ORIGINATED 276 $150,243 288 $140,334 42 $113,742 APPLICATIONS APPROVED, NOT ACCEPTED 39 $133,125 84 $145,905 10 $108,594 APPLICATIONS DENIED 3 $137,440 8 $106,841 5 $95,418 APPLICATIONS WITHDRAWN 3 $144,780 4 $123,568 0 $0 FILES CLOSED FOR INCOMPLETENESS 0 $0 1 $160,380 0 $0
Aggregated Statistics For Year 2002(Based on 4 partial tracts) A) Conventional B) Refinancings C) Non-occupant Loans on Number Average Value Number Average Value Number Average Value
LOANS ORIGINATED 41 $126,136 30 $129,840 6 $97,063 APPLICATIONS APPROVED, NOT ACCEPTED 6 $141,353 10 $115,006 2 $142,180 APPLICATIONS DENIED 0 $0 0 $0 1 $58,300 APPLICATIONS WITHDRAWN 1 $119,920 2 $110,075 0 $0 FILES CLOSED FOR INCOMPLETENESS 0 $0 0 $0 0 $0
Aggregated Statistics For Year 2001(Based on 4 partial tracts) A) Conventional B) Refinancings C) Non-occupant Loans on Number Average Value Number Average Value Number Average Value
LOANS ORIGINATED 36 $124,960 17 $125,775 5 $74,786 APPLICATIONS APPROVED, NOT ACCEPTED 7 $114,767 6 $97,602 3 $76,763 APPLICATIONS DENIED 2 $74,870 2 $125,980 1 $99,140 APPLICATIONS WITHDRAWN 1 $127,120 2 $131,200 1 $127,370 FILES CLOSED FOR INCOMPLETENESS 1 $66,340 0 $0 0 $0
Aggregated Statistics For Year 2000(Based on 4 partial tracts) A) Conventional B) Refinancings C) Non-occupant Loans on Number Average Value Number Average Value Number Average Value
LOANS ORIGINATED 26 $107,997 5 $97,722 6 $63,520 APPLICATIONS APPROVED, NOT ACCEPTED 2 $88,095 3 $102,430 1 $91,920 APPLICATIONS DENIED 2 $69,540 0 $0 1 $69,540 APPLICATIONS WITHDRAWN 0 $0 0 $0 0 $0 FILES CLOSED FOR INCOMPLETENESS 0 $0 0 $0 0 $0
Aggregated Statistics For Year 1999(Based on 3 partial tracts) A) Conventional B) Refinancings C) Non-occupant Loans on Number Average Value Number Average Value Number Average Value
LOANS ORIGINATED 50 $108,782 37 $120,425 6 $91,495 APPLICATIONS APPROVED, NOT ACCEPTED 5 $100,584 6 $118,247 0 $0 APPLICATIONS DENIED 3 $89,443 2 $153,965 2 $64,965 APPLICATIONS WITHDRAWN 1 $72,770 2 $130,000 0 $0 FILES CLOSED FOR INCOMPLETENESS 0 $0 2 $74,730 0 $0
2005 - 2018 National Fire Incident Reporting System (NFIRS) incidents See full 2006 National Fire Incident Reporting System statistics for zip code 92371, California
Most common first names in zip code 92371 among deceased individuals Name Count Lived (average)
Robert 36 65.2 years John 27 69.7 years William 24 70.5 years Mary 17 77.5 years James 17 65.9 years Charles 15 67.5 years Donald 12 71.9 years Margaret 12 78.4 years Frank 12 76.8 years Dorothy 11 71.0 years
Most common last names in zip code 92371 among deceased individuals Last name Count Lived (average)
Johnson 10 77.1 years Jones 9 71.9 years Williams 8 75.9 years Smith 8 78.1 years Walker 7 75.5 years Miller 6 66.4 years Wilson 6 83.2 years Lee 6 73.8 years Cox 5 84.0 years Hill 5 91.6 years
Businesses in zip code 92371
Name Count Name Count
AutoZone 1 Nike 2 Best Western 1 Pizza Hut 1 Circle K 2 RadioShack 1 FedEx 1 Rite Aid 1 GNC 1 T-Mobile 1 H&R Block 1 Taco Bell 1 KFC 1 True Value 1 Little Caesars Pizza 1 U-Haul 1 McDonald's 2 UPS 1


 Nearest zip codes: 92372, 92397, 92392, 92344, 92301, 92358.


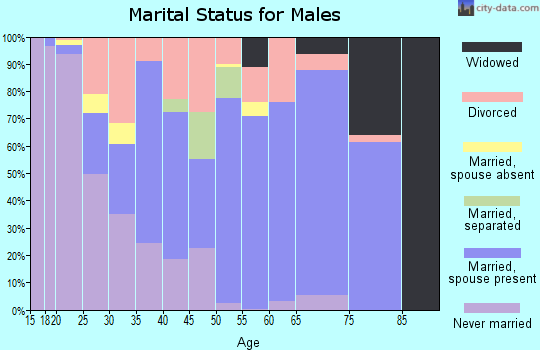
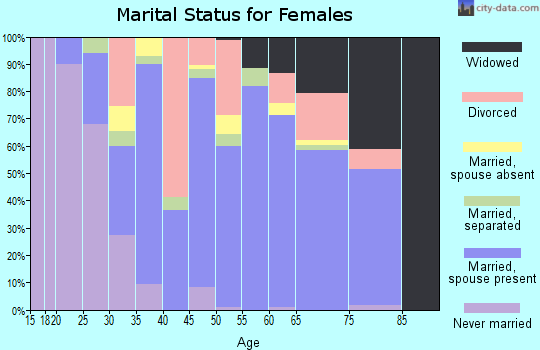


 According to the data from the years 2005 - 2018 the average number of fires per year is 53. The highest number of fire incidents - 116 took place in 2018, and the least - 5 in 2006. The data has a growing trend.
 When looking into fire subcategories, the most incidents belonged to: Outside Fires (71.1%), and Structure Fires (12.8%).