Estimated zip code population in 2022: 80,958 Zip code population in 2010: 72,492 Zip code population in 2000: 46,167
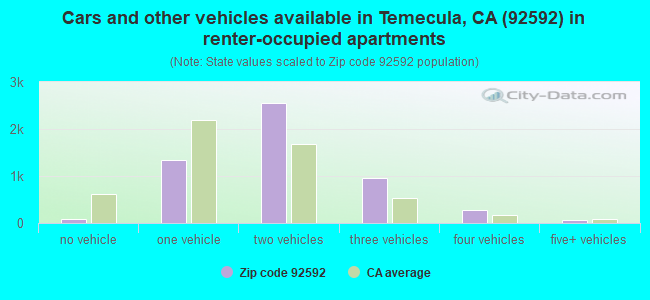
Houses and condos: 26,140 Renter-occupied apartments: 5,313
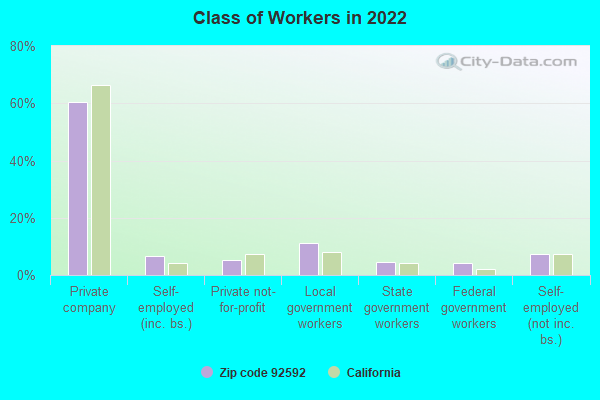
% of renters here:
21%
State:
44%
March 2022 cost of living index in zip code 92592: 82.7 (low, U.S. average is 100)
Land area: 97.2 sq. mi. Water area: 1.3 sq. mi.
Population density: 833 people per square mile
(low).
OSM Map
General Map
Google Map
MSN Map
OSM Map
General Map
Google Map
MSN Map
OSM Map
General Map
Google Map
MSN Map
OSM Map
General Map
Google Map
MSN Map
Please wait while loading the map...
Real estate property taxes paid for housing units in 2022:
This zip code:
0.9% ($5,986)
California:
0.7% ($4,831)
Median real estate property taxes paid for housing units with mortgages in 2022: $6,146 (0.9%) Median real estate property taxes paid for housing units with no mortgage in 2022: $5,262 (0.8%)
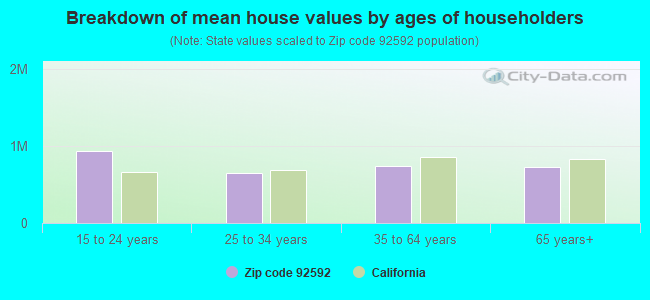
Estimated median house/condo value in 2022: $679,524
92592:
$679,524
California:
$715,900
According to our research of California and other state lists, there were 32 registered sex offenders living in 92592 zip code as of May 28, 2024. The ratio of all residents to sex offenders in zip code 92592 is 2,540 to 1. The ratio of registered sex offenders to all residents in this zip code is much lower than the state average.
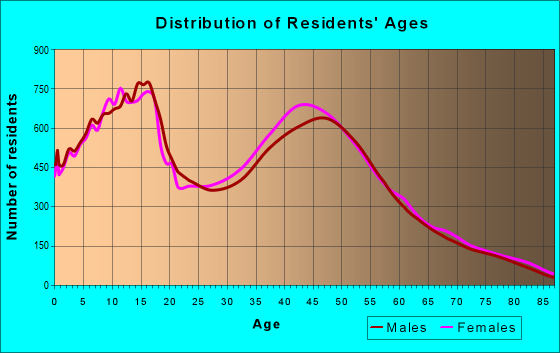
Median resident age:
This zip code:
37.9 years
California median age:
37.9 years
Average household size:
This zip code:
3.2 people
California:
2.8 people
Averages for the 2020 tax year for zip code 92592, filed in 2021:
Average Adjusted Gross Income (AGI) in 2020: $94,368 (Individual Income Tax Returns)
Here:
$94,368
State:
$95,910
Salary/wage: $79,928 (reported on 81.1% of returns)
Here:
$79,928
State:
$77,331
(% of AGI for various income ranges: 1154.4% for AGIs below $25k, 3609.3% for AGIs $25k-50k, 6704.6% for AGIs $50k-75k, 9841.2% for AGIs $75k-100k, 20813.7% for AGIs $100k-200k, 76840.1% for AGIs over 200k)
Taxable interest for individuals: $1,085 (reported on 43.9% of returns)
This zip code:
$1,085
California:
$2,294
(% of AGI for various income ranges: 18.0% for AGIs below $25k, 27.8% for AGIs $25k-50k, 50.5% for AGIs $50k-75k, 65.9% for AGIs $75k-100k, 93.5% for AGIs $100k-200k, 772.3% for AGIs over 200k)
Ordinary dividends: $4,098 (reported on 19.0% of returns)
Here:
$4,098
State:
$10,949
(% of AGI for various income ranges: 21.6% for AGIs below $25k, 34.7% for AGIs $25k-50k, 75.1% for AGIs $50k-75k, 80.1% for AGIs $75k-100k, 187.5% for AGIs $100k-200k, 1302.5% for AGIs over 200k)
Net capital gain/loss in AGI: +$24,037 (reported on 20.2% of returns)
Here:
+$24,037
State:
+$49,306
(% of AGI for various income ranges: 16.1% for AGIs below $25k, 32.1% for AGIs $25k-50k, 84.6% for AGIs $50k-75k, 158.0% for AGIs $75k-100k, 479.9% for AGIs $100k-200k, 14845.7% for AGIs over 200k)
Profit/loss from business: +$12,591 (reported on 19.1% of returns)
Here:
+$12,591
State:
+$15,671
(% of AGI for various income ranges: 125.7% for AGIs below $25k, 212.5% for AGIs $25k-50k, 297.6% for AGIs $50k-75k, 414.3% for AGIs $75k-100k, 538.4% for AGIs $100k-200k, 2689.0% for AGIs over 200k)
Taxable individual retirement arrangement distribution: $22,094 (reported on 7.3% of returns)
92592:
$22,094
California:
$23,505
(% of AGI for various income ranges: 44.4% for AGIs below $25k, 94.2% for AGIs $25k-50k, 213.7% for AGIs $50k-75k, 359.7% for AGIs $75k-100k, 517.2% for AGIs $100k-200k, 1326.4% for AGIs over 200k)
Self-employed (Keogh) retirement plans: $24,514 (reported on 0.6% of returns)
92592:
$24,514
California:
$30,163
(% of AGI for various income ranges: 20.4% for AGIs $50k-75k, 31.1% for AGIs $100k-200k, 335.5% for AGIs over 200k)
Total itemized deductions: $33,981 (reported on 21.9% of returns)
Here:
$33,981
State:
$39,517
(% of AGI for various income ranges: 111.4% for AGIs below $25k, 302.5% for AGIs $25k-50k, 770.3% for AGIs $50k-75k, 1241.6% for AGIs $75k-100k, 2430.3% for AGIs $100k-200k, 9031.9% for AGIs over 200k)
Charity contributions: $6,623 (reported on 18.0% of returns)
Here:
$6,623
State:
$12,598
(% of AGI for various income ranges: 4.6% for AGIs below $25k, 23.7% for AGIs $25k-50k, 63.2% for AGIs $50k-75k, 145.4% for AGIs $75k-100k, 366.6% for AGIs $100k-200k, 2089.9% for AGIs over 200k)
Taxes paid: $8,928 (reported on 21.8% of returns)
92592:
$8,928
State:
$8,807
(% of AGI for various income ranges: 26.0% for AGIs below $25k, 74.1% for AGIs $25k-50k, 206.3% for AGIs $50k-75k, 371.6% for AGIs $75k-100k, 724.1% for AGIs $100k-200k, 1881.6% for AGIs over 200k)
Earned income credit: $1,921 (reported on 9.8% of returns)
Here:
$1,921
State:
$2,074
(% of AGI for various income ranges: 60.1% for AGIs below $25k, 60.4% for AGIs $25k-50k, 1.5% for AGIs $50k-75k)
Percentage of individuals using paid preparers for their 2020 taxes: 93.9%
Here:
94%
State:
92%
(% for various income ranges: 92.7% for AGIs below $25k, 93.2% for AGIs $25k-50k, 93.8% for AGIs $50k-75k, 94.2% for AGIs $75k-100k, 94.8% for AGIs $100k-200k, 96.1% for AGIs over 200k)
Averages for the 2012 tax year for zip code 92592, filed in 2013:
Average Adjusted Gross Income (AGI) in 2012: $77,405 (Individual Income Tax Returns)
Here:
$77,405
State:
$72,726
Salary/wage: $67,227 (reported on 84.3% of returns)
Here:
$67,227
State:
$59,079
(% of AGI for various income ranges: 74.3% for AGIs below $25k, 77.3% for AGIs $25k-50k, 78.9% for AGIs $50k-75k, 80.6% for AGIs $75k-100k, 82.8% for AGIs $100k-200k, 51.7% for AGIs over 200k)
Taxable interest for individuals: $965 (reported on 44.5% of returns)
This zip code:
$965
California:
$2,146
(% of AGI for various income ranges: 1.1% for AGIs below $25k, 0.6% for AGIs $25k-50k, 0.5% for AGIs $50k-75k, 0.4% for AGIs $75k-100k, 0.4% for AGIs $100k-200k, 0.8% for AGIs over 200k)
Ordinary dividends: $4,036 (reported on 16.5% of returns)
Here:
$4,036
State:
$9,308
(% of AGI for various income ranges: 1.4% for AGIs below $25k, 0.7% for AGIs $25k-50k, 0.6% for AGIs $50k-75k, 0.5% for AGIs $75k-100k, 0.4% for AGIs $100k-200k, 1.7% for AGIs over 200k)
Net capital gain/loss in AGI: +$10,295 (reported on 15.7% of returns)
Here:
+$10,295
State:
+$30,460
(% of AGI for various income ranges: 0.3% for AGIs $50k-75k, 0.3% for AGIs $75k-100k, 0.7% for AGIs $100k-200k, 6.9% for AGIs over 200k)
Profit/loss from business: +$12,571 (reported on 18.5% of returns)
Here:
+$12,571
State:
+$17,064
(% of AGI for various income ranges: 10.6% for AGIs below $25k, 5.6% for AGIs $25k-50k, 3.6% for AGIs $50k-75k, 2.6% for AGIs $75k-100k, 2.0% for AGIs $100k-200k, 2.2% for AGIs over 200k)
Taxable individual retirement arrangement distribution: $18,157 (reported on 8.0% of returns)
92592:
$18,157
California:
$19,557
(% of AGI for various income ranges: 2.9% for AGIs below $25k, 2.2% for AGIs $25k-50k, 1.9% for AGIs $50k-75k, 2.4% for AGIs $75k-100k, 1.9% for AGIs $100k-200k, 1.2% for AGIs over 200k)
Self-employment retirement plans: $17,369 (reported on 0.5% of returns)
92592:
$17,369
California:
$24,530
(% of AGI for various income ranges: 0.1% for AGIs $25k-50k, 0.1% for AGIs $75k-100k, 0.3% for AGIs over 200k)
Total itemized deductions: $29,863 (25% of AGI, reported on 52.1% of returns)
Here:
$29,863
State:
$34,004
Here:
25.1% of AGI
State:
22.7% of AGI
(% of AGI for various income ranges: 18.2% for AGIs below $25k, 18.8% for AGIs $25k-50k, 21.1% for AGIs $50k-75k, 22.0% for AGIs $75k-100k, 21.7% for AGIs $100k-200k, 17.2% for AGIs over 200k)
Charity contributions: $3,063 (reported on 43.3% of returns)
Here:
$3,063
State:
$4,659
(% of AGI for various income ranges: 0.9% for AGIs below $25k, 1.4% for AGIs $25k-50k, 1.6% for AGIs $50k-75k, 1.9% for AGIs $75k-100k, 2.0% for AGIs $100k-200k, 1.5% for AGIs over 200k)
Taxes paid: $10,774 (reported on 52.0% of returns)
92592:
$10,774
State:
$14,448
(% of AGI for various income ranges: 4.1% for AGIs below $25k, 4.5% for AGIs $25k-50k, 5.8% for AGIs $50k-75k, 6.6% for AGIs $75k-100k, 7.9% for AGIs $100k-200k, 8.7% for AGIs over 200k)
Earned income credit: $2,136 (reported on 12.3% of returns)
Here:
$2,136
State:
$2,286
(% of AGI for various income ranges: 5.1% for AGIs below $25k, 1.2% for AGIs $25k-50k)
Percentage of individuals using paid preparers for their 2012 taxes: 60.2%
Here:
60%
State:
64%
(% for various income ranges: 51.6% for AGIs below $25k, 58.4% for AGIs $25k-50k, 62.3% for AGIs $50k-75k, 63.8% for AGIs $75k-100k, 65.9% for AGIs $100k-200k, 79.2% for AGIs over 200k)
Averages for the 2004 tax year for zip code 92592, filed in 2005:
Average Adjusted Gross Income (AGI) in 2004: $65,994 (Individual Income Tax Returns)
Here:
$65,994
State:
$58,600
Salary/wage: $58,856 (reported on 85.6% of returns)
Here:
$58,856
State:
$49,455
(% of AGI for various income ranges: 550.6% for AGIs below $10k, 74.0% for AGIs $10k-25k, 79.5% for AGIs $25k-50k, 83.0% for AGIs $50k-75k, 86.7% for AGIs $75k-100k, 68.5% for AGIs over 100k)
Taxable interest for individuals: $1,055 (reported on 57.7% of returns)
This zip code:
$1,055
California:
$2,365
(% of AGI for various income ranges: 34.6% for AGIs below $10k, 2.0% for AGIs $10k-25k, 1.2% for AGIs $25k-50k, 0.9% for AGIs $50k-75k, 0.5% for AGIs $75k-100k, 0.8% for AGIs over 100k)
Taxable dividends: $2,103 (reported on 22.0% of returns)
Here:
$2,103
State:
$4,746
(% of AGI for various income ranges: 21.3% for AGIs below $10k, 1.3% for AGIs $10k-25k, 0.8% for AGIs $25k-50k, 0.6% for AGIs $50k-75k, 0.4% for AGIs $75k-100k, 0.7% for AGIs over 100k)
Net capital gain/loss: +$13,889 (reported on 20.0% of returns)
Here:
+$13,889
State:
+$23,418
(% of AGI for various income ranges: -9.0% for AGIs below $10k, 0.8% for AGIs $10k-25k, 0.5% for AGIs $25k-50k, 0.9% for AGIs $50k-75k, 1.0% for AGIs $75k-100k, 7.5% for AGIs over 100k)
Profit/loss from business: +$14,474 (reported on 20.1% of returns)
Here:
+$14,474
State:
+$16,826
(% of AGI for various income ranges: -8.4% for AGIs below $10k, 9.1% for AGIs $10k-25k, 6.6% for AGIs $25k-50k, 4.4% for AGIs $50k-75k, 3.1% for AGIs $75k-100k, 4.1% for AGIs over 100k)
IRA payment deduction: $3,215 (reported on 3.0% of returns)
92592:
$3,215
California:
$3,192
(% of AGI for various income ranges: 2.0% for AGIs below $10k, 0.2% for AGIs $10k-25k, 0.2% for AGIs $25k-50k, 0.2% for AGIs $50k-75k, 0.1% for AGIs $75k-100k, 0.1% for AGIs over 100k)
Self-employed pension: $16,221 (reported on 1.1% of returns)
Here:
$16,221
California:
$17,688
(% of AGI for various income ranges: 0.1% for AGIs $25k-50k, 0.1% for AGIs $50k-75k, 0.2% for AGIs $75k-100k, 0.4% for AGIs over 100k)
Total itemized deductions: $28,203 (30% of AGI, reported on 61.5% of returns)
Here:
$28,203
State:
$28,113
Here:
30.2% of AGI
State:
25.3% of AGI
(% of AGI for various income ranges: 166.6% for AGIs below $10k, 25.1% for AGIs $10k-25k, 30.9% for AGIs $25k-50k, 32.5% for AGIs $50k-75k, 30.0% for AGIs $75k-100k, 21.7% for AGIs over 100k)
Charity contributions deductions: $2,757 (3% of AGI, reported on 54.3% of returns)
Here:
$2,757
State:
$3,923
Here:
2.8% of AGI
State:
3.3% of AGI
(% of AGI for various income ranges: 5.4% for AGIs below $10k, 1.6% for AGIs $10k-25k, 2.3% for AGIs $25k-50k, 2.4% for AGIs $50k-75k, 2.4% for AGIs $75k-100k, 2.2% for AGIs over 100k)
Total tax: $9,485 (reported on 79.4% of returns)
92592:
$9,485
State:
$10,761
(% of AGI for various income ranges: 22.0% for AGIs below $10k, 4.9% for AGIs $10k-25k, 5.7% for AGIs $25k-50k, 6.3% for AGIs $50k-75k, 7.5% for AGIs $75k-100k, 16.1% for AGIs over 100k)
Earned income credit: $1,655 (reported on 8.7% of returns)
Here:
$1,655
State:
$1,763
Percentage of individuals using paid preparers for their 2004 taxes: 65.2%
Here:
65%
State:
66%
(% for various income ranges: 50.4% for AGIs below $10k, 60.0% for AGIs $10k-25k, 68.3% for AGIs $25k-50k, 68.7% for AGIs $50k-75k, 67.3% for AGIs $75k-100k, 74.0% for AGIs over 100k)
Likely homosexual households (counted as self-reported same-sex unmarried-partner households)
Lesbian couples: 0.0% of all households
Gay men: 0.1% of all households
Household received Food Stamps/SNAP in the past 12 months: 1,103 Household did not receive Food Stamps/SNAP in the past 12 months: 23,661
Women who had a birth in the past 12 months: 663 (464 now married, 199 unmarried) Women who did not have a birth in the past 12 months: 17,209 (8,903 now married, 8,219 unmarried)
Housing units in zip code 92592 with a mortgage: 15,857 (1,558 second mortgage, 47 home equity loan, 1,121 both second mortgage and home equity loan) Houses without a mortgage: 60
Median monthly owner costs for units with a mortgage: $2,821 Median monthly owner costs for units without a mortgage: $838
Residents with income below the poverty level in 2022:
This zip code:
6.4%
Whole state:
12.2%
Residents with income below 50% of the poverty level in 2022:
This zip code:
2.5%
Whole state:
6.2%
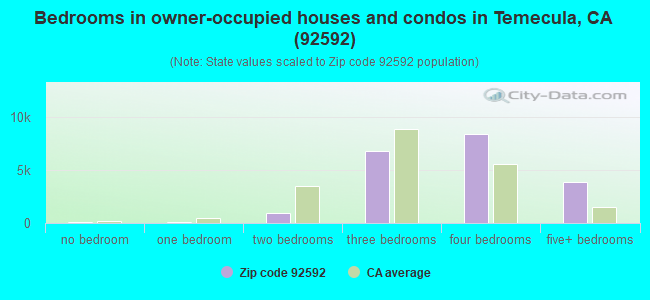
Median number of rooms in houses and condos:
Here:
7.2
State:
6.0
Median number of rooms in apartments:
Here:
5.6
State:
3.9
Notable locations in this zip code not listed on our city pages
Notable locations in zip code 92592: Hyatt School (A), Dripping Springs Guard Station (B), Dripping Springs Campground (C), Dripping Springs Trailhead (D), Temecula Valley Vineyards (E), Mesa Verde Winery (F), Indian Oaks Campground (G), Aprils Vineyard (H), Temecula Creek Inn Golf Course (I), Red Hawk Golf Club (J), Galway Downs Equestrian Training Center (K), Yampa Ranch (L), Pechanga Fire Department Station 277 (M), Riverside County Fire Department Station 92 - Wolf Creek (N), Pechanga Fire Department Station 177 (O), Riverside County Fire Department Station 96 Glen Oaks (P), Riverside County Fire Department Station 84 Parkview (Q), United States Forest Service Cleveland National Forest Station - Dripping Springs (R). Display/hide their locations on the map
Parks in zip code 92592 include: Emerson Wildlife Preserve (1), John Magee Park (2), Pala Road Park (3), Paloma del Sol Park (4), Pechanga Tribal Park (5), Temecula Sports Park (6), Glenoak Hills Park (7), Lake Skinner County Park (8). Display/hide their locations on the map
17,138 married couples with children.
3,376 single-parent households (1,074 men, 2,302 women).
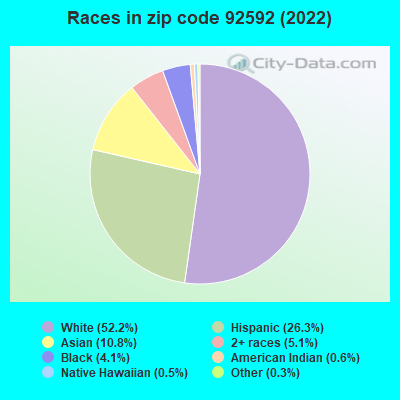
77.5% of residents of 92592 zip code speak English at home.
12.1% of residents speak Spanish at home (77% very well, 13% well, 9% not well, 2% not at all).
2.6% of residents speak other Indo-European language at home (73% very well, 14% well, 5% not well, 7% not at all).
6.6% of residents speak Asian or Pacific Island language at home (56% very well, 33% well, 9% not well, 1% not at all).
0.8% of residents speak other language at home (70% very well, 15% well, 15% not well).
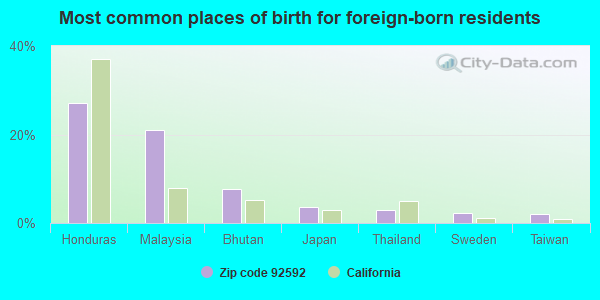
Foreign born population: 11,548 (14.3%) (70.7% of them are naturalized citizens)
Facilities with environmental interests located in this zip code:
L AND D TRANSPORT (29590 MIRA LOMA DR APT 216 in TEMECULA, CA)
STATE MASTER (California - Hazardous Waste Tracking) - HAZARDOU WASTE PROGRAM TRANSPORTER (Resource Conservation and Recovery Act (tracking hazardous waste)) - notification Organizations: LUIS ESCOLERO (CONTACT/OPERATOR)
CHEVRON STATION NO 204029 (31669 HWY 79 S in TEMECULA, CA)
STATE MASTER (California - Hazardous Waste Tracking) - HAZARDOU WASTE PROGRAM Small Quantity Generators, between 100 kg and 1000 kg of hazardous waste/month (Resource Conservation and Recovery Act (tracking hazardous waste)) - notification Organizations: CHEVRON PRODUCTS CO (CONTACT/OWNER)
JACKSON (HELEN HUNT) ELEMENTARY (32400 CAMINO SAN DIMAS in TEMECULA, CA)
(National Center for Education Statistics) - STATE ID-6116438 Organizations: TEMECULA VALLEY UNIFIED (SCHOOL DISTRICT)
LANGUAGE ACQUISITION MAGNET PROGRAM (LAMP) (32225 PIO PICO BLVD. in TEMECULA, CA)
(National Center for Education Statistics) - STATE ID-6115877 Organizations: TEMECULA VALLEY UNIFIED (SCHOOL DISTRICT)
CHEVRON 210410 (36480 WINCHESTER RD in TEMECULA, CA)
Large Quantity Generators, more that 1000 kg of hazardous waste/month (Resource Conservation and Recovery Act (tracking hazardous waste)) Organizations: CHEVRON USA INC (CONTACT/OPERATOR)
CANINE CARE INC. (43825 PAULITA ROAD in TEMECULA, CA)
COMPLIANCE ACTIVITY (Tracking inspections of insecticide, fungicide, and rodenticide, and toxic substances)
FOURTH ST AUTOMOTIVE (41935 FOURTH ST in TEMECULA, CA)
Small Quantity Generators, between 100 kg and 1000 kg of hazardous waste/month (Resource Conservation and Recovery Act (tracking hazardous waste)) - notification Organizations: MARK LANDERSMAN (CONTACT/OWNER)
J A S COMMERCIAL (38740 VIA DEL OSO in TEMECULA, CA)
Housing units lacking complete plumbing facilities: 0.5% Housing units lacking complete kitchen facilities: 1.2%
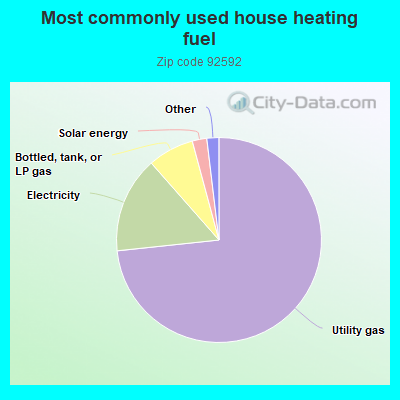
73.4%Utility gas
15.2%Electricity
7.3%Bottled, tank, or LP gas
2.3%Solar energy
0.7%Other fuel
0.6%Wood
Population in 1990: 15,567. Population change in the 1990s: +30,600 (+196.6%).
Place of birth for U.S.-born residents:
This state: 48,485
Northeast: 3,605
Midwest: 5,724
South: 5,774
West: 4,005
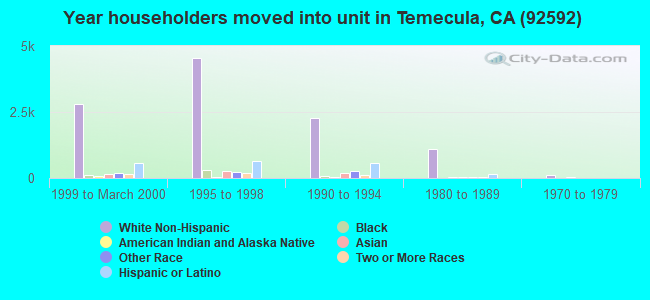
41% of the 92592 zip code residents lived in the same house 5 years ago. Out of people who lived in different houses, 33% lived in this county. Out of people who lived in different counties, 50% lived in California.
87% of the 92592 zip code residents lived in the same house 1 year ago. Out of people who lived in different houses, 42% moved from this county. Out of people who lived in different houses, 36% moved from different county within same state. Out of people who lived in different houses, 20% moved from different state. Out of people who lived in different houses, 3% moved from abroad.
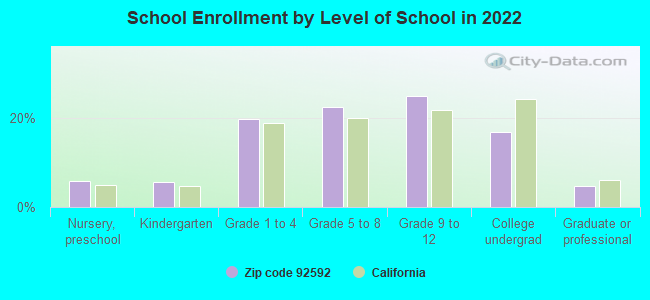
Private vs. public school enrollment:
Students in private schools in grades 1 to 8 (elementary and middle school): 1,162
Here:
11.5%
California:
10.5%
Students in private schools in grades 9 to 12 (high school): 372
Here:
6.3%
California:
8.5%
Students in private undergraduate colleges: 900
Here:
22.4%
California:
15.9%
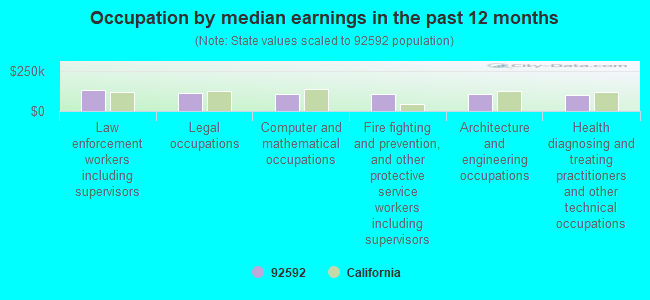
Occupation by median earnings in the past 12 months ($)
135,344Law enforcement workers including supervisors
114,217Legal occupations
109,932Computer and mathematical occupations
107,021Fire fighting and prevention, and other protective service workers including supervisors
106,629Architecture and engineering occupations
102,619Health diagnosing and treating practitioners and other technical occupations
Companies with biggest federal contracts located in this zip code (TEMECULA, CA):
ARTHUR L ETHEL (39350 CALLE ANITA RD; small business) : $622,908 in 10 contractsfrom 1999 to 2005
Contracts for Other Medical Services, Radiology Services by Navy Signed by year:2000: $74,521; 2001: $84,332; 2002: $87,506; 2003: $108,518; 2004: $96,522; 2005: $99,849; 2006: $0.
Biggest contracts:
$99,849 with Navy for Other Medical Services. Signed on 2005-10-20. Completion date: 2005-09-30.
$96,201, same as above.Signed on 2004-10-21. Completion date: 2005-09-30.
$87,506 with Navy for Radiology Services. Signed on 2002-10-01. Completion date: 2003-09-30.
$77,507, same as above.Signed on 2001-10-01. Completion date: 2001-09-30.
OUTSOURCE LTD (39155 CALLE ANITA RD; small business) : $333,625 in 162 contractsfrom 2003 to 2005
Contracts for Wrapping and Packaging Machinery, Screws, Hardware, Weapon System, Nails, Machine Keys, and Pins, and moreby Navy Signed by year:2000: $0; 2001: $0; 2002: $0; 2003: $29,816; 2004: $40,841; 2005: $262,968; 2006: $0.
Biggest contracts:
$29,816 with Navy for Wrapping and Packaging Machinery. Signed on 2003-09-30. Completion date: 2003-10-21.
$16,438 with Navy for Screws. Signed on 2005-09-20. Completion date: 2005-10-28.
$13,382, same as above.Signed on 2004-09-08. Completion date: 2004-11-04.
$12,436 with Navy for Hardware, Weapon System. Signed on 2005-09-30. Completion date: 2005-10-14.
THOMAS HAMBRICK (31902 CALLE BALLENTINE; small business) : $184,000 in 3 contractsfrom 2003 to 2006
$96,000 with Army for Program Management/Support Services. Signed on 2006-03-30. Completion date: 2004-06-30.
$48,000, same as above.Signed on 2005-09-27. Completion date: 2004-06-30.
$40,000, same as above.Signed on 2003-09-02. Completion date: 2004-06-30.
KAREN INTL (33220 CAMINO RUBANO) : $135,828 in 4 contractsfrom 2002 to 2004
$60,216 with Defense Logistics Agency for Miscellaneous Items. Signed on 2002-01-28. Completion date: 2002-03-29.
$37,012, same as above.Signed on 2004-04-12. Completion date: 2004-07-11.
$35,000 with Defense Logistics Agency for Cable, Cord, and Wire Assemblies: Communications Equipment. Signed on 2003-10-14. Completion date: 2003-11-13.
$3,600 with Navy for Photographic Supplies. Signed on 2003-02-14. Completion date: 2003-03-14.
KAREN INTL (33220 CAMINO RUBANO; small business) : $105,577 in 2 contractsfrom 2001 to 2002
$68,327 with Defense Logistics Agency for Electronic Countermeasures, Counter-Countermeasures and Quick Reaction Capability Equipment. Signed on 2002-01-05. Completion date: 2002-03-06.
$37,250 with Defense Logistics Agency for Miscellaneous Items. Signed on 2001-07-24. Completion date: 2001-10-01.
JAYS POOL AND SPA SERVICE (32788 HUPA DRIVE; small business) : $80,994 in 4 contractsfrom 1999 to 2003
$31,300 with Air Force for Facilities Operations Support Services. Signed on 2002-10-01. Completion date: 2003-09-30.
$29,460, same as above.Signed on 1999-11-17. Completion date: 2000-09-30.
$28,234, same as above.Signed on 2000-10-01. Completion date: 2001-09-30.
-$8,000 with Air Force for Landscaping/Groundskeeping Services. Signed on 2003-08-06. Completion date: 2003-08-06.
PAULSON MFG CORPORATION (46752 RAINBOW CANYON RD; small business)
$70,000 with Army for Laboratory Equipment and Supplies. Signed on 2006-01-10. Completion date: 2007-01-17.
GEORGE W SLAGLE (42597 DE PORTOLA ROAD; small business)
$59,903 with Air Force for Household and Commercial Utility Containers. Signed on 2003-08-01. Completion date: 2003-09-01.
PECHANGA DEVELOPMENT CORPORATI (45000 PECHANGA PARKWAY) : $36,400 in 5 contractsfrom 2003 to 2006
Contracts for Audio/Visual Services, Training Aids, Lease or Rental of Facilities -- Conference Space and Facilities, Forest/Range Fire Suppression/Presuppression Services by Army, Navy, Indian Affairs (Assistant Secretary) Signed by year:2000: $0; 2001: $0; 2002: $0; 2003: $2,400; 2004: $0; 2005: $20,000; 2006: $14,000.
Biggest contracts:
$20,000 with Army for Audio/Visual Services. Signed on 2005-03-17. Completion date: 2005-03-19.
$14,000 with Army for Training Aids. Signed on 2006-03-17. Completion date: 2006-03-25.
$6,856 with Navy for Lease or Rental of Facilities -- Conference Space and Facilities. Signed on 2005-07-25. Completion date: 2005-09-15.
$2,400 with Indian Affairs (Assistant Secretary) for Forest/Range Fire Suppression/Presuppression Services. Taking place in ID. Signed on 2003-06-15. Completion date: 2003-09-15.
BARRY D MAYER (34390 SCOTELLA ROAD; small business) : $34,999 in 2 contractsin 2005
$24,999 with Navy for Gardening Implements and Tools. Signed on 2005-04-21. Completion date: 2005-09-30.
$10,000 with Navy for Maintenance, Repair and Rebuilding of Equipment -- Miscellaneous. Signed on 2005-09-27. Completion date: 2005-09-27.
Top industries in this zip code by the number of employees in 2005:
2002 - 2018 National Fire Incident Reporting System (NFIRS) incidents
Based on the data from the years 2002 - 2018 the average number of fires per year is 89. The highest number of fires - 154 took place in 2006, and the least - 0 in 2003. The data has a growing trend.
When looking into fire subcategories, the most incidents belonged to: Outside Fires (46.6%), and Structure Fires (31.1%).
Fire incident types reported to NFIRS in Zip Code 92592


 Nearest zip codes: 92591, 92563, 92059, 92596, 92543, 92590.
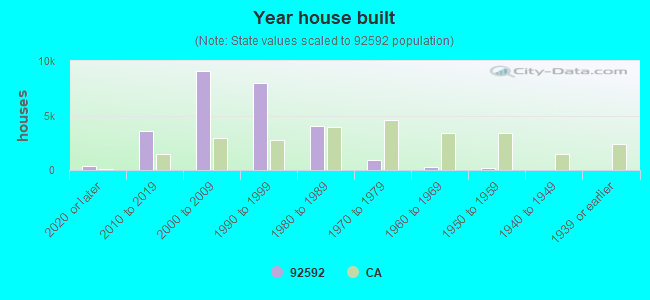


 Based on the data from the years 2002 - 2018 the average number of fires per year is 89. The highest number of fires - 154 took place in 2006, and the least - 0 in 2003. The data has a growing trend.
 When looking into fire subcategories, the most incidents belonged to: Outside Fires (46.6%), and Structure Fires (31.1%).