Averages for the 2020 tax year for zip code 93604, filed in 2021:
Average Adjusted Gross Income (AGI) in 2020: $71,941 (Individual Income Tax Returns)
Here:
$71,941
State:
$95,910
Salary/wage: $49,229 (reported on 53.1% of returns)
Here:
$49,229
State:
$77,331
(% of AGI for various income ranges: 1123.3% for AGIs below $25k, 2800.0% for AGIs $25k-50k, 9890.0% for AGIs $50k-75k)
Taxable interest for individuals: $744 (reported on 50.0% of returns)
This zip code:
$744
California:
$2,294
(% of AGI for various income ranges: 33.3% for AGIs below $25k, 26.0% for AGIs $25k-50k, 155.0% for AGIs $50k-75k)
Ordinary dividends: $7,289 (reported on 28.1% of returns)
Here:
$7,289
State:
$10,949
(% of AGI for various income ranges: 414.0% for AGIs $25k-50k)
Net capital gain/loss in AGI: +$9,322 (reported on 28.1% of returns)
Here:
+$9,322
State:
+$49,306
(% of AGI for various income ranges: 216.0% for AGIs $25k-50k)
Profit/loss from business: +$28,517 (reported on 18.8% of returns)
Here:
+$28,517
State:
+$15,671
(% of AGI for various income ranges: 584.0% for AGIs $25k-50k, 4730.0% for AGIs $75k-100k)
Taxable individual retirement arrangement distribution: $22,467 (reported on 18.8% of returns)
93604:
$22,467
California:
$23,505
(% of AGI for various income ranges: 1014.0% for AGIs $25k-50k)
Total itemized deductions: $33,733 (reported on 18.8% of returns)
Here:
$33,733
State:
$39,517
(% of AGI for various income ranges: 1386.0% for AGIs $25k-50k)
Charity contributions: $3,700 (reported on 12.5% of returns)
Here:
$3,700
State:
$12,598
(% of AGI for various income ranges: 71.7% for AGIs below $25k)
Taxes paid: $7,533 (reported on 18.8% of returns)
93604:
$7,533
State:
$8,807
(% of AGI for various income ranges: 360.0% for AGIs $25k-50k)
Earned income credit: $1,000 (reported on 9.4% of returns)
Here:
$1,000
State:
$2,074
(% of AGI for various income ranges: 50.0% for AGIs below $25k)
Percentage of individuals using paid preparers for their 2020 taxes: 93.8%
Here:
94%
State:
92%
(% for various income ranges: 90.0% for AGIs below $25k, 100.0% for AGIs $25k-50k, 100.0% for AGIs $50k-75k, 66.7% for AGIs $75k-100k, 100.0% for AGIs $100k-200k, 100.0% for AGIs over 200k)
Averages for the 2012 tax year for zip code 93604, filed in 2013:
Average Adjusted Gross Income (AGI) in 2012: $67,677 (Individual Income Tax Returns)
Here:
$67,677
State:
$72,726
Salary/wage: $45,705 (reported on 57.1% of returns)
Here:
$45,705
State:
$59,079
(% of AGI for various income ranges: 53.9% for AGIs below $25k, 41.5% for AGIs $25k-50k, 69.5% for AGIs $50k-75k, 38.3% for AGIs $100k-200k)
Taxable interest for individuals: $2,210 (reported on 57.1% of returns)
This zip code:
$2,210
California:
$2,146
(% of AGI for various income ranges: 4.6% for AGIs below $25k, 3.6% for AGIs $25k-50k, 1.0% for AGIs $50k-75k, 0.6% for AGIs $75k-100k, 1.6% for AGIs $100k-200k)
Ordinary dividends: $3,500 (reported on 34.3% of returns)
Here:
$3,500
State:
$9,308
(% of AGI for various income ranges: 3.1% for AGIs below $25k, 2.9% for AGIs $25k-50k, 4.2% for AGIs $50k-75k, 1.3% for AGIs $100k-200k)
Net capital gain/loss in AGI: +$3,467 (reported on 25.7% of returns)
Here:
+$3,467
State:
+$30,460
Profit/loss from business: +$16,350 (reported on 22.9% of returns)
Here:
+$16,350
State:
+$17,064
(% of AGI for various income ranges: 14.4% for AGIs below $25k, 14.0% for AGIs $25k-50k, 22.6% for AGIs $75k-100k)
Taxable individual retirement arrangement distribution: $25,488 (reported on 22.9% of returns)
93604:
$25,488
California:
$19,557
(% of AGI for various income ranges: 7.1% for AGIs $25k-50k, 28.1% for AGIs $50k-75k, 7.7% for AGIs $100k-200k)
Total itemized deductions: $29,019 (27% of AGI, reported on 45.7% of returns)
Here:
$29,019
State:
$34,004
Here:
27.0% of AGI
State:
22.7% of AGI
(% of AGI for various income ranges: 25.9% for AGIs below $25k, 19.6% for AGIs $25k-50k, 19.6% for AGIs $50k-75k, 22.3% for AGIs $75k-100k, 18.4% for AGIs $100k-200k)
Charity contributions: $2,992 (reported on 37.1% of returns)
Here:
$2,992
State:
$4,659
(% of AGI for various income ranges: 2.5% for AGIs $25k-50k, 1.5% for AGIs $50k-75k, 2.0% for AGIs $75k-100k, 1.5% for AGIs $100k-200k)
Taxes paid: $10,088 (reported on 45.7% of returns)
93604:
$10,088
State:
$14,448
(% of AGI for various income ranges: 4.5% for AGIs below $25k, 4.2% for AGIs $25k-50k, 5.8% for AGIs $50k-75k, 6.5% for AGIs $75k-100k, 8.0% for AGIs $100k-200k)
Earned income credit: $1,650 (reported on 5.7% of returns)
Here:
$1,650
State:
$2,286
(% of AGI for various income ranges: 2.5% for AGIs below $25k)
Percentage of individuals using paid preparers for their 2012 taxes: 68.6%
Here:
69%
State:
64%
(% for various income ranges: 50.0% for AGIs below $25k, 66.7% for AGIs $25k-50k, 75.0% for AGIs $50k-75k, 100.0% for AGIs $75k-100k, 85.7% for AGIs $100k-200k)
Averages for the 2004 tax year for zip code 93604, filed in 2005:
Average Adjusted Gross Income (AGI) in 2004: $53,732 (Individual Income Tax Returns)
Here:
$53,732
State:
$58,600
Salary/wage: $38,381 (reported on 58.1% of returns)
Here:
$38,381
State:
$49,455
(% of AGI for various income ranges: 50.5% for AGIs $10k-25k, 50.1% for AGIs $25k-50k, 43.9% for AGIs $50k-75k, 44.6% for AGIs $75k-100k, 32.2% for AGIs over 100k)
Taxable interest for individuals: $3,244 (reported on 66.7% of returns)
This zip code:
$3,244
California:
$2,365
(% of AGI for various income ranges: 7.6% for AGIs $10k-25k, 4.6% for AGIs $25k-50k, 2.4% for AGIs $50k-75k, 4.8% for AGIs $75k-100k, 2.6% for AGIs over 100k)
Taxable dividends: $3,299 (reported on 36.2% of returns)
Here:
$3,299
State:
$4,746
(% of AGI for various income ranges: 2.1% for AGIs $10k-25k, 1.7% for AGIs $25k-50k, 1.4% for AGIs $50k-75k, 1.5% for AGIs $75k-100k, 2.7% for AGIs over 100k)
Net capital gain/loss: +$17,965 (reported on 27.8% of returns)
Here:
+$17,965
State:
+$23,418
(% of AGI for various income ranges: 1.6% for AGIs $10k-25k, 0.2% for AGIs $25k-50k, 0.0% for AGIs $50k-75k, 1.2% for AGIs $75k-100k, 18.6% for AGIs over 100k)
Profit/loss from business: +$11,860 (reported on 24.6% of returns)
Here:
+$11,860
State:
+$16,826
(% of AGI for various income ranges: 6.3% for AGIs $10k-25k, 11.4% for AGIs $25k-50k, 0.5% for AGIs $50k-75k, 6.0% for AGIs over 100k)
Self-employed pension: $10,000 (reported on 2.5% of returns)
Here:
$10,000
California:
$17,688
Total itemized deductions: $24,320 (29% of AGI, reported on 50.7% of returns)
Here:
$24,320
State:
$28,113
Here:
29.3% of AGI
State:
25.3% of AGI
(% of AGI for various income ranges: 22.5% for AGIs $10k-25k, 24.9% for AGIs $25k-50k, 25.6% for AGIs $50k-75k, 23.5% for AGIs $75k-100k, 18.4% for AGIs over 100k)
Charity contributions deductions: $3,304 (4% of AGI, reported on 45.3% of returns)
Here:
$3,304
State:
$3,923
Here:
4.0% of AGI
State:
3.3% of AGI
(% of AGI for various income ranges: 1.5% for AGIs $10k-25k, 3.8% for AGIs $25k-50k, 4.0% for AGIs $50k-75k, 2.9% for AGIs $75k-100k, 2.0% for AGIs over 100k)
Total tax: $9,523 (reported on 75.4% of returns)
93604:
$9,523
State:
$10,761
(% of AGI for various income ranges: 3.7% for AGIs $10k-25k, 6.7% for AGIs $25k-50k, 9.0% for AGIs $50k-75k, 11.5% for AGIs $75k-100k, 18.6% for AGIs over 100k)
Earned income credit: $1,475 (reported on 9.9% of returns)
Here:
$1,475
State:
$1,763
Percentage of individuals using paid preparers for their 2004 taxes: 70.4%
Here:
70%
State:
66%
(% for various income ranges: 67.6% for AGIs below $10k, 59.4% for AGIs $10k-25k, 68.5% for AGIs $25k-50k, 78.0% for AGIs $50k-75k, 79.4% for AGIs $75k-100k, 88.6% for AGIs over 100k)
Household received Food Stamps/SNAP in the past 12 months: 0 Household did not receive Food Stamps/SNAP in the past 12 months: 156
Women who did not have a birth in the past 12 months: 26 (18 now married, 8 unmarried)
Housing units in zip code 93604 with a mortgage: 104 Median monthly owner costs for units with a mortgage: $3,876 Median monthly owner costs for units without a mortgage: $1,015
Residents with income below the poverty level in 2022:
This zip code:
18.5%
Whole state:
12.2%
Median number of rooms in houses and condos:
Here:
5.9
State:
6.0
Notable locations in this zip code not listed on our city pages
Notable locations in zip code 93604: Buchenau Cabin (A), The Falls (B), Gaggs Campground (C), Jones Store (D), Topping Cow Camp (E), Greys Mountain Campground (F), Bass Lake Vista (G), Beaver Ponds (H), Falls Beach Picnic Area (I), Recreation Point (J), Sheriffs Tower (K), Willow Cove Picnic Area (L), Beasore Subdivision (M), Soquel Campground (N), Denver Church Picnic Area (O), The Falls Picnic Area (P), Chilkoot Campground (Q), Denver Church Campground (R), Fish Creek Campground (S), Shuteye Peak Lookout (T). Display/hide their locations on the map
Lakes: Junction Lake (A), Dutchman Lake (B), Hoggem Lake (C), Iron Lakes (D), Grizzly Lake (E), Bare Island Lake (F), Chilkoot Lake (G), Star Lakes (H). Display/hide their locations on the map
Creeks: Crescent Creek (A), Pines Creek (B), Iron Creek (C), Chilkoot Creek (D), Gordon Creek (E), Salter Creek (F). Display/hide their locations on the map
Year house built (houses)
02020 or later
02010 to 2019
1342000 to 2009
2001990 to 1999
3461980 to 1989
2161970 to 1979
1161960 to 1969
761950 to 1959
601940 to 1949
851939 or earlier
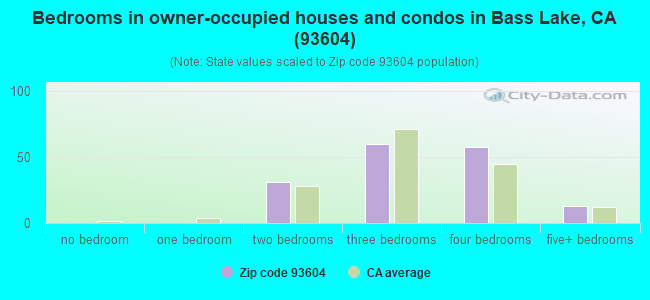
Bedrooms in owner-occupied houses and condos in Bass Lake, CA (93604)
0no bedroom
01 bedroom
312 bedrooms
603 bedrooms
584 bedrooms
135+ bedrooms
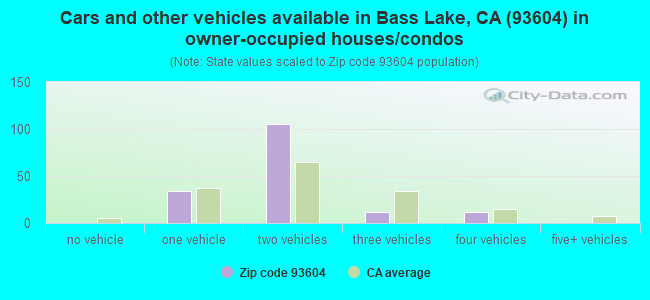
Cars and other vehicles available in Bass Lake, CA (93604) in owner-occupied houses/condos
0no vehicle
341 vehicle
1052 vehicles
123 vehicles
124 vehicles
05+ vehicles
Zip code 93604 household income distribution in 2022
27Less than $10,000
3$35,000 to $39,999
7$40,000 to $44,999
21$50,000 to $59,999
21$75,000 to $99,999
9$100,000 to $124,999
14$125,000 to $149,999
24$150,000 to $199,999
31$200,000 or more
Estimate of home value of owner-occupied houses/condos in 2022 in zip code 93604
3$50,000 to $59,999
11$60,000 to $69,999
10$80,000 to $89,999
10$100,000 to $124,999
5$300,000 to $399,999
12$500,000 to $749,999
57$750,000 to $999,999
38$1,500,000 to $1,999,999
32$2,000,000 or more
Estimated median house (or condo) value in 2022 for:
White Non-Hispanic householders: $1,340,535
Estimated median house or condo value in 2022: $963,473
93604:
$963,473
California:
$715,900
Mean price in 2022:
Detached houses: $1,199,077
Here:
$1,199,077
State:
$988,808
Mobile homes: $92,711
Here:
$92,711
State:
$184,506
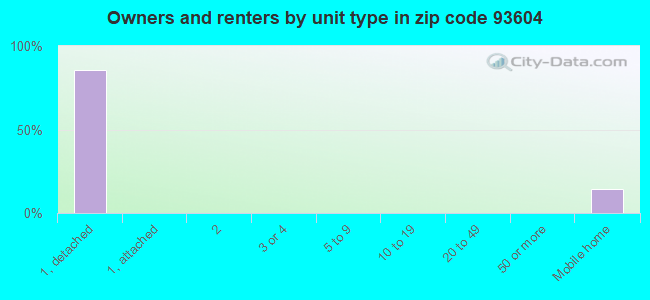
Housing units in structures:
One, detached: 1,042
3 or 4: 27
Mobile homes: 187
Means of transportation to work in zip code 93604
47.3%59Drove a car alone
25.7%32Carpooled
31.3%39Worked at home
Travel time to work (commute) in zip code 93604
1110 to 14 minutes
3020 to 24 minutes
1125 to 29 minutes
2430 to 34 minutes
1160 to 89 minutes
Percentage of zip code residents living and working in this county: 81.5%
Household type by relationship:
Households: 362
Male householders: 113 (0 living alone), Female householders: 47 (9 living alone)
Size of family households: 128 2-persons, 23 4-persons
Size of nonfamily households: 9 1-person
46 married couples with children.
0 single-parent households ().
100.5% of residents of 93604 zip code speak English at home.
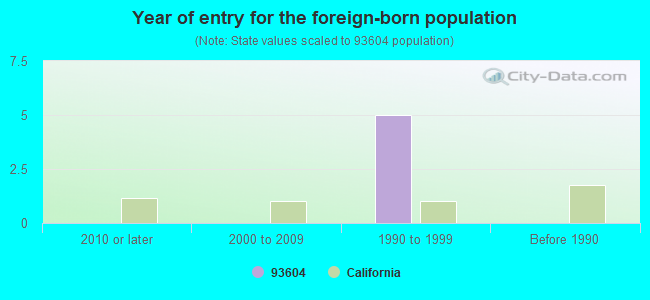
Foreign born population: 0 (0.0%)
:
0.0%
Whole state:
26.7%
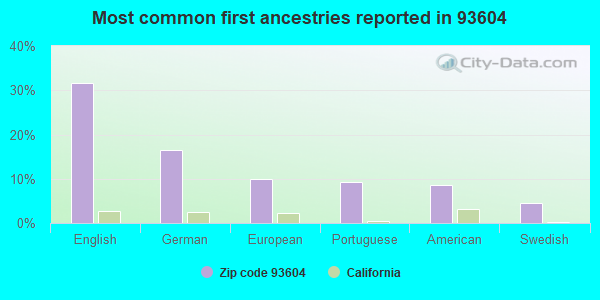
32%English
16%German
10%European
9%Portuguese
9%American
5%Swedish
Year of entry for the foreign-born population
02010 or later
02000 to 2009
51990 to 1999
0Before 1990
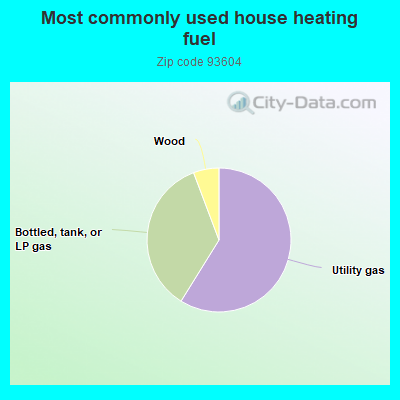
59.5%Utility gas
35.8%Bottled, tank, or LP gas
5.8%Wood
Population in 1990: 628.
Place of birth for U.S.-born residents:
This state: 263
Northeast: 11
Midwest: 41
West: 38
57% of the 93604 zip code residents lived in the same house 5 years ago. Out of people who lived in different houses, 13% lived in this county. Out of people who lived in different counties, 50% lived in California.
101% of the 93604 zip code residents lived in the same house 1 year ago.
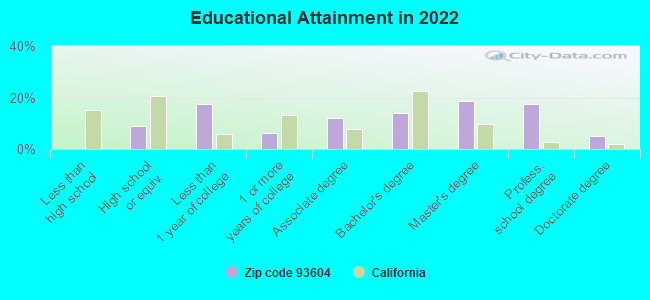
Private vs. public school enrollment:
Students in private schools in grades 1 to 8 (elementary and middle school): 14
Here:
100.0%
California:
10.5%
Students in private schools in grades 9 to 12 (high school):
Here:
0.0%
California:
8.5%
Students in private undergraduate colleges:
Here:
0.0%
California:
15.9%
Top industries in this zip code by the number of employees in 2005:
Accommodation and Food Services: Hotels (except Casino Hotels) and Motels (100-249 employees: 1 establishment, 1-4 employees: 1 establishment)
Real Estate and Rental and Leasing: Offices of Real Estate Agents and Brokers (20-49: 1, 10-19: 1)
Accommodation and Food Services: Full-Service Restaurants (10-19: 1, 1-4: 1)
Professional, Scientific, and Technical Services: Environmental Consulting Services (10-19: 1)
Other Services (except Public Administration): Religious Organizations (5-9: 2)
Real Estate and Rental and Leasing: Recreational Goods Rental (5-9: 1)
Construction: Framing Contractors (5-9: 1)
Educational Services: Educational Support Services (1-4: 1)
Fatal accident statistics in 2014:
Fatal accident count: 1
Vehicles involved in fatal accidents: 1
Fatal accidents caused by drunken drivers: 0
Fatalities: 1
Persons involved in fatal accidents: 1
Pedestrians involved in fatal accidents: 0
Fatal accident statistics in 2012:
Fatal accident count: 1
Vehicles involved in fatal accidents: 1
Fatal accidents caused by drunken drivers: 1
Fatalities: 2
Persons involved in fatal accidents: 2
Pedestrians involved in fatal accidents: 0
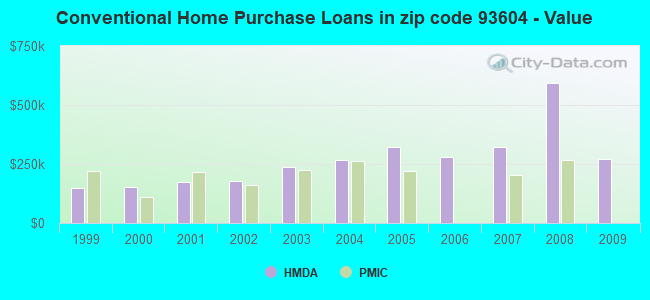
Home Mortgage Disclosure Act Aggregated Statistics For Year 2009 (Based on 6 partial tracts)
A) FHA, FSA/RHS & VA Home Purchase Loans
B) Conventional Home Purchase Loans
C) Refinancings
D) Home Improvement Loans
F) Non-occupant Loans on < 5 Family Dwellings (A B C & D)
G) Loans On Manufactured Home Dwelling (A B C & D)
Number
Average Value
Number
Average Value
Number
Average Value
Number
Average Value
Number
Average Value
Number
Average Value
LOANS ORIGINATED
3
$145,580
9
$270,762
30
$252,629
2
$132,350
17
$292,171
2
$83,970
APPLICATIONS APPROVED, NOT ACCEPTED
0
$0
2
$281,090
3
$278,953
0
$0
1
$365,310
0
$0
APPLICATIONS DENIED
0
$0
2
$358,910
17
$284,958
2
$198,785
7
$340,736
0
$0
APPLICATIONS WITHDRAWN
0
$0
1
$100,350
5
$243,660
0
$0
1
$378,880
1
$117,500
FILES CLOSED FOR INCOMPLETENESS
0
$0
0
$0
3
$202,153
0
$0
0
$0
0
$0
Aggregated Statistics For Year 2008 (Based on 6 partial tracts)
A) FHA, FSA/RHS & VA Home Purchase Loans
B) Conventional Home Purchase Loans
C) Refinancings
D) Home Improvement Loans
F) Non-occupant Loans on < 5 Family Dwellings (A B C & D)
G) Loans On Manufactured Home Dwelling (A B C & D)
Number
Average Value
Number
Average Value
Number
Average Value
Number
Average Value
Number
Average Value
Number
Average Value
LOANS ORIGINATED
0
$0
6
$594,688
18
$286,237
3
$211,457
9
$406,898
2
$137,600
APPLICATIONS APPROVED, NOT ACCEPTED
0
$0
1
$167,680
3
$299,860
1
$315,140
1
$310,530
0
$0
APPLICATIONS DENIED
1
$130,820
2
$238,080
15
$257,945
2
$1,495,935
5
$782,540
2
$139,905
APPLICATIONS WITHDRAWN
0
$0
1
$89,600
5
$265,676
0
$0
1
$142,080
0
$0
FILES CLOSED FOR INCOMPLETENESS
0
$0
0
$0
2
$242,815
1
$245,760
1
$268,290
0
$0
Aggregated Statistics For Year 2007 (Based on 6 partial tracts)
B) Conventional Home Purchase Loans
C) Refinancings
D) Home Improvement Loans
F) Non-occupant Loans on < 5 Family Dwellings (A B C & D)
G) Loans On Manufactured Home Dwelling (A B C & D)
Number
Average Value
Number
Average Value
Number
Average Value
Number
Average Value
Number
Average Value
LOANS ORIGINATED
14
$322,999
26
$318,267
6
$251,648
14
$378,514
2
$125,825
APPLICATIONS APPROVED, NOT ACCEPTED
2
$238,465
8
$297,728
2
$489,600
4
$208,640
2
$83,710
APPLICATIONS DENIED
4
$282,175
18
$403,043
4
$86,465
6
$364,843
2
$139,775
APPLICATIONS WITHDRAWN
1
$715,780
7
$417,390
1
$116,480
2
$643,970
0
$0
FILES CLOSED FOR INCOMPLETENESS
1
$496,640
3
$324,607
1
$53,760
1
$352,770
0
$0
Aggregated Statistics For Year 2006 (Based on 6 partial tracts)
A) FHA, FSA/RHS & VA Home Purchase Loans
B) Conventional Home Purchase Loans
C) Refinancings
D) Home Improvement Loans
F) Non-occupant Loans on < 5 Family Dwellings (A B C & D)
G) Loans On Manufactured Home Dwelling (A B C & D)
Number
Average Value
Number
Average Value
Number
Average Value
Number
Average Value
Number
Average Value
Number
Average Value
LOANS ORIGINATED
1
$96,510
17
$281,645
39
$307,581
7
$159,049
19
$394,132
3
$143,700
APPLICATIONS APPROVED, NOT ACCEPTED
0
$0
6
$240,982
8
$273,312
1
$412,420
3
$278,443
0
$0
APPLICATIONS DENIED
0
$0
6
$378,197
21
$484,828
5
$170,036
7
$418,633
3
$146,433
APPLICATIONS WITHDRAWN
0
$0
2
$514,050
15
$309,077
2
$144,895
3
$342,017
1
$177,660
FILES CLOSED FOR INCOMPLETENESS
0
$0
1
$284,160
4
$373,568
0
$0
1
$815,360
0
$0
Aggregated Statistics For Year 2005 (Based on 6 partial tracts)
B) Conventional Home Purchase Loans
C) Refinancings
D) Home Improvement Loans
F) Non-occupant Loans on < 5 Family Dwellings (A B C & D)
G) Loans On Manufactured Home Dwelling (A B C & D)
Number
Average Value
Number
Average Value
Number
Average Value
Number
Average Value
Number
Average Value
LOANS ORIGINATED
18
$320,071
41
$258,766
9
$178,460
17
$414,690
4
$119,872
APPLICATIONS APPROVED, NOT ACCEPTED
1
$360,450
7
$265,729
1
$17,920
2
$412,800
0
$0
APPLICATIONS DENIED
8
$218,112
16
$329,200
6
$178,133
5
$302,080
4
$110,848
APPLICATIONS WITHDRAWN
5
$307,866
19
$230,292
2
$107,010
2
$474,240
2
$124,800
FILES CLOSED FOR INCOMPLETENESS
0
$0
4
$201,345
0
$0
1
$283,650
0
$0
Aggregated Statistics For Year 2004 (Based on 6 partial tracts)
B) Conventional Home Purchase Loans
C) Refinancings
D) Home Improvement Loans
F) Non-occupant Loans on < 5 Family Dwellings (A B C & D)
G) Loans On Manufactured Home Dwelling (A B C & D)
Number
Average Value
Number
Average Value
Number
Average Value
Number
Average Value
Number
Average Value
LOANS ORIGINATED
31
$266,001
52
$230,868
4
$139,585
27
$320,569
3
$84,223
APPLICATIONS APPROVED, NOT ACCEPTED
4
$284,095
10
$175,181
1
$12,800
3
$265,643
1
$146,430
APPLICATIONS DENIED
10
$196,147
27
$170,600
5
$64,820
7
$240,603
3
$171,433
APPLICATIONS WITHDRAWN
4
$256,128
19
$161,684
1
$105,470
2
$222,080
2
$99,200
FILES CLOSED FOR INCOMPLETENESS
1
$132,610
4
$238,528
0
$0
0
$0
0
$0
Aggregated Statistics For Year 2003 (Based on 6 partial tracts)
B) Conventional Home Purchase Loans
C) Refinancings
D) Home Improvement Loans
F) Non-occupant Loans on < 5 Family Dwellings (A B C & D)
Number
Average Value
Number
Average Value
Number
Average Value
Number
Average Value
LOANS ORIGINATED
26
$236,908
93
$199,080
2
$68,735
37
$267,132
APPLICATIONS APPROVED, NOT ACCEPTED
3
$118,187
12
$195,733
1
$11,780
3
$240,127
APPLICATIONS DENIED
6
$149,803
29
$196,714
1
$111,360
6
$201,003
APPLICATIONS WITHDRAWN
3
$145,580
20
$181,619
1
$115,200
5
$251,852
FILES CLOSED FOR INCOMPLETENESS
2
$139,265
6
$331,350
0
$0
3
$162,047
Aggregated Statistics For Year 2002 (Based on 6 partial tracts)
A) FHA, FSA/RHS & VA Home Purchase Loans
B) Conventional Home Purchase Loans
C) Refinancings
D) Home Improvement Loans
F) Non-occupant Loans on < 5 Family Dwellings (A B C & D)
Number
Average Value
Number
Average Value
Number
Average Value
Number
Average Value
Number
Average Value
LOANS ORIGINATED
1
$81,410
24
$176,341
60
$168,700
1
$16,640
23
$194,794
APPLICATIONS APPROVED, NOT ACCEPTED
0
$0
4
$152,832
7
$179,894
0
$0
3
$210,687
APPLICATIONS DENIED
0
$0
5
$160,820
12
$149,782
1
$18,940
3
$207,190
APPLICATIONS WITHDRAWN
0
$0
1
$159,230
14
$148,571
0
$0
2
$173,055
FILES CLOSED FOR INCOMPLETENESS
0
$0
0
$0
2
$126,975
0
$0
0
$0
Aggregated Statistics For Year 2001 (Based on 6 partial tracts)
A) FHA, FSA/RHS & VA Home Purchase Loans
B) Conventional Home Purchase Loans
C) Refinancings
D) Home Improvement Loans
F) Non-occupant Loans on < 5 Family Dwellings (A B C & D)
Number
Average Value
Number
Average Value
Number
Average Value
Number
Average Value
Number
Average Value
LOANS ORIGINATED
1
$138,750
14
$173,659
35
$161,156
2
$65,535
16
$231,520
APPLICATIONS APPROVED, NOT ACCEPTED
0
$0
2
$176,895
3
$127,147
1
$48,640
1
$212,990
APPLICATIONS DENIED
0
$0
4
$183,295
12
$130,005
2
$25,215
3
$180,650
APPLICATIONS WITHDRAWN
0
$0
3
$164,353
10
$125,850
0
$0
3
$194,303
FILES CLOSED FOR INCOMPLETENESS
0
$0
2
$198,785
1
$157,700
0
$0
1
$221,700
Aggregated Statistics For Year 2000 (Based on 6 partial tracts)
A) FHA, FSA/RHS & VA Home Purchase Loans
B) Conventional Home Purchase Loans
C) Refinancings
D) Home Improvement Loans
F) Non-occupant Loans on < 5 Family Dwellings (A B C & D)
Number
Average Value
Number
Average Value
Number
Average Value
Number
Average Value
Number
Average Value
LOANS ORIGINATED
1
$84,220
17
$152,681
11
$131,351
2
$22,015
10
$177,587
APPLICATIONS APPROVED, NOT ACCEPTED
0
$0
2
$216,450
3
$127,830
0
$0
1
$348,930
APPLICATIONS DENIED
0
$0
3
$138,070
9
$108,118
1
$44,800
1
$123,390
APPLICATIONS WITHDRAWN
0
$0
1
$418,050
3
$106,240
0
$0
0
$0
FILES CLOSED FOR INCOMPLETENESS
0
$0
1
$142,340
1
$86,530
0
$0
1
$132,100
Aggregated Statistics For Year 1999 (Based on 3 partial tracts)
B) Conventional Home Purchase Loans
C) Refinancings
D) Home Improvement Loans
F) Non-occupant Loans on < 5 Family Dwellings (A B C & D)
Detailed PMIC statistics for the following Tracts:0001.02
2006 - 2018 National Fire Incident Reporting System (NFIRS) incidents
Based on the data from the years 2006 - 2018 the average number of fires per year is 10. The highest number of reported fire incidents - 21 took place in 2007, and the least - 1 in 2006. The data has a growing trend.
When looking into fire subcategories, the most reports belonged to: Outside Fires (52.8%), and Structure Fires (28.3%).
Fire incident types reported to NFIRS in Zip Code 93604


 Nearest zip codes: 93643, 93669, 93644, 93605, 93623, 93645.
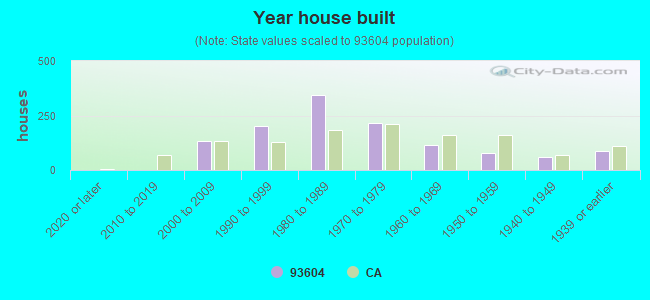


 Based on the data from the years 2006 - 2018 the average number of fires per year is 10. The highest number of reported fire incidents - 21 took place in 2007, and the least - 1 in 2006. The data has a growing trend.
 When looking into fire subcategories, the most reports belonged to: Outside Fires (52.8%), and Structure Fires (28.3%).