Estimated zip code population in 2022: 3,089 Zip code population in 2010: 3,171 Zip code population in 2000: 3,360
Houses and condos: 1,747 Renter-occupied apartments: 303
% of renters here:
22%
State:
44%
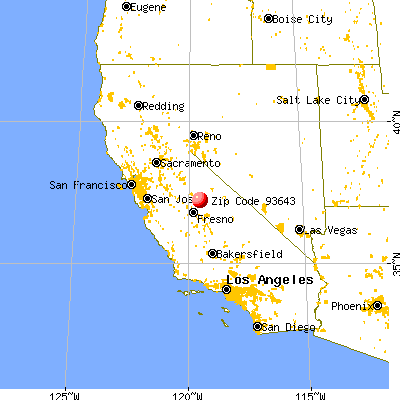
March 2022 cost of living index in zip code 93643: 95.3 (near average, U.S. average is 100)
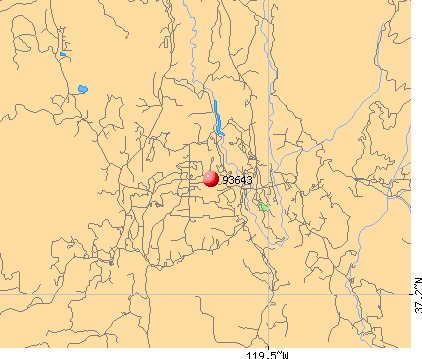
Land area: 124.5 sq. mi. Water area: 0.5 sq. mi.
Population density: 25 people per square mile
(very low).
OSM Map
General Map
Google Map
MSN Map
OSM Map
General Map
Google Map
MSN Map
OSM Map
General Map
Google Map
MSN Map
OSM Map
General Map
Google Map
MSN Map
Please wait while loading the map...
Real estate property taxes paid for housing units in 2022:
This zip code:
0.6% ($2,131)
California:
0.7% ($4,831)
Median real estate property taxes paid for housing units with mortgages in 2022: $2,441 (0.6%) Median real estate property taxes paid for housing units with no mortgage in 2022: $1,968 (0.6%)
Business Search- 14 Million verified businesses
Males: 1,605
(52.0%)
Females: 1,483
(48.0%)
For population 25 years and over in 93643:
High school or higher: 87.8%
Bachelor's degree or higher: 19.6%
Graduate or professional degree: 6.6%
Unemployed: 15.5%
Mean travel time to work (commute): 27.1 minutes
For population 15 years and over in 93643:
Never married: 18.0%
Now married: 51.7%
Separated: 2.3%
Widowed: 5.3%
Divorced: 22.6%
Zip code 93643 compared to state average:
Median house value below state average.
Unemployed percentage significantly above state average.
Black race population percentage significantly below state average.
Hispanic race population percentage significantly below state average.
Median age significantly above state average.
Foreign-born population percentage significantly below state average.
Renting percentage below state average.
Length of stay since moving in significantly above state average.
Percentage of population with a bachelor's degree or higher below state average.
Averages for the 2020 tax year for zip code 93643, filed in 2021:
Average Adjusted Gross Income (AGI) in 2020: $59,179 (Individual Income Tax Returns)
Here:
$59,179
State:
$95,910
Salary/wage: $46,216 (reported on 65.7% of returns)
Here:
$46,216
State:
$77,331
(% of AGI for various income ranges: 1086.4% for AGIs below $25k, 3127.0% for AGIs $25k-50k, 5905.5% for AGIs $50k-75k, 7897.1% for AGIs $75k-100k, 13300.0% for AGIs $100k-200k)
Taxable interest for individuals: $986 (reported on 40.0% of returns)
This zip code:
$986
California:
$2,294
(% of AGI for various income ranges: 50.4% for AGIs below $25k, 43.9% for AGIs $25k-50k, 59.1% for AGIs $50k-75k, 188.6% for AGIs $75k-100k, 81.0% for AGIs $100k-200k)
Ordinary dividends: $4,020 (reported on 17.9% of returns)
Here:
$4,020
State:
$10,949
(% of AGI for various income ranges: 52.9% for AGIs below $25k, 77.8% for AGIs $25k-50k, 125.5% for AGIs $50k-75k, 190.0% for AGIs $75k-100k, 288.0% for AGIs $100k-200k)
Net capital gain/loss in AGI: +$7,504 (reported on 18.6% of returns)
Here:
+$7,504
State:
+$49,306
(% of AGI for various income ranges: 66.1% for AGIs $25k-50k, 176.4% for AGIs $50k-75k, 475.7% for AGIs $75k-100k, 766.0% for AGIs $100k-200k)
Profit/loss from business: +$11,487 (reported on 21.4% of returns)
Here:
+$11,487
State:
+$15,671
(% of AGI for various income ranges: 234.3% for AGIs below $25k, 283.0% for AGIs $25k-50k, 441.8% for AGIs $50k-75k, 440.0% for AGIs $75k-100k, 1345.0% for AGIs $100k-200k)
Taxable individual retirement arrangement distribution: $17,013 (reported on 10.7% of returns)
93643:
$17,013
California:
$23,505
(% of AGI for various income ranges: 70.7% for AGIs below $25k, 130.4% for AGIs $25k-50k, 445.5% for AGIs $50k-75k, 434.3% for AGIs $75k-100k, 1260.0% for AGIs $100k-200k)
Total itemized deductions: $31,785 (reported on 9.3% of returns)
Here:
$31,785
State:
$39,517
(% of AGI for various income ranges: 806.4% for AGIs $50k-75k, 964.3% for AGIs $75k-100k, 1529.0% for AGIs $100k-200k)
Charity contributions: $8,422 (reported on 6.4% of returns)
Here:
$8,422
State:
$12,598
(% of AGI for various income ranges: 18.2% for AGIs below $25k, 238.6% for AGIs $75k-100k, 540.0% for AGIs $100k-200k)
Taxes paid: $7,392 (reported on 9.3% of returns)
93643:
$7,392
State:
$8,807
(% of AGI for various income ranges: 171.8% for AGIs $50k-75k, 271.4% for AGIs $75k-100k, 360.0% for AGIs $100k-200k)
Earned income credit: $2,235 (reported on 18.6% of returns)
Here:
$2,235
State:
$2,074
(% of AGI for various income ranges: 118.9% for AGIs below $25k, 107.8% for AGIs $25k-50k)
Percentage of individuals using paid preparers for their 2020 taxes: 91.4%
Here:
91%
State:
92%
(% for various income ranges: 87.5% for AGIs below $25k, 91.4% for AGIs $25k-50k, 95.0% for AGIs $50k-75k, 92.3% for AGIs $75k-100k, 94.7% for AGIs $100k-200k, 100.0% for AGIs over 200k)
Averages for the 2012 tax year for zip code 93643, filed in 2013:
Average Adjusted Gross Income (AGI) in 2012: $51,437 (Individual Income Tax Returns)
Here:
$51,437
State:
$72,726
Salary/wage: $41,018 (reported on 67.5% of returns)
Here:
$41,018
State:
$59,079
(% of AGI for various income ranges: 55.2% for AGIs below $25k, 57.8% for AGIs $25k-50k, 53.4% for AGIs $50k-75k, 61.2% for AGIs $75k-100k, 57.1% for AGIs $100k-200k, 36.1% for AGIs over 200k)
Taxable interest for individuals: $1,128 (reported on 42.9% of returns)
This zip code:
$1,128
California:
$2,146
(% of AGI for various income ranges: 1.8% for AGIs below $25k, 1.5% for AGIs $25k-50k, 1.2% for AGIs $50k-75k, 0.8% for AGIs $75k-100k, 0.6% for AGIs $100k-200k, 0.2% for AGIs over 200k)
Ordinary dividends: $3,123 (reported on 20.6% of returns)
Here:
$3,123
State:
$9,308
(% of AGI for various income ranges: 2.0% for AGIs below $25k, 1.9% for AGIs $25k-50k, 1.1% for AGIs $50k-75k, 1.1% for AGIs $75k-100k, 1.5% for AGIs $100k-200k)
Net capital gain/loss in AGI: +$5,105 (reported on 16.7% of returns)
Here:
+$5,105
State:
+$30,460
(% of AGI for various income ranges: 1.1% for AGIs $50k-75k, 0.2% for AGIs $75k-100k, 6.0% for AGIs $100k-200k)
Profit/loss from business: +$10,033 (reported on 21.4% of returns)
Here:
+$10,033
State:
+$17,064
(% of AGI for various income ranges: 13.6% for AGIs below $25k, 6.4% for AGIs $25k-50k, 6.5% for AGIs $50k-75k, 2.4% for AGIs $75k-100k, 1.3% for AGIs $100k-200k)
Taxable individual retirement arrangement distribution: $14,506 (reported on 13.5% of returns)
93643:
$14,506
California:
$19,557
(% of AGI for various income ranges: 2.9% for AGIs below $25k, 3.6% for AGIs $25k-50k, 3.4% for AGIs $50k-75k, 4.4% for AGIs $75k-100k, 6.7% for AGIs $100k-200k)
Total itemized deductions: $24,667 (27% of AGI, reported on 33.3% of returns)
Here:
$24,667
State:
$34,004
Here:
26.8% of AGI
State:
22.7% of AGI
(% of AGI for various income ranges: 16.4% for AGIs below $25k, 11.8% for AGIs $25k-50k, 12.8% for AGIs $50k-75k, 17.7% for AGIs $75k-100k, 18.3% for AGIs $100k-200k, 18.5% for AGIs over 200k)
Charity contributions: $3,644 (reported on 27.0% of returns)
Here:
$3,644
State:
$4,659
(% of AGI for various income ranges: 1.0% for AGIs below $25k, 0.7% for AGIs $25k-50k, 2.0% for AGIs $50k-75k, 2.9% for AGIs $75k-100k, 2.0% for AGIs $100k-200k, 2.5% for AGIs over 200k)
Taxes paid: $7,533 (reported on 33.3% of returns)
93643:
$7,533
State:
$14,448
(% of AGI for various income ranges: 2.8% for AGIs below $25k, 2.3% for AGIs $25k-50k, 2.9% for AGIs $50k-75k, 4.5% for AGIs $75k-100k, 6.8% for AGIs $100k-200k, 8.5% for AGIs over 200k)
Earned income credit: $2,071 (reported on 19.0% of returns)
Here:
$2,071
State:
$2,286
(% of AGI for various income ranges: 6.2% for AGIs below $25k, 1.1% for AGIs $25k-50k)
Percentage of individuals using paid preparers for their 2012 taxes: 53.2%
Here:
53%
State:
64%
(% for various income ranges: 44.9% for AGIs below $25k, 51.6% for AGIs $25k-50k, 61.1% for AGIs $50k-75k, 53.8% for AGIs $75k-100k, 75.0% for AGIs $100k-200k, 66.7% for AGIs over 200k)
Averages for the 2004 tax year for zip code 93643, filed in 2005:
Average Adjusted Gross Income (AGI) in 2004: $40,812 (Individual Income Tax Returns)
Here:
$40,812
State:
$58,600
Salary/wage: $33,659 (reported on 73.8% of returns)
Here:
$33,659
State:
$49,455
(% of AGI for various income ranges: 106.3% for AGIs below $10k, 58.4% for AGIs $10k-25k, 65.2% for AGIs $25k-50k, 68.5% for AGIs $50k-75k, 65.5% for AGIs $75k-100k, 44.8% for AGIs over 100k)
Taxable interest for individuals: $1,485 (reported on 51.4% of returns)
This zip code:
$1,485
California:
$2,365
(% of AGI for various income ranges: 10.5% for AGIs below $10k, 2.9% for AGIs $10k-25k, 1.9% for AGIs $25k-50k, 1.3% for AGIs $50k-75k, 1.6% for AGIs $75k-100k, 1.6% for AGIs over 100k)
Taxable dividends: $1,942 (reported on 25.9% of returns)
Here:
$1,942
State:
$4,746
(% of AGI for various income ranges: 9.0% for AGIs below $10k, 1.1% for AGIs $10k-25k, 1.2% for AGIs $25k-50k, 1.1% for AGIs $50k-75k, 1.3% for AGIs $75k-100k, 0.9% for AGIs over 100k)
Net capital gain/loss: +$7,210 (reported on 23.4% of returns)
Here:
+$7,210
State:
+$23,418
(% of AGI for various income ranges: -3.5% for AGIs below $10k, 1.7% for AGIs $10k-25k, 0.8% for AGIs $25k-50k, 1.3% for AGIs $50k-75k, 3.0% for AGIs $75k-100k, 12.2% for AGIs over 100k)
Profit/loss from business: +$11,903 (reported on 21.9% of returns)
Here:
+$11,903
State:
+$16,826
(% of AGI for various income ranges: 6.1% for AGIs below $10k, 9.4% for AGIs $10k-25k, 6.6% for AGIs $25k-50k, 3.3% for AGIs $50k-75k, 6.3% for AGIs $75k-100k, 8.2% for AGIs over 100k)
IRA payment deduction: $3,536 (reported on 4.0% of returns)
93643:
$3,536
California:
$3,192
(% of AGI for various income ranges: 0.4% for AGIs $10k-25k, 0.7% for AGIs $25k-50k, 0.3% for AGIs $50k-75k, 0.4% for AGIs $75k-100k)
Self-employed pension: $9,923 (reported on 0.9% of returns)
Here:
$9,923
California:
$17,688
Total itemized deductions: $19,807 (29% of AGI, reported on 33.9% of returns)
Here:
$19,807
State:
$28,113
Here:
28.8% of AGI
State:
25.3% of AGI
(% of AGI for various income ranges: 74.5% for AGIs below $10k, 13.5% for AGIs $10k-25k, 13.8% for AGIs $25k-50k, 15.9% for AGIs $50k-75k, 17.0% for AGIs $75k-100k, 16.8% for AGIs over 100k)
Charity contributions deductions: $2,630 (4% of AGI, reported on 29.4% of returns)
Here:
$2,630
State:
$3,923
Here:
3.7% of AGI
State:
3.3% of AGI
(% of AGI for various income ranges: 2.7% for AGIs below $10k, 1.3% for AGIs $10k-25k, 1.7% for AGIs $25k-50k, 1.6% for AGIs $50k-75k, 2.9% for AGIs $75k-100k, 2.0% for AGIs over 100k)
Total tax: $5,469 (reported on 75.7% of returns)
93643:
$5,469
State:
$10,761
(% of AGI for various income ranges: 4.0% for AGIs below $10k, 4.4% for AGIs $10k-25k, 7.0% for AGIs $25k-50k, 8.7% for AGIs $50k-75k, 10.5% for AGIs $75k-100k, 17.0% for AGIs over 100k)
Earned income credit: $1,534 (reported on 13.4% of returns)
Here:
$1,534
State:
$1,763
Percentage of individuals using paid preparers for their 2004 taxes: 60.4%
Here:
60%
State:
66%
(% for various income ranges: 50.2% for AGIs below $10k, 57.0% for AGIs $10k-25k, 65.3% for AGIs $25k-50k, 60.3% for AGIs $50k-75k, 70.2% for AGIs $75k-100k, 77.4% for AGIs over 100k)
Notable locations in zip code 93643: Camp Five Campground (A), Whites Cabin (B), Hole Ranch (C), Whiskers Campground (D), Mammoth Pool Powerhouse (E), Whiskey Falls Campground (F), Cascadel Ranch (G), Hogue Ranch (H), Powerhouse Number Three (I), Redinger Boat Ramp (J), Clearwater Forest Service Station (K), Minarets Ranger Station (L), Goat Mountain Lookout (M), Wishon Powerhouse (N), Powerhouse Number Eight (O), Powerhouse Number One A (P), Powerhouse (Q), Lion Point Fire Lane (R), Sierra-Mono Indian Museum (S), North Fork Town Hall (T). Display/hide their locations on the map
Lakes and reservoirs: Lake Moic (A), Kerckhoff Lake (B), Corrine Lake (C), Dam Six Lake (D), Redinger Lake (E), Manzanita Lake (F). Display/hide their locations on the map
Creeks: Indian Creek (A), Fish Creek (B), Ciatana Creek (C), Saginaw Creek (D), Ross Creek (E), Peckinpah Creek (F), Pitcher Creek (G), Hookers Creek (H), Gertrude Creek (I). Display/hide their locations on the map
271 married couples with children.
74 single-parent households (22 men, 52 women).
94.0% of residents of 93643 zip code speak English at home.
4.4% of residents speak Spanish at home (100% very well).
0.1% of residents speak other Indo-European language at home (100% very well).
1.4% of residents speak Asian or Pacific Island language at home (100% very well).
0.9% of residents speak other language at home (93% very well, 7% not at all).
Foreign born population: 169 (5.5%) (63.7% of them are naturalized citizens)
This zip code:
5.5%
Whole state:
26.7%
38%Honduras
13%Singapore
12%Sweden
8%France
7%Greece
2%Laos
14%English
9%German
6%Dutch
6%Irish
6%Italian
4%Polish
4%American
Year of entry for the foreign-born population
292010 or later
02000 to 2009
421990 to 1999
94Before 1990
Facilities with environmental interests located in this zip code:
MANZANITA COMMUNITY DAY (33087 ROAD 228 in NORTH FORK, CA)
(National Center for Education Statistics) - STATE ID-6113948 Organizations: CHAWANAKEE JOINT UNIFIED (SCHOOL DISTRICT)
MOUNTAIN OAKS HIGH SCHOOL (33030 ROAD 228 in NORTH FORK, CA)
(National Center for Education Statistics) - STATE ID-0100180 Organizations: CHAWANAKEE JOINT UNIFIED (SCHOOL DISTRICT)
NORTH FORK ELEMENTARY (33087 ROAD 228 in NORTH FORK, CA)
(National Center for Education Statistics) - STATE ID-6024079 Organizations: CHAWANAKEE JOINT UNIFIED (SCHOOL DISTRICT)
North Fork Mill (57839 ROAD 225 in NORTH FORK, CA)
CRITERIA AND HAZARDOUS AIR POLLUTANT INVENTORY (Inventory of air pollution sources) Small Quantity Generators, between 100 kg and 1000 kg of hazardous waste/month (Resource Conservation and Recovery Act (tracking hazardous waste)) - notification TARGETED BROWNFIELDS ASSESSMENT (TBA) Business SIC classification: SAWMILLS AND PLANING MILLS, GENERAL; ELECTRIC AND OTHER SERVICES COMBINED; REFUSE SYSTEMS Business NAICS classification: BEET SUGAR MANUFACTURING.; SAWMILLS.; SOLID WASTE LANDFILL. Organizations: SOUTH FORK TIMBER IND INC (CONTACT/OWNER)
Alternative names: AMERICAN FOREST PRODUCTS MILL, DINUBA TIMBER INC NORTH FORK, GARY ROGERS, NORTH FORK ENERGY INCORPORATED, NORTH FORK MILL SITE, SEQUOIA FOREST INDUSTRIES
NORTH FORK DUMP (3699 ROAD 274, NORTH FORK in NORTH FORK, CA)
CRITERIA AND HAZARDOUS AIR POLLUTANT INVENTORY (Inventory of air pollution sources) Business SIC classification: REFUSE SYSTEMS Business NAICS classification: SOLID WASTE LANDFILL.
NORTH FORK RANCHERIA (ROAD 222 AND ROAD 225 in NORTH FORK, CA) . Tribal Land
ENFORCEMENT/COMPLIANCE ACTIVITY (Integrated Compliance Information System)
Housing units lacking complete plumbing facilities: 0.5% Housing units lacking complete kitchen facilities: 0.9%
52.4%Wood
37.3%Bottled, tank, or LP gas
5.7%Electricity
2.2%No fuel used
1.4%Other fuel
1.2%Utility gas
Population in 1990: 2,541. Population change in the 1990s: +819 (+32.2%).
Place of birth for U.S.-born residents:
This state: 2,351
Northeast: 201
Midwest: 161
South: 101
West: 99
57% of the 93643 zip code residents lived in the same house 5 years ago. Out of people who lived in different houses, 47% lived in this county. Out of people who lived in different counties, 50% lived in California.
95% of the 93643 zip code residents lived in the same house 1 year ago. Out of people who lived in different houses, 65% moved from this county. Out of people who lived in different houses, 12% moved from different county within same state. Out of people who lived in different houses, 28% moved from different state.
Private vs. public school enrollment:
Students in private schools in grades 1 to 8 (elementary and middle school): 7
Here:
3.8%
California:
10.5%
Students in private schools in grades 9 to 12 (high school): 1
Here:
0.5%
California:
8.5%
Students in private undergraduate colleges: 17
Here:
13.7%
California:
15.9%
Occupation by median earnings in the past 12 months ($)
134,739Health diagnosing and treating practitioners and other technical occupations
98,503Construction and extraction occupations
49,295Management occupations
31,066Sales and related occupations
29,576Office and administrative support occupations
28,783Food preparation and serving related occupations
Top industries in this zip code by the number of employees in 2005:
Professional, Scientific, and Technical Services: Administrative Management and General Management Consulting Services (20-49 employees: 1 establishment)
Health Care and Social Assistance: Other Individual and Family Services (10-19: 1, 1-4: 1)
Construction: Site Preparation Contractors (5-9: 1, 1-4: 1)
Health Care and Social Assistance: Child Day Care Services (5-9: 1, 1-4: 1)
Health Care and Social Assistance: All Other Outpatient Care Centers (5-9: 1)
Educational Services: Elementary and Secondary Schools (5-9: 1)
People in group quarters in 2000:
3 people in other noninstitutional group quarters
Fatal accident statistics in 2014:
Fatal accident count: 1
Vehicles involved in fatal accidents: 2
Fatal accidents caused by drunken drivers: 1
Fatalities: 2
Persons involved in fatal accidents: 2
Pedestrians involved in fatal accidents: 0
Fatal accident statistics in 2012:
Fatal accident count: 2
Vehicles involved in fatal accidents: 2
Fatal accidents caused by drunken drivers: 2
Fatalities: 2
Persons involved in fatal accidents: 4
Pedestrians involved in fatal accidents: 0
Home Mortgage Disclosure Act Aggregated Statistics For Year 2009 (Based on 2 partial tracts)
A) FHA, FSA/RHS & VA Home Purchase Loans
B) Conventional Home Purchase Loans
C) Refinancings
D) Home Improvement Loans
F) Non-occupant Loans on < 5 Family Dwellings (A B C & D)
G) Loans On Manufactured Home Dwelling (A B C & D)
Number
Average Value
Number
Average Value
Number
Average Value
Number
Average Value
Number
Average Value
Number
Average Value
LOANS ORIGINATED
6
$167,188
21
$266,532
70
$248,682
5
$121,598
39
$292,523
4
$96,432
APPLICATIONS APPROVED, NOT ACCEPTED
0
$0
4
$322,812
8
$240,271
0
$0
3
$279,693
1
$41,750
APPLICATIONS DENIED
1
$134,650
5
$329,750
39
$285,301
5
$182,632
15
$365,227
1
$132,890
APPLICATIONS WITHDRAWN
1
$72,910
1
$230,500
11
$254,390
0
$0
3
$290,080
2
$134,945
FILES CLOSED FOR INCOMPLETENESS
1
$52,920
0
$0
6
$232,162
0
$0
1
$216,380
0
$0
Aggregated Statistics For Year 2008 (Based on 2 partial tracts)
A) FHA, FSA/RHS & VA Home Purchase Loans
B) Conventional Home Purchase Loans
C) Refinancings
D) Home Improvement Loans
F) Non-occupant Loans on < 5 Family Dwellings (A B C & D)
G) Loans On Manufactured Home Dwelling (A B C & D)
Number
Average Value
Number
Average Value
Number
Average Value
Number
Average Value
Number
Average Value
Number
Average Value
LOANS ORIGINATED
1
$107,020
14
$585,396
42
$281,764
6
$242,843
21
$400,540
5
$126,420
APPLICATIONS APPROVED, NOT ACCEPTED
0
$0
2
$192,570
6
$344,372
2
$361,915
2
$356,620
0
$0
APPLICATIONS DENIED
2
$150,235
5
$218,736
34
$261,383
4
$1,717,990
11
$816,999
5
$128,536
APPLICATIONS WITHDRAWN
0
$0
1
$205,800
11
$277,375
1
$155,820
2
$163,170
0
$0
FILES CLOSED FOR INCOMPLETENESS
1
$109,370
0
$0
4
$278,860
2
$282,240
1
$616,220
1
$109,370
Aggregated Statistics For Year 2007 (Based on 2 partial tracts)
A) FHA, FSA/RHS & VA Home Purchase Loans
B) Conventional Home Purchase Loans
C) Refinancings
D) Home Improvement Loans
F) Non-occupant Loans on < 5 Family Dwellings (A B C & D)
G) Loans On Manufactured Home Dwelling (A B C & D)
Number
Average Value
Number
Average Value
Number
Average Value
Number
Average Value
Number
Average Value
Number
Average Value
LOANS ORIGINATED
0
$0
31
$335,046
61
$311,582
14
$247,716
31
$392,632
4
$144,500
APPLICATIONS APPROVED, NOT ACCEPTED
1
$105,250
5
$219,088
18
$303,931
5
$449,820
8
$239,610
4
$96,138
APPLICATIONS DENIED
0
$0
8
$324,061
42
$396,746
9
$88,266
15
$335,199
4
$160,525
APPLICATIONS WITHDRAWN
0
$0
2
$822,025
16
$419,428
2
$133,770
5
$591,646
1
$115,840
FILES CLOSED FOR INCOMPLETENESS
0
$0
2
$570,360
8
$279,594
1
$123,480
3
$270,087
0
$0
Aggregated Statistics For Year 2006 (Based on 2 partial tracts)
A) FHA, FSA/RHS & VA Home Purchase Loans
B) Conventional Home Purchase Loans
C) Refinancings
D) Home Improvement Loans
F) Non-occupant Loans on < 5 Family Dwellings (A B C & D)
G) Loans On Manufactured Home Dwelling (A B C & D)
Number
Average Value
Number
Average Value
Number
Average Value
Number
Average Value
Number
Average Value
Number
Average Value
LOANS ORIGINATED
1
$221,680
38
$289,404
89
$309,579
17
$150,424
44
$390,913
7
$141,456
APPLICATIONS APPROVED, NOT ACCEPTED
0
$0
15
$221,401
19
$264,322
2
$473,635
7
$274,091
1
$50,570
APPLICATIONS DENIED
0
$0
15
$347,469
49
$477,252
11
$177,523
16
$420,678
8
$126,126
APPLICATIONS WITHDRAWN
0
$0
5
$472,282
34
$313,196
4
$166,405
8
$294,588
3
$136,023
FILES CLOSED FOR INCOMPLETENESS
0
$0
2
$326,340
8
$429,020
1
$96,430
3
$624,260
1
$96,430
Aggregated Statistics For Year 2005 (Based on 2 partial tracts)
A) FHA, FSA/RHS & VA Home Purchase Loans
B) Conventional Home Purchase Loans
C) Refinancings
D) Home Improvement Loans
F) Non-occupant Loans on < 5 Family Dwellings (A B C & D)
G) Loans On Manufactured Home Dwelling (A B C & D)
Number
Average Value
Number
Average Value
Number
Average Value
Number
Average Value
Number
Average Value
Number
Average Value
LOANS ORIGINATED
0
$0
42
$315,070
93
$262,027
20
$184,456
39
$415,188
10
$110,132
APPLICATIONS APPROVED, NOT ACCEPTED
0
$0
3
$275,967
16
$267,026
3
$13,720
4
$474,075
1
$28,220
APPLICATIONS DENIED
1
$105,250
18
$222,656
36
$336,058
14
$175,350
11
$315,382
9
$113,158
APPLICATIONS WITHDRAWN
0
$0
12
$294,637
44
$228,411
5
$98,314
5
$435,708
4
$143,325
FILES CLOSED FOR INCOMPLETENESS
0
$0
1
$470,400
9
$205,539
1
$46,450
1
$651,500
1
$46,450
Aggregated Statistics For Year 2004 (Based on 2 partial tracts)
A) FHA, FSA/RHS & VA Home Purchase Loans
B) Conventional Home Purchase Loans
C) Refinancings
D) Home Improvement Loans
F) Non-occupant Loans on < 5 Family Dwellings (A B C & D)
G) Loans On Manufactured Home Dwelling (A B C & D)
Number
Average Value
Number
Average Value
Number
Average Value
Number
Average Value
Number
Average Value
Number
Average Value
LOANS ORIGINATED
1
$88,790
71
$266,762
120
$229,786
9
$142,492
62
$320,650
6
$96,727
APPLICATIONS APPROVED, NOT ACCEPTED
1
$82,910
9
$290,014
24
$167,653
1
$29,400
7
$261,491
3
$112,113
APPLICATIONS DENIED
0
$0
23
$195,881
61
$173,441
11
$67,674
17
$227,556
7
$168,756
APPLICATIONS WITHDRAWN
1
$90,550
9
$261,464
44
$160,364
2
$121,130
4
$255,045
4
$113,925
FILES CLOSED FOR INCOMPLETENESS
0
$0
2
$152,290
10
$219,148
0
$0
1
$221,090
1
$55,270
Aggregated Statistics For Year 2003 (Based on 2 partial tracts)
B) Conventional Home Purchase Loans
C) Refinancings
D) Home Improvement Loans
F) Non-occupant Loans on < 5 Family Dwellings (A B C & D)
Number
Average Value
Number
Average Value
Number
Average Value
Number
Average Value
LOANS ORIGINATED
59
$239,794
215
$197,792
5
$63,152
85
$267,083
APPLICATIONS APPROVED, NOT ACCEPTED
6
$135,730
28
$192,675
1
$27,050
6
$275,772
APPLICATIONS DENIED
14
$147,462
66
$198,530
3
$85,260
15
$184,671
APPLICATIONS WITHDRAWN
8
$125,391
45
$185,403
2
$132,300
11
$262,943
FILES CLOSED FOR INCOMPLETENESS
4
$159,935
14
$326,172
0
$0
6
$186,102
Aggregated Statistics For Year 2002 (Based on 2 partial tracts)
A) FHA, FSA/RHS & VA Home Purchase Loans
B) Conventional Home Purchase Loans
C) Refinancings
D) Home Improvement Loans
E) Loans on Dwellings For 5+ Families
F) Non-occupant Loans on < 5 Family Dwellings (A B C & D)
Number
Average Value
Number
Average Value
Number
Average Value
Number
Average Value
Number
Average Value
Number
Average Value
LOANS ORIGINATED
2
$93,490
55
$176,742
137
$169,700
1
$38,220
1
$948,440
54
$190,566
APPLICATIONS APPROVED, NOT ACCEPTED
0
$0
9
$156,016
17
$170,139
1
$3,530
0
$0
6
$241,962
APPLICATIONS DENIED
1
$37,040
12
$153,909
26
$158,783
1
$43,510
1
$194,040
7
$203,951
APPLICATIONS WITHDRAWN
0
$0
3
$121,913
31
$154,113
1
$29,400
0
$0
5
$158,996
FILES CLOSED FOR INCOMPLETENESS
0
$0
1
$176,400
4
$145,825
0
$0
0
$0
1
$176,400
Aggregated Statistics For Year 2001 (Based on 2 partial tracts)
A) FHA, FSA/RHS & VA Home Purchase Loans
B) Conventional Home Purchase Loans
C) Refinancings
D) Home Improvement Loans
F) Non-occupant Loans on < 5 Family Dwellings (A B C & D)
Number
Average Value
Number
Average Value
Number
Average Value
Number
Average Value
Number
Average Value
LOANS ORIGINATED
3
$106,233
32
$174,508
81
$159,943
5
$60,212
38
$223,904
APPLICATIONS APPROVED, NOT ACCEPTED
0
$0
5
$162,524
6
$146,020
2
$55,860
3
$163,073
APPLICATIONS DENIED
1
$45,860
9
$187,114
28
$127,974
5
$23,168
6
$207,467
APPLICATIONS WITHDRAWN
1
$75,260
8
$141,561
22
$131,391
1
$29,400
7
$191,269
FILES CLOSED FOR INCOMPLETENESS
0
$0
4
$228,290
3
$120,737
1
$8,820
2
$254,605
Aggregated Statistics For Year 2000 (Based on 2 partial tracts)
A) FHA, FSA/RHS & VA Home Purchase Loans
B) Conventional Home Purchase Loans
C) Refinancings
D) Home Improvement Loans
F) Non-occupant Loans on < 5 Family Dwellings (A B C & D)
Number
Average Value
Number
Average Value
Number
Average Value
Number
Average Value
Number
Average Value
LOANS ORIGINATED
2
$96,725
39
$152,865
25
$132,747
4
$25,285
22
$185,407
APPLICATIONS APPROVED, NOT ACCEPTED
0
$0
5
$198,862
6
$146,803
1
$11,760
2
$400,720
APPLICATIONS DENIED
0
$0
7
$135,911
22
$101,590
2
$51,450
2
$141,710
APPLICATIONS WITHDRAWN
1
$46,450
3
$320,067
7
$104,580
0
$0
0
$0
FILES CLOSED FOR INCOMPLETENESS
0
$0
2
$163,465
2
$99,370
0
$0
1
$303,410
Aggregated Statistics For Year 1999 (Based on 1 partial tract)
B) Conventional Home Purchase Loans
C) Refinancings
D) Home Improvement Loans
F) Non-occupant Loans on < 5 Family Dwellings (A B C & D)
Detailed PMIC statistics for the following Tracts:0001.02
2005 - 2018 National Fire Incident Reporting System (NFIRS) incidents
Based on the data from the years 2005 - 2018 the average number of fires per year is 16. The highest number of fire incidents - 38 took place in 2017, and the least - 1 in 2005. The data has a rising trend.
When looking into fire subcategories, the most reports belonged to: Outside Fires (64.4%), and Structure Fires (16.7%).
Fire incident types reported to NFIRS in Zip Code 93643


 Nearest zip codes: 93669, 93604, 93645, 93605, 93644, 93651.


 Based on the data from the years 2005 - 2018 the average number of fires per year is 16. The highest number of fire incidents - 38 took place in 2017, and the least - 1 in 2005. The data has a rising trend.
 When looking into fire subcategories, the most reports belonged to: Outside Fires (64.4%), and Structure Fires (16.7%).