Estimated zip code population in 2022: 382
Zip code population in 2010: 472
Zip code population in 2000: 331
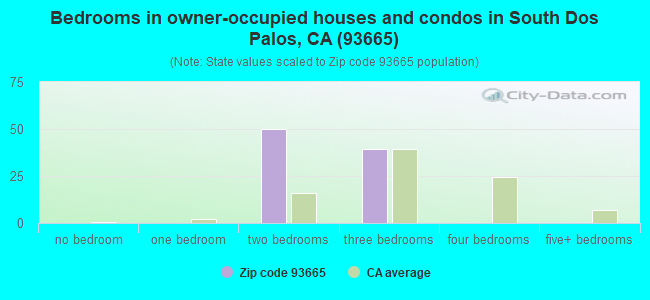
Houses and condos: 186
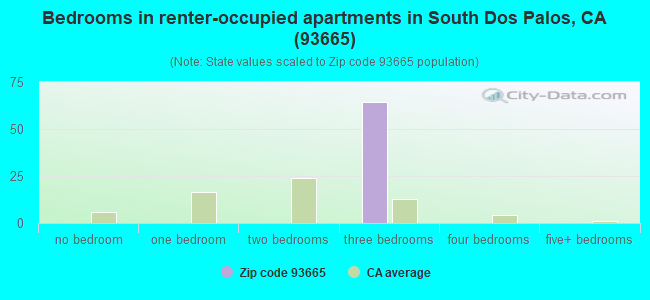
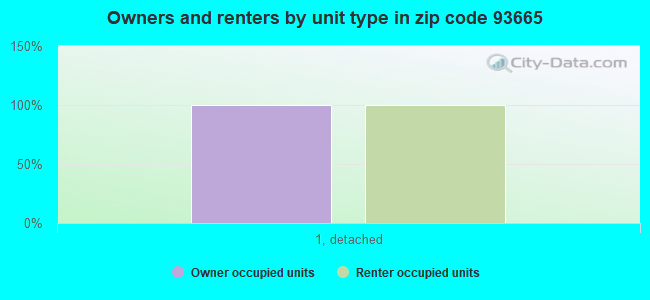
Renter-occupied apartments: 64
| % of renters here: | 42% |
| State: | 44% |
90.9
(less than average, U.S. average is 100)
Land area: 0.8
sq. mi.
Water area: 0.0
sq. mi.
| Population density: 454 people per square mile | | (low). |
![Age and Sex of Residents in zip code 93665]()
- OSM Map
- General Map
- Google Map
- MSN Map
- OSM Map
- General Map
- Google Map
- MSN Map
- OSM Map
- General Map
- Google Map
- MSN Map
- OSM Map
- General Map
- Google Map
- MSN Map
Please wait while loading the map...
Business Search - 14 Million verified businesses
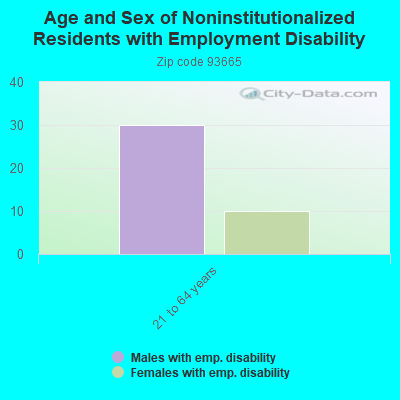
| Males: 102 |  (26.7%) (26.7%) |
| Females: 280 |  (73.3%) (73.3%) |
For population 25 years and over in 93665:
- High school or higher: 78.0%
- Bachelor's degree or higher: 0.0%
- Graduate or professional degree: 0.0%
- Unemployed: 22.3%
- Mean travel time to work (commute): 19.7 minutes
For population 15 years and over in 93665:
- Never married: 68.5%
- Now married: 0.0%
- Separated: 0.0%
- Widowed: 0.0%
- Divorced: 31.5%
Zip code 93665 compared to state average:
- Median household income significantly below state average.
- Median house value significantly below state average.
- Unemployed percentage significantly above state average.
- Black race population percentage significantly above state average.
- Hispanic race population percentage above state average.
- Foreign-born population percentage significantly below state average.
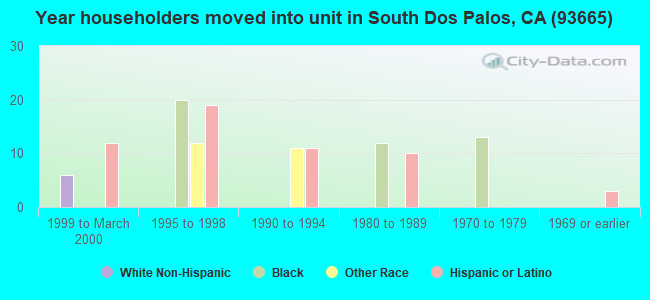
- Length of stay since moving in significantly above state average.
- House age above state average.
- Number of college students significantly below state average.
- Percentage of population with a bachelor's degree or higher significantly below state average.

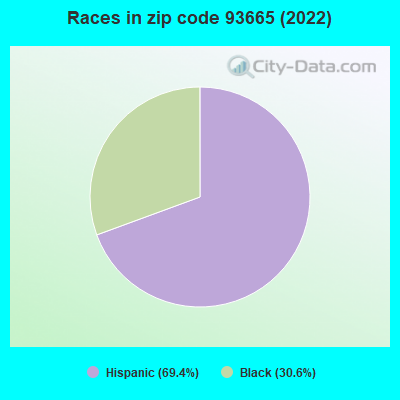
- 26569.4%Hispanic or Latino
- 11730.6%Black
Data:
Urban population: 285
Rural population: 96
Median resident age:| This zip code: | 36.3 years |
| California median age: | 37.9 years |
Average household size:| This zip code: | 2.5 people |
| California: | 2.8 people |
Averages for the 2004 tax year for zip code 93665, filed in 2005:
Average Adjusted Gross Income (AGI) in 2004: $31,020 (Individual Income Tax Returns)
| Here: | $31,020 |
| State: | $58,600 |
Salary/wage: $20,850 (reported on 96.9% of returns)
| Here: | $20,850 |
| State: | $49,455 |
(% of AGI for various income ranges: 81.0% for AGIs below $10k, 86.8% for AGIs $10k-25k, 85.3% for AGIs $25k-50k, 32.6% for AGIs $50k-75k)
Taxable interest for individuals: $4,756 (reported on 16.1% of returns)
| This zip code: | $4,756 |
| California: | $2,365 |
Profit/loss from business: +$5,333 (reported on 4.7% of returns)
| Here: | +$5,333 |
| State: | +$16,826 |
Total itemized deductions: $20,333 (22% of AGI, reported on 7.1% of returns)
| Here: | $20,333 |
| State: | $28,113 |
| Here: | 22.2% of AGI |
| State: | 25.3% of AGI |
Charity contributions deductions: $636 (0% of AGI, reported on 4.3% of returns)
| Here: | 0.5% of AGI |
| State: | 3.3% of AGI |
Total tax: $7,602 (reported on 40.4% of returns)
| 93665: | $7,602 |
| State: | $10,761 |
Earned income credit: $2,121 (reported on 45.5% of returns)
Percentage of individuals using paid preparers for their 2004 taxes: 70.2%
(% for various income ranges: 68.9% for AGIs below $10k, 70.6% for AGIs $10k-25k, 70.4% for AGIs $25k-50k, 70.0% for AGIs $50k-75k)
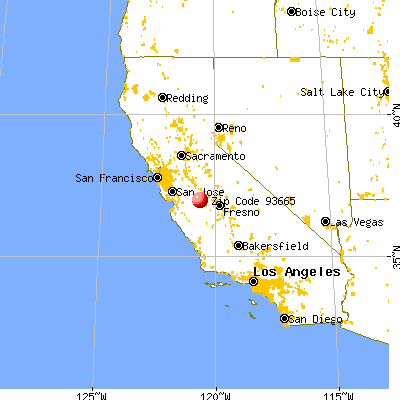
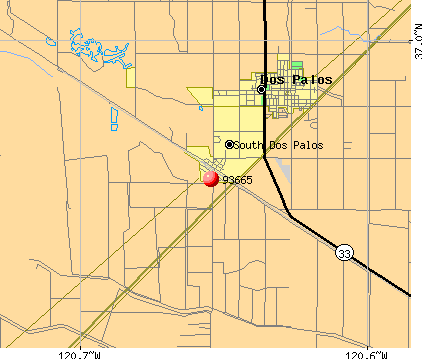
![South Dos Palos, CA (93665) map]() Nearest zip codes: 93620
Nearest zip codes: 93620,
93622,
95317,
93635,
95341,
93640.
South Dos Palos Zip Code Map
Percentage of family households:| This zip code: | 40.4% |
| California: | 46.8% |
Percentage of households with unmarried partners:| This zip code: | 29.2% |
| California: | 48.1% |
No gay or lesbian households reported
Household received Food Stamps/SNAP in the past 12 months: 0
Household did not receive Food Stamps/SNAP in the past 12 months: 151
Women who did not have a birth in the past 12 months: 203 (0 now married, 206 unmarried)
Residents with income below the poverty level in 2022:
| This zip code: | 17.6% |
| Whole state: | 12.2% |

- Year house built (houses)
- 02020 or later
- 02010 to 2019
- 02000 to 2009
- 01990 to 1999
- 271980 to 1989
- 361970 to 1979
- 381960 to 1969
- 491950 to 1959
- 01940 to 1949
- 321939 or earlier
![Zip code 93665 satellite photo by USGS]()
Zip code 93665 household income distribution in 2022
![Zip code 93665 household income distribution in 2022]()
- 29Less than $10,000
- 39$15,000 to $19,999
- 52$30,000 to $34,999
- 37$75,000 to $99,999
Estimate of home value of owner-occupied houses/condos in 2022 in zip code 93665
![Estimate of home value of owner-occupied houses/condos in 2022 in zip code 93665]()
- 46$80,000 to $89,999
- 35$200,000 to $249,999
Rent paid by renters in 2022 in zip code 93665
![Rent paid by renters in 2022 in zip code 93665]()
- 32$300 to $349
- 26$1,000 to $1,249
Estimated median house (or condo) value in 2022 for:
- Black or African American householders: $294,818
- Some other race householders: $239,801
- Hispanic or Latino householders: $243,974
Mean price in 2022:
Detached houses: $299,307| Here: | $299,307 |
| State: | $988,808 |
Housing units in structures:
Unemployment: 22.3%
Travel time to work (commute) in zip code 93665
![Travel time to work (commute) in zip code 93665]()
- 835 to 9 minutes
- 3490 or more minutes
Percentage of zip code residents living and working in this county: 72.1%
Household type by relationship:
Households: 382
- Male householders: 39 (41 living alone), Female householders: 117 (0 living alone)
0 spouses (0 opposite-sex spouses), 0 unmarried partners, (0 opposite-sex unmarried partners), 225 children (225 natural, 0 adopted, 0 stepchildren), 0 grandchildren, 0 brothers or sisters, 0 parents, 0 foster children, 0 other relatives, 0 non-relatives
Size of family households: 79 2-persons, 36 5-persons
Size of nonfamily households: 40 1-person
82.8% of residents of 93665 zip code speak English at home.
17.2% of residents speak Spanish at home (58% very well, 42% not at all).
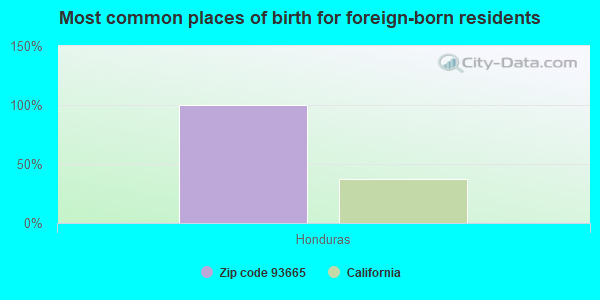
Foreign born population: 27 (7.1%)
(100.0%
of them are naturalized citizens)
| This zip code: | 7.1% |
| Whole state: | 26.7% |
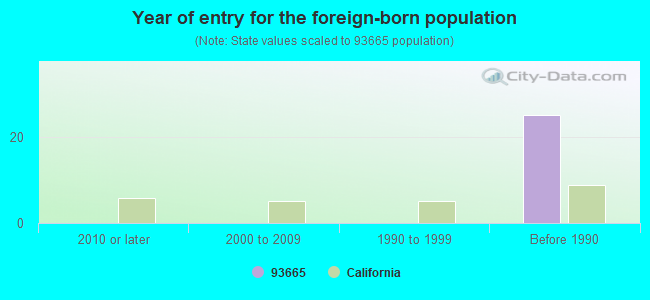
- Year of entry for the foreign-born population
- 02010 or later
- 02000 to 2009
- 01990 to 1999
- 25Before 1990
![Zip code 93665 topographic map]()
Facilities with environmental interests located in this zip code:
- KODA FARMS INC (22540 SOUTH LEXINGTON AVENUE in SOUTH DOS PALOS, CA)

CRITERIA AND HAZARDOUS AIR POLLUTANT INVENTORY (Inventory of air pollution sources)
Business SIC classification: RICE MILLING
Housing units lacking complete plumbing facilities: 16.8%
Housing units lacking complete kitchen facilities: 15.8%
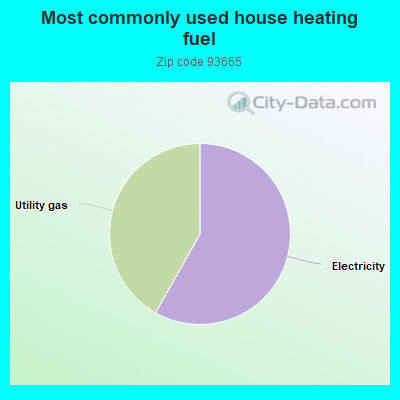
- 58.4%Electricity
- 42.0%Utility gas
Place of birth for U.S.-born residents:
57% of the 93665 zip code residents lived in the same house 5 years ago.
Out of people who lived in different houses, 49% lived in this county.
100% of the 93665 zip code residents lived in the same house 1 year ago.
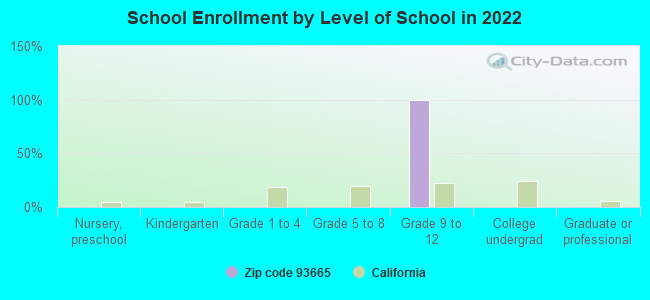
Students in private schools in grades 9 to 12 (high school):
Top industries in this zip code by the number of employees in 2005:
- Health Care and Social Assistance: Child Day Care Services (10-19 employees: 2 establishments, 1-4 employees: 1 establishment)
- Health Care and Social Assistance: Services for the Elderly and Persons with Disabilities (1-4: 1)
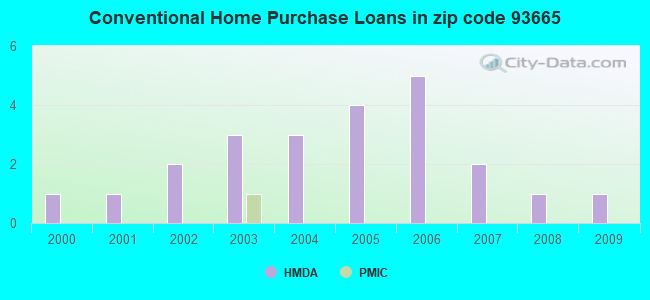
Home Mortgage Disclosure Act Aggregated Statistics For Year 2009
(Based on 2 partial tracts)
|
| A) FHA, FSA/RHS & VA
Home Purchase Loans | B) Conventional
Home Purchase Loans |
|---|
| Number | Average Value | Number | Average Value |
|---|
| LOANS ORIGINATED | 2 | $91,680 | 1 | $45,610 |
| APPLICATIONS APPROVED, NOT ACCEPTED | 0 | $0 | 0 | $0 |
| APPLICATIONS DENIED | 1 | $48,340 | 0 | $0 |
| APPLICATIONS WITHDRAWN | 0 | $0 | 0 | $0 |
| FILES CLOSED FOR INCOMPLETENESS | 0 | $0 | 0 | $0 |
Aggregated Statistics For Year 2008
(Based on 2 partial tracts)
|
| A) FHA, FSA/RHS & VA
Home Purchase Loans | B) Conventional
Home Purchase Loans | C) Refinancings
|
|---|
| Number | Average Value | Number | Average Value | Number | Average Value |
|---|
| LOANS ORIGINATED | 1 | $208,540 | 1 | $114,910 | 1 | $95,510 |
| APPLICATIONS APPROVED, NOT ACCEPTED | 0 | $0 | 0 | $0 | 0 | $0 |
| APPLICATIONS DENIED | 0 | $0 | 0 | $0 | 2 | $165,430 |
| APPLICATIONS WITHDRAWN | 0 | $0 | 0 | $0 | 0 | $0 |
| FILES CLOSED FOR INCOMPLETENESS | 0 | $0 | 0 | $0 | 0 | $0 |
Aggregated Statistics For Year 2007
(Based on 2 partial tracts)
|
| B) Conventional
Home Purchase Loans | C) Refinancings
| D) Home Improvement Loans
| F) Non-occupant Loans on
< 5 Family Dwellings (A B C & D) |
|---|
| Number | Average Value | Number | Average Value | Number | Average Value | Number | Average Value |
|---|
| LOANS ORIGINATED | 2 | $149,890 | 3 | $202,007 | 0 | $0 | 1 | $126,760 |
| APPLICATIONS APPROVED, NOT ACCEPTED | 0 | $0 | 1 | $241,130 | 0 | $0 | 0 | $0 |
| APPLICATIONS DENIED | 1 | $285,120 | 4 | $231,320 | 1 | $72,980 | 1 | $144,840 |
| APPLICATIONS WITHDRAWN | 0 | $0 | 1 | $316,520 | 0 | $0 | 0 | $0 |
| FILES CLOSED FOR INCOMPLETENESS | 0 | $0 | 1 | $176,310 | 0 | $0 | 0 | $0 |
Aggregated Statistics For Year 2006
(Based on 2 partial tracts)
|
| B) Conventional
Home Purchase Loans | C) Refinancings
| D) Home Improvement Loans
| F) Non-occupant Loans on
< 5 Family Dwellings (A B C & D) |
|---|
| Number | Average Value | Number | Average Value | Number | Average Value | Number | Average Value |
|---|
| LOANS ORIGINATED | 5 | $170,966 | 5 | $226,534 | 1 | $132,360 | 1 | $182,720 |
| APPLICATIONS APPROVED, NOT ACCEPTED | 1 | $249,380 | 2 | $156,260 | 0 | $0 | 0 | $0 |
| APPLICATIONS DENIED | 2 | $170,910 | 4 | $202,418 | 1 | $94,660 | 1 | $129,750 |
| APPLICATIONS WITHDRAWN | 2 | $244,185 | 2 | $248,350 | 0 | $0 | 0 | $0 |
| FILES CLOSED FOR INCOMPLETENESS | 0 | $0 | 1 | $215,030 | 0 | $0 | 0 | $0 |
Aggregated Statistics For Year 2005
(Based on 2 partial tracts)
|
| B) Conventional
Home Purchase Loans | C) Refinancings
| D) Home Improvement Loans
| F) Non-occupant Loans on
< 5 Family Dwellings (A B C & D) |
|---|
| Number | Average Value | Number | Average Value | Number | Average Value | Number | Average Value |
|---|
| LOANS ORIGINATED | 4 | $162,648 | 6 | $175,345 | 1 | $84,530 | 1 | $138,760 |
| APPLICATIONS APPROVED, NOT ACCEPTED | 1 | $132,310 | 1 | $226,690 | 0 | $0 | 0 | $0 |
| APPLICATIONS DENIED | 2 | $156,790 | 4 | $161,155 | 1 | $86,460 | 0 | $0 |
| APPLICATIONS WITHDRAWN | 1 | $112,020 | 3 | $152,957 | 0 | $0 | 0 | $0 |
| FILES CLOSED FOR INCOMPLETENESS | 0 | $0 | 1 | $112,280 | 0 | $0 | 0 | $0 |
Aggregated Statistics For Year 2004
(Based on 2 partial tracts)
|
| B) Conventional
Home Purchase Loans | C) Refinancings
| F) Non-occupant Loans on
< 5 Family Dwellings (A B C & D) |
|---|
| Number | Average Value | Number | Average Value | Number | Average Value |
|---|
| LOANS ORIGINATED | 3 | $131,957 | 5 | $142,352 | 1 | $167,140 |
| APPLICATIONS APPROVED, NOT ACCEPTED | 1 | $97,160 | 1 | $175,620 | 0 | $0 |
| APPLICATIONS DENIED | 1 | $109,380 | 4 | $117,132 | 0 | $0 |
| APPLICATIONS WITHDRAWN | 1 | $94,920 | 3 | $117,613 | 0 | $0 |
| FILES CLOSED FOR INCOMPLETENESS | 0 | $0 | 1 | $148,460 | 0 | $0 |
Aggregated Statistics For Year 2003
(Based on 2 partial tracts)
|
| A) FHA, FSA/RHS & VA
Home Purchase Loans | B) Conventional
Home Purchase Loans | C) Refinancings
| F) Non-occupant Loans on
< 5 Family Dwellings (A B C & D) |
|---|
| Number | Average Value | Number | Average Value | Number | Average Value | Number | Average Value |
|---|
| LOANS ORIGINATED | 1 | $91,870 | 3 | $99,157 | 5 | $113,762 | 1 | $83,730 |
| APPLICATIONS APPROVED, NOT ACCEPTED | 0 | $0 | 0 | $0 | 1 | $128,460 | 0 | $0 |
| APPLICATIONS DENIED | 0 | $0 | 1 | $88,080 | 3 | $101,623 | 0 | $0 |
| APPLICATIONS WITHDRAWN | 0 | $0 | 0 | $0 | 2 | $97,050 | 0 | $0 |
| FILES CLOSED FOR INCOMPLETENESS | 0 | $0 | 0 | $0 | 0 | $0 | 0 | $0 |
Aggregated Statistics For Year 2002
(Based on 2 partial tracts)
|
| B) Conventional
Home Purchase Loans | C) Refinancings
|
|---|
| Number | Average Value | Number | Average Value |
|---|
| LOANS ORIGINATED | 2 | $90,295 | 3 | $96,327 |
| APPLICATIONS APPROVED, NOT ACCEPTED | 0 | $0 | 1 | $72,490 |
| APPLICATIONS DENIED | 0 | $0 | 2 | $117,355 |
| APPLICATIONS WITHDRAWN | 0 | $0 | 2 | $87,035 |
| FILES CLOSED FOR INCOMPLETENESS | 0 | $0 | 0 | $0 |
Aggregated Statistics For Year 2001
(Based on 2 partial tracts)
|
| B) Conventional
Home Purchase Loans | C) Refinancings
|
|---|
| Number | Average Value | Number | Average Value |
|---|
| LOANS ORIGINATED | 1 | $78,960 | 2 | $102,260 |
| APPLICATIONS APPROVED, NOT ACCEPTED | 0 | $0 | 0 | $0 |
| APPLICATIONS DENIED | 0 | $0 | 2 | $78,380 |
| APPLICATIONS WITHDRAWN | 0 | $0 | 1 | $151,150 |
| FILES CLOSED FOR INCOMPLETENESS | 0 | $0 | 0 | $0 |
Aggregated Statistics For Year 2000
(Based on 2 partial tracts)
|
| B) Conventional
Home Purchase Loans | C) Refinancings
|
|---|
| Number | Average Value | Number | Average Value |
|---|
| LOANS ORIGINATED | 1 | $77,030 | 1 | $49,020 |
| APPLICATIONS APPROVED, NOT ACCEPTED | 0 | $0 | 0 | $0 |
| APPLICATIONS DENIED | 1 | $63,440 | 1 | $70,940 |
| APPLICATIONS WITHDRAWN | 0 | $0 | 1 | $44,300 |
| FILES CLOSED FOR INCOMPLETENESS | 0 | $0 | 0 | $0 |
Aggregated Statistics For Year 1999
(Based on 1 partial tract)
|
| C) Refinancings
|
|---|
| Number | Average Value |
|---|
| LOANS ORIGINATED | 1 | $45,680 |
| APPLICATIONS APPROVED, NOT ACCEPTED | 0 | $0 |
| APPLICATIONS DENIED | 1 | $41,270 |
| APPLICATIONS WITHDRAWN | 0 | $0 |
| FILES CLOSED FOR INCOMPLETENESS | 0 | $0 |
Private Mortgage Insurance Companies Aggregated Statistics For Year 2003
(Based on 2 partial tracts)
|
| A) Conventional
Home Purchase Loans |
|---|
| Number | Average Value |
|---|
| LOANS ORIGINATED | 1 | $81,380 |
| APPLICATIONS APPROVED, NOT ACCEPTED | 0 | $0 |
| APPLICATIONS DENIED | 0 | $0 |
| APPLICATIONS WITHDRAWN | 0 | $0 |
| FILES CLOSED FOR INCOMPLETENESS | 0 | $0 |
| Most common first names in zip code 93665 among deceased individuals |
| Name | Count | Lived (average) |
|---|
| Willie | 6 | 61.9 years |
| George | 4 | 66.8 years |
| James | 4 | 77.0 years |
| John | 3 | 69.4 years |
| Jose | 3 | 43.6 years |
| Maria | 3 | 74.0 years |
| Robert | 3 | 73.3 years |
| William | 3 | 83.7 years |
| Daniel | 2 | 66.5 years |
| Booker | 2 | 72.6 years |
| Most common last names in zip code 93665 among deceased individuals |
| Last name | Count | Lived (average) |
|---|
| Johnson | 6 | 76.8 years |
| Clark | 6 | 67.6 years |
| Anderson | 5 | 70.8 years |
| Jackson | 4 | 70.3 years |
| Jones | 4 | 54.5 years |
| Solomon | 4 | 79.5 years |
| Weaver | 4 | 62.8 years |
| Allen | 3 | 66.3 years |
| Brown | 3 | 76.0 years |
| Adams | 3 | 75.8 years |


 Nearest zip codes: 93620, 93622, 95317, 93635, 95341, 93640.