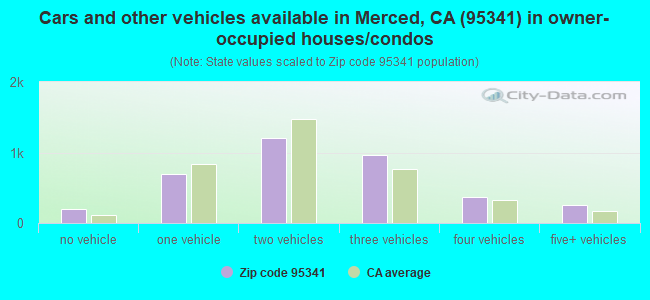
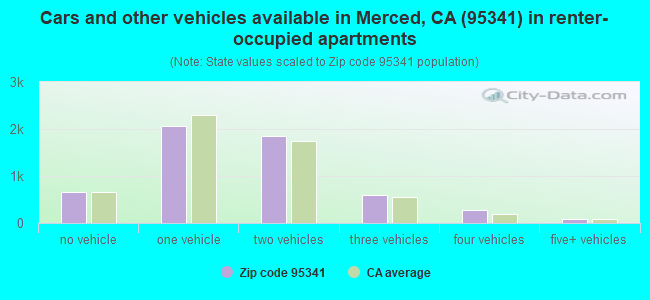
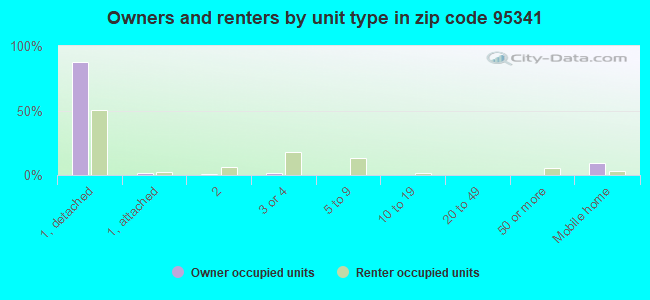
Houses and condos: 9,460 Renter-occupied apartments: 5,531
% of renters here:
60%
State:
44%
March 2022 cost of living index in zip code 95341: 95.5 (near average, U.S. average is 100)
Land area: 149.6 sq. mi. Water area: 1.4 sq. mi.
Population density: 229 people per square mile
(very low).
OSM Map
Google Map
MSN Map
OSM Map
General Map
Google Map
MSN Map
OSM Map
Google Map
MSN Map
OSM Map
Google Map
MSN Map
Please wait while loading the map...
Real estate property taxes paid for housing units in 2022:
This zip code:
0.8% ($2,178)
California:
0.7% ($4,831)
Median real estate property taxes paid for housing units with mortgages in 2022: $2,452 (0.8%) Median real estate property taxes paid for housing units with no mortgage in 2022: $1,576 (0.6%)
Estimated median house/condo value in 2022: $288,401
95341:
$288,401
California:
$715,900
According to our research of California and other state lists, there were 56 registered sex offenders living in 95341 zip code as of May 28, 2024. The ratio of all residents to sex offenders in zip code 95341 is 594 to 1. The ratio of registered sex offenders to all residents in this zip code is near the state average.
Median resident age:
This zip code:
28.0 years
California median age:
37.9 years
Average household size:
This zip code:
3.6 people
California:
2.8 people
Averages for the 2020 tax year for zip code 95341, filed in 2021:
Average Adjusted Gross Income (AGI) in 2020: $38,530 (Individual Income Tax Returns)
Here:
$38,530
State:
$95,910
Salary/wage: $34,386 (reported on 88.7% of returns)
Here:
$34,386
State:
$77,331
(% of AGI for various income ranges: 1362.6% for AGIs below $25k, 4147.1% for AGIs $25k-50k, 7256.3% for AGIs $50k-75k, 11026.6% for AGIs $75k-100k, 18298.7% for AGIs $100k-200k)
Taxable interest for individuals: $430 (reported on 17.2% of returns)
This zip code:
$430
California:
$2,294
(% of AGI for various income ranges: 2.6% for AGIs below $25k, 2.9% for AGIs $25k-50k, 14.7% for AGIs $50k-75k, 20.6% for AGIs $75k-100k, 51.3% for AGIs $100k-200k)
Ordinary dividends: $7,468 (reported on 3.1% of returns)
Here:
$7,468
State:
$10,949
(% of AGI for various income ranges: 1.5% for AGIs below $25k, 4.9% for AGIs $25k-50k, 5.6% for AGIs $50k-75k, 33.8% for AGIs $75k-100k, 152.3% for AGIs $100k-200k)
Net capital gain/loss in AGI: +$13,623 (reported on 4.3% of returns)
Here:
+$13,623
State:
+$49,306
(% of AGI for various income ranges: 1.2% for AGIs below $25k, 12.8% for AGIs $25k-50k, 20.6% for AGIs $50k-75k, 10.2% for AGIs $75k-100k, 669.7% for AGIs $100k-200k)
Profit/loss from business: +$9,918 (reported on 10.6% of returns)
Here:
+$9,918
State:
+$15,671
(% of AGI for various income ranges: 97.9% for AGIs below $25k, 96.8% for AGIs $25k-50k, 156.4% for AGIs $50k-75k, 131.8% for AGIs $75k-100k, 1427.3% for AGIs $100k-200k)
Taxable individual retirement arrangement distribution: $12,586 (reported on 1.6% of returns)
95341:
$12,586
California:
$23,505
(% of AGI for various income ranges: 7.0% for AGIs below $25k, 12.3% for AGIs $25k-50k, 43.4% for AGIs $50k-75k, 112.2% for AGIs $75k-100k, 324.3% for AGIs $100k-200k)
Total itemized deductions: $27,602 (reported on 3.0% of returns)
Here:
$27,602
State:
$39,517
(% of AGI for various income ranges: 61.6% for AGIs $25k-50k, 247.6% for AGIs $50k-75k, 431.2% for AGIs $75k-100k, 815.0% for AGIs $100k-200k)
Charity contributions: $5,687 (reported on 2.2% of returns)
Here:
$5,687
State:
$12,598
(% of AGI for various income ranges: 6.9% for AGIs $25k-50k, 19.5% for AGIs $50k-75k, 47.8% for AGIs $75k-100k, 165.3% for AGIs $100k-200k)
Taxes paid: $7,065 (reported on 3.0% of returns)
95341:
$7,065
State:
$8,807
(% of AGI for various income ranges: 13.4% for AGIs $25k-50k, 62.1% for AGIs $50k-75k, 128.0% for AGIs $75k-100k, 245.3% for AGIs $100k-200k)
Earned income credit: $2,549 (reported on 30.1% of returns)
Here:
$2,549
State:
$2,074
(% of AGI for various income ranges: 152.1% for AGIs below $25k, 121.6% for AGIs $25k-50k, 3.4% for AGIs $50k-75k)
Percentage of individuals using paid preparers for their 2020 taxes: 93.2%
Here:
93%
State:
92%
(% for various income ranges: 92.5% for AGIs below $25k, 93.2% for AGIs $25k-50k, 94.4% for AGIs $50k-75k, 93.5% for AGIs $75k-100k, 94.5% for AGIs $100k-200k, 100.0% for AGIs over 200k)
Averages for the 2012 tax year for zip code 95341, filed in 2013:
Average Adjusted Gross Income (AGI) in 2012: $29,391 (Individual Income Tax Returns)
Here:
$29,391
State:
$72,726
Salary/wage: $26,259 (reported on 90.3% of returns)
Here:
$26,259
State:
$59,079
(% of AGI for various income ranges: 84.3% for AGIs below $25k, 87.9% for AGIs $25k-50k, 82.4% for AGIs $50k-75k, 80.5% for AGIs $75k-100k, 68.9% for AGIs $100k-200k, 30.1% for AGIs over 200k)
Taxable interest for individuals: $666 (reported on 15.0% of returns)
This zip code:
$666
California:
$2,146
(% of AGI for various income ranges: 0.1% for AGIs below $25k, 0.1% for AGIs $25k-50k, 0.5% for AGIs $50k-75k, 0.4% for AGIs $75k-100k, 0.7% for AGIs $100k-200k, 1.4% for AGIs over 200k)
Ordinary dividends: $2,285 (reported on 3.2% of returns)
Here:
$2,285
State:
$9,308
(% of AGI for various income ranges: 0.1% for AGIs below $25k, 0.2% for AGIs $25k-50k, 0.2% for AGIs $50k-75k, 0.2% for AGIs $75k-100k, 1.1% for AGIs $100k-200k)
Net capital gain/loss in AGI: +$16,882 (reported on 2.7% of returns)
Here:
+$16,882
State:
+$30,460
(% of AGI for various income ranges: 0.2% for AGIs $50k-75k, 0.8% for AGIs $75k-100k, 5.3% for AGIs $100k-200k, 18.4% for AGIs over 200k)
Profit/loss from business: +$10,140 (reported on 10.0% of returns)
Here:
+$10,140
State:
+$17,064
(% of AGI for various income ranges: 5.4% for AGIs below $25k, 2.4% for AGIs $25k-50k, 2.1% for AGIs $50k-75k, 1.5% for AGIs $75k-100k, 7.8% for AGIs $100k-200k)
Taxable individual retirement arrangement distribution: $9,126 (reported on 2.6% of returns)
95341:
$9,126
California:
$19,557
(% of AGI for various income ranges: 0.5% for AGIs below $25k, 0.6% for AGIs $25k-50k, 1.1% for AGIs $50k-75k, 1.4% for AGIs $75k-100k, 1.9% for AGIs $100k-200k)
Total itemized deductions: $19,425 (28% of AGI, reported on 11.5% of returns)
Here:
$19,425
State:
$34,004
Here:
27.7% of AGI
State:
22.7% of AGI
(% of AGI for various income ranges: 2.6% for AGIs below $25k, 5.2% for AGIs $25k-50k, 11.0% for AGIs $50k-75k, 13.5% for AGIs $75k-100k, 16.1% for AGIs $100k-200k, 14.9% for AGIs over 200k)
Charity contributions: $2,531 (reported on 8.7% of returns)
Here:
$2,531
State:
$4,659
(% of AGI for various income ranges: 0.2% for AGIs below $25k, 0.5% for AGIs $25k-50k, 1.2% for AGIs $50k-75k, 1.0% for AGIs $75k-100k, 2.0% for AGIs $100k-200k, 1.5% for AGIs over 200k)
Taxes paid: $5,351 (reported on 11.5% of returns)
95341:
$5,351
State:
$14,448
(% of AGI for various income ranges: 0.4% for AGIs below $25k, 1.0% for AGIs $25k-50k, 2.6% for AGIs $50k-75k, 4.8% for AGIs $75k-100k, 5.1% for AGIs $100k-200k, 6.7% for AGIs over 200k)
Earned income credit: $2,705 (reported on 39.0% of returns)
Here:
$2,705
State:
$2,286
(% of AGI for various income ranges: 10.1% for AGIs below $25k, 2.5% for AGIs $25k-50k)
Percentage of individuals using paid preparers for their 2012 taxes: 62.9%
Here:
63%
State:
64%
(% for various income ranges: 60.2% for AGIs below $25k, 65.8% for AGIs $25k-50k, 65.9% for AGIs $50k-75k, 67.7% for AGIs $75k-100k, 72.7% for AGIs $100k-200k, 100.0% for AGIs over 200k)
Averages for the 2004 tax year for zip code 95341, filed in 2005:
Average Adjusted Gross Income (AGI) in 2004: $31,860 (Individual Income Tax Returns)
Here:
$31,860
State:
$58,600
Salary/wage: $24,317 (reported on 86.9% of returns)
Here:
$24,317
State:
$49,455
(% of AGI for various income ranges: 81.8% for AGIs below $10k, 81.2% for AGIs $10k-25k, 83.9% for AGIs $25k-50k, 80.2% for AGIs $50k-75k, 76.6% for AGIs $75k-100k, 28.2% for AGIs over 100k)
Taxable interest for individuals: $1,632 (reported on 27.0% of returns)
This zip code:
$1,632
California:
$2,365
(% of AGI for various income ranges: 1.9% for AGIs below $10k, 0.4% for AGIs $10k-25k, 0.8% for AGIs $25k-50k, 0.3% for AGIs $50k-75k, 0.3% for AGIs $75k-100k, 3.2% for AGIs over 100k)
Taxable dividends: $1,113 (reported on 9.4% of returns)
Here:
$1,113
State:
$4,746
Net capital gain/loss: +$14,730 (reported on 6.6% of returns)
Here:
+$14,730
State:
+$23,418
Profit/loss from business: +$10,657 (reported on 11.9% of returns)
Here:
+$10,657
State:
+$16,826
(% of AGI for various income ranges: 12.0% for AGIs below $10k, 4.1% for AGIs $10k-25k, 3.6% for AGIs $25k-50k, 15.5% for AGIs $50k-75k)
Total itemized deductions: $19,131 (22% of AGI, reported on 17.6% of returns)
Here:
$19,131
State:
$28,113
Here:
22.2% of AGI
State:
25.3% of AGI
(% of AGI for various income ranges: 37.2% for AGIs below $10k, 9.3% for AGIs $25k-50k, 12.3% for AGIs $50k-75k, 25.6% for AGIs $75k-100k, 11.8% for AGIs over 100k)
Charity contributions deductions: $2,276 (3% of AGI, reported on 15.5% of returns)
Here:
$2,276
State:
$3,923
Here:
2.6% of AGI
State:
3.3% of AGI
(% of AGI for various income ranges: 1.3% for AGIs $25k-50k, 1.0% for AGIs $50k-75k, 4.9% for AGIs $75k-100k, 0.9% for AGIs over 100k)
Total tax: $5,353 (reported on 53.3% of returns)
95341:
$5,353
State:
$10,761
(% of AGI for various income ranges: 2.8% for AGIs below $10k, 3.0% for AGIs $10k-25k, 4.9% for AGIs $25k-50k, 8.7% for AGIs $50k-75k, 10.1% for AGIs $75k-100k, 17.7% for AGIs over 100k)
Earned income credit: $1,876 (reported on 38.5% of returns)
Here:
$1,876
State:
$1,763
Percentage of individuals using paid preparers for their 2004 taxes: 60.4%
Here:
60%
State:
66%
(% for various income ranges: 52.9% for AGIs below $10k, 54.8% for AGIs $10k-25k, 62.9% for AGIs $25k-50k, 79.4% for AGIs $50k-75k, 80.0% for AGIs $75k-100k, 91.7% for AGIs over 100k)
Likely homosexual households (counted as self-reported same-sex unmarried-partner households)
Lesbian couples: 0.1% of all households
Gay men: 0.0% of all households
Household received Food Stamps/SNAP in the past 12 months: 3,744 Household did not receive Food Stamps/SNAP in the past 12 months: 6,036
Women who had a birth in the past 12 months: 705 (389 now married, 318 unmarried) Women who did not have a birth in the past 12 months: 8,320 (2,855 now married, 5,483 unmarried)
Housing units in zip code 95341 with a mortgage: 2,659 (85 second mortgage, 55 both second mortgage and home equity loan) Houses without a mortgage: 26
Median monthly owner costs for units with a mortgage: $1,469 Median monthly owner costs for units without a mortgage: $482
Residents with income below the poverty level in 2022:
This zip code:
29.9%
Whole state:
12.2%
Residents with income below 50% of the poverty level in 2022:
This zip code:
15.7%
Whole state:
6.2%
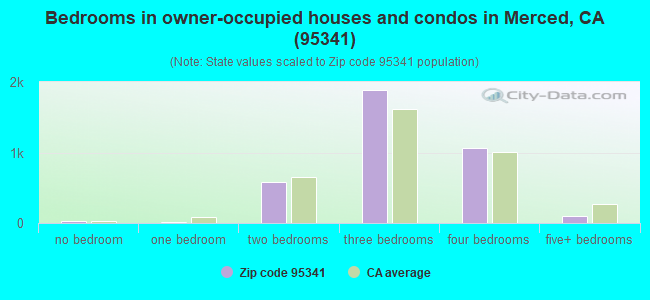
Median number of rooms in houses and condos:
Here:
5.8
State:
6.0
Median number of rooms in apartments:
Here:
5.1
State:
3.9
Notable locations in this zip code not listed on our city pages
Notable locations in zip code 95341: Flynn Duck Club (A), Creegan (B), Visalia Dux Club (C), Sandy Mush Ranch (D), Five H Farms (E), Double Creek Ranch (F), Hoogendam Dairy (G), Rock - Shar Dairy (H), Double D Dairy (I), Homen Dairy Farms (J), Hogland Ranch (K), Airport Industrial Park (L), Wilson Substation (M), Merced Substation (N), Merced Sewage Disposal (O), Merced County Juvenile Hall (P), Yosemite Wildlife Museum (Q), Merced County Fire Department Station 81 Merced Headquarters (R), Merced County Human Services Agency (S), Riggs Ambulance Service (T). Display/hide their locations on the map
Churches in zip code 95341 include: Church of Christ (A), Friendship Baptist Church (B), Calvary Baptist Church (C), Cornerstone Worship Center Pentecostal Church (D), First Assembly of God Church (E), Merced Revival Center (F), Mount Zion Lighthouse Full Gospel Church (G), Sacred Heart Roman Catholic Church (H), Apostolic Tabernacle (I). Display/hide their locations on the map
Parks in zip code 95341 include: Merced National Wildlife Refuge (1), Leonard Park (2), McNamara Park (3), Macready Park (4), Joe Herb Park (5), Flanagan Park (6), Macias Park (7). Display/hide their locations on the map
5,331 married couples with children.
5,452 single-parent households (1,154 men, 4,298 women).
36.7% of residents of 95341 zip code speak English at home.
54.2% of residents speak Spanish at home (53% very well, 10% well, 15% not well, 21% not at all).
1.6% of residents speak other Indo-European language at home (84% very well, 2% well, 4% not well, 9% not at all).
7.4% of residents speak Asian or Pacific Island language at home (69% very well, 15% well, 14% not well, 2% not at all).
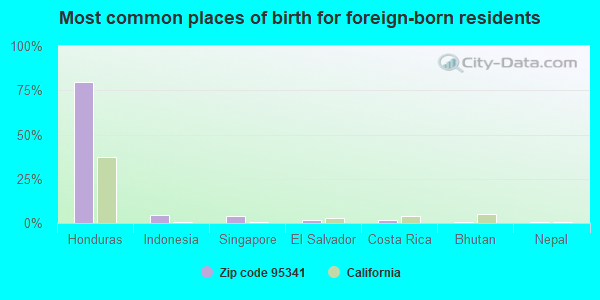
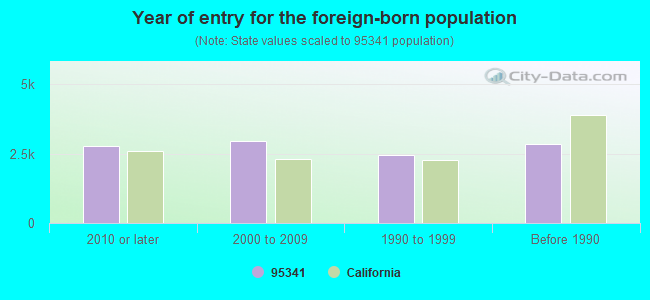
Foreign born population: 10,702 (31.2%) (31.6% of them are naturalized citizens)
Facilities with environmental interests located in this zip code:
MERCED CORP YARD CITY (CORNER OF GROGAN & LN AVE in MERCED, CA)
STATE MASTER (California - Hazardous Waste Tracking) - HAZARDOU WASTE PROGRAM Small Quantity Generators, between 100 kg and 1000 kg of hazardous waste/month (Resource Conservation and Recovery Act (tracking hazardous waste))
JT WEST INC (3510 W SANDY MUSH RD in MERCED, CA)
National Pollutant Discharge Elimination System NON-MAJOR (Tracking pollutant discharge elimination systems) - permit Business SIC classification: DAIRY FARMS Alternative names: MACHADO, TONY
MERCED CITY OF (GROGAN & AW AVE in MERCED, CA)
Small Quantity Generators, between 100 kg and 1000 kg of hazardous waste/month (Resource Conservation and Recovery Act (tracking hazardous waste))
Housing units lacking complete plumbing facilities: 0.9% Housing units lacking complete kitchen facilities: 1.2%
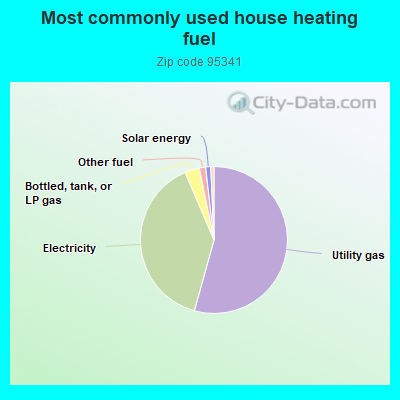
54.1%Utility gas
39.1%Electricity
3.2%Bottled, tank, or LP gas
1.4%Other fuel
1.1%Solar energy
0.7%No fuel used
Place of birth for U.S.-born residents:
This state: 21,967
Northeast: 212
Midwest: 289
South: 551
West: 398
90% of the 95341 zip code residents lived in the same house 1 year ago. Out of people who lived in different houses, 65% moved from this county. Out of people who lived in different houses, 23% moved from different county within same state. Out of people who lived in different houses, 4% moved from different state. Out of people who lived in different houses, 7% moved from abroad.
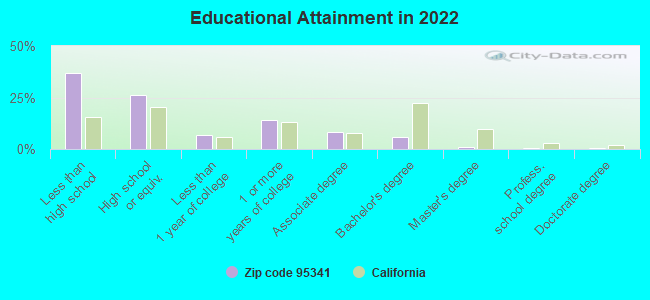
Private vs. public school enrollment:
Students in private schools in grades 1 to 8 (elementary and middle school): 111
Here:
2.1%
California:
10.5%
Students in private schools in grades 9 to 12 (high school): 40
Here:
1.3%
California:
8.5%
Students in private undergraduate colleges: 122
Here:
7.1%
California:
15.9%
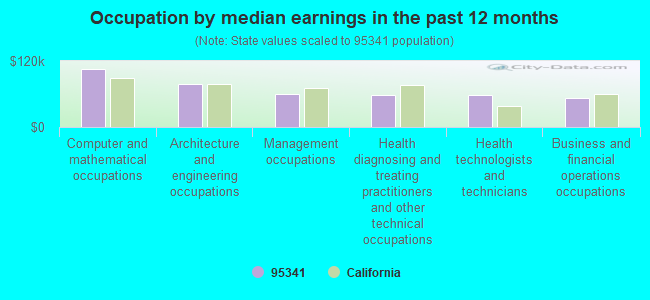
Occupation by median earnings in the past 12 months ($)
105,265Computer and mathematical occupations
77,528Architecture and engineering occupations
60,722Management occupations
59,015Health diagnosing and treating practitioners and other technical occupations
58,781Health technologists and technicians
52,468Business and financial operations occupations
Top industries in this zip code by the number of employees in 2005:
Accommodation and Food Services: Full-Service Restaurants (50-99 employees: 1 establishment)
Wholesale Trade: Farm and Garden Machinery and Equipment Merchant Wholesalers (50-99: 1)
Administrative and Support and Waste Management and Remediation Services: Exterminating and Pest Control Services (20-49: 1, 5-9: 1)
Administrative and Support and Waste Management and Remediation Services: Janitorial Services (20-49: 1)
Health Care and Social Assistance: Home Health Care Services (20-49: 1)
Administrative and Support and Waste Management and Remediation Services: Security Guards and Patrol Services (20-49: 1)
Finance and Insurance: Commercial Banking (10-19: 1)
Fatal accident statistics in 2014:
Fatal accident count: 4
Vehicles involved in fatal accidents: 5
Fatal accidents caused by drunken drivers: 0
Fatalities: 4
Persons involved in fatal accidents: 7
Pedestrians involved in fatal accidents: 2
Fatal accident statistics in 2013:
Fatal accident count: 6
Vehicles involved in fatal accidents: 8
Fatal accidents caused by drunken drivers: 1
Fatalities: 6
Persons involved in fatal accidents: 10
Pedestrians involved in fatal accidents: 2
2007 - 2018 National Fire Incident Reporting System (NFIRS) incidents
Based on the data from the years 2007 - 2018 the average number of fire incidents per year is 76. The highest number of fires - 185 took place in 2017, and the least - 11 in 2007. The data has a rising trend.
When looking into fire subcategories, the most incidents belonged to: Outside Fires (58.9%), and Structure Fires (24.0%).
Fire incident types reported to NFIRS in Zip Code 95341


 Based on the data from the years 2007 - 2018 the average number of fire incidents per year is 76. The highest number of fires - 185 took place in 2017, and the least - 11 in 2007. The data has a rising trend.
 When looking into fire subcategories, the most incidents belonged to: Outside Fires (58.9%), and Structure Fires (24.0%).