Estimated zip code population in 2022: 6,830 Zip code population in 2010: 6,534 Zip code population in 2000: 6,595
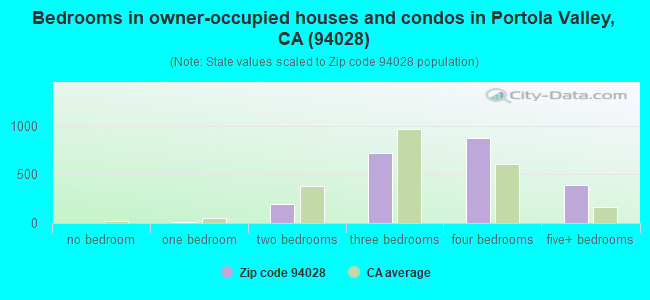
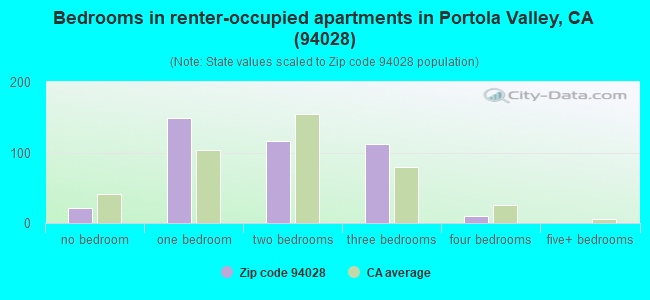
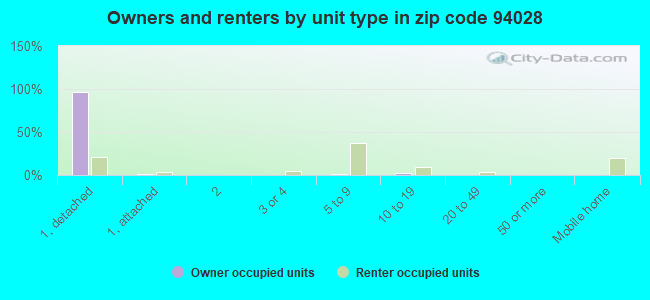
Houses and condos: 2,765 Renter-occupied apartments: 437
% of renters here:
17%
State:
44%
March 2022 cost of living index in zip code 94028: 132.2 (high, U.S. average is 100)
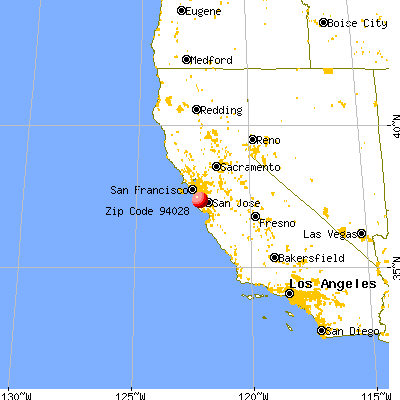
Land area: 15.2 sq. mi. Water area: 0.1 sq. mi.
Population density: 448 people per square mile
(low).
OSM Map
General Map
Google Map
MSN Map
OSM Map
General Map
Google Map
MSN Map
OSM Map
General Map
Google Map
MSN Map
OSM Map
General Map
Google Map
MSN Map
Please wait while loading the map...
Real estate property taxes paid for housing units in 2022:
This zip code:
0.5% ($10,292)
California:
0.7% ($4,831)
Median real estate property taxes paid for housing units with mortgages in 2022: $10,330 (0.5%) Median real estate property taxes paid for housing units with no mortgage in 2022: $10,572 (0.5%)
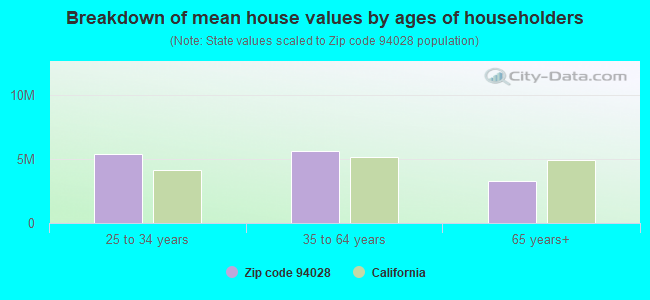
Estimated median house/condo value in 2022: $2,171,698
94028:
$2,171,698
California:
$715,900
Median resident age:
This zip code:
56.8 years
California median age:
37.9 years
Average household size:
This zip code:
2.6 people
California:
2.8 people
Averages for the 2020 tax year for zip code 94028, filed in 2021:
Average Adjusted Gross Income (AGI) in 2020: $1,012,978 (Individual Income Tax Returns)
Here:
$1,012,978
State:
$95,910
Salary/wage: $681,638 (reported on 64.1% of returns)
Here:
$681,638
State:
$77,331
(% of AGI for various income ranges: 1267.2% for AGIs below $25k, 4305.8% for AGIs $25k-50k, 6677.0% for AGIs $50k-75k, 8452.2% for AGIs $75k-100k, 15274.0% for AGIs $100k-200k, 597370.8% for AGIs over 200k)
Taxable interest for individuals: $16,435 (reported on 75.3% of returns)
This zip code:
$16,435
California:
$2,294
(% of AGI for various income ranges: 93.9% for AGIs below $25k, 175.0% for AGIs $25k-50k, 240.0% for AGIs $50k-75k, 251.1% for AGIs $75k-100k, 1090.5% for AGIs $100k-200k, 16270.0% for AGIs over 200k)
Ordinary dividends: $75,915 (reported on 76.2% of returns)
Here:
$75,915
State:
$10,949
(% of AGI for various income ranges: 446.7% for AGIs below $25k, 860.8% for AGIs $25k-50k, 1395.0% for AGIs $50k-75k, 2048.9% for AGIs $75k-100k, 5044.5% for AGIs $100k-200k, 75605.8% for AGIs over 200k)
Net capital gain/loss in AGI: +$473,175 (reported on 73.8% of returns)
Here:
+$473,175
State:
+$49,306
(% of AGI for various income ranges: 212.2% for AGIs below $25k, 624.2% for AGIs $25k-50k, 855.0% for AGIs $50k-75k, 1671.1% for AGIs $75k-100k, 4153.0% for AGIs $100k-200k, 489947.5% for AGIs over 200k)
Profit/loss from business: +$123,279 (reported on 24.1% of returns)
Here:
+$123,279
State:
+$15,671
(% of AGI for various income ranges: 251.7% for AGIs below $25k, 405.0% for AGIs $25k-50k, 1011.0% for AGIs $50k-75k, 381.1% for AGIs $75k-100k, 1873.5% for AGIs $100k-200k, 39603.8% for AGIs over 200k)
Taxable individual retirement arrangement distribution: $62,239 (reported on 18.8% of returns)
94028:
$62,239
California:
$23,505
(% of AGI for various income ranges: 409.2% for AGIs $25k-50k, 1240.0% for AGIs $50k-75k, 1307.8% for AGIs $75k-100k, 3674.5% for AGIs $100k-200k, 12323.3% for AGIs over 200k)
Self-employed (Keogh) retirement plans: $47,830 (reported on 7.9% of returns)
94028:
$47,830
California:
$30,163
(% of AGI for various income ranges: 251.5% for AGIs $100k-200k, 5171.2% for AGIs over 200k)
Total itemized deductions: $192,306 (reported on 47.9% of returns)
Here:
$192,306
State:
$39,517
(% of AGI for various income ranges: 918.9% for AGIs below $25k, 1051.7% for AGIs $25k-50k, 2619.0% for AGIs $50k-75k, 2234.4% for AGIs $75k-100k, 6354.5% for AGIs $100k-200k, 122167.9% for AGIs over 200k)
Charity contributions: $161,384 (reported on 42.9% of returns)
Here:
$161,384
State:
$12,598
(% of AGI for various income ranges: 30.6% for AGIs below $25k, 116.7% for AGIs $25k-50k, 266.0% for AGIs $50k-75k, 218.9% for AGIs $75k-100k, 1138.0% for AGIs $100k-200k, 96952.9% for AGIs over 200k)
Taxes paid: $9,210 (reported on 47.9% of returns)
94028:
$9,210
State:
$8,807
(% of AGI for various income ranges: 127.8% for AGIs below $25k, 142.5% for AGIs $25k-50k, 392.0% for AGIs $50k-75k, 381.1% for AGIs $75k-100k, 1062.5% for AGIs $100k-200k, 4896.7% for AGIs over 200k)
Earned income credit: $675 (reported on 1.2% of returns)
Here:
$675
State:
$2,074
(% of AGI for various income ranges: 15.0% for AGIs below $25k)
Percentage of individuals using paid preparers for their 2020 taxes: 92.4%
Here:
92%
State:
92%
(% for various income ranges: 90.0% for AGIs below $25k, 92.0% for AGIs $25k-50k, 87.0% for AGIs $50k-75k, 89.5% for AGIs $75k-100k, 92.7% for AGIs $100k-200k, 94.0% for AGIs over 200k)
Averages for the 2012 tax year for zip code 94028, filed in 2013:
Average Adjusted Gross Income (AGI) in 2012: $709,699 (Individual Income Tax Returns)
Here:
$709,699
State:
$72,726
Salary/wage: $358,596 (reported on 62.0% of returns)
Here:
$358,596
State:
$59,079
(% of AGI for various income ranges: 55.9% for AGIs below $25k, 49.2% for AGIs $25k-50k, 39.1% for AGIs $50k-75k, 41.8% for AGIs $75k-100k, 39.8% for AGIs $100k-200k, 30.7% for AGIs over 200k)
Taxable interest for individuals: $20,469 (reported on 73.3% of returns)
This zip code:
$20,469
California:
$2,146
(% of AGI for various income ranges: 3.6% for AGIs below $25k, 2.8% for AGIs $25k-50k, 4.3% for AGIs $50k-75k, 2.5% for AGIs $75k-100k, 2.8% for AGIs $100k-200k, 2.1% for AGIs over 200k)
Ordinary dividends: $53,676 (reported on 73.6% of returns)
Here:
$53,676
State:
$9,308
(% of AGI for various income ranges: 19.9% for AGIs below $25k, 11.3% for AGIs $25k-50k, 14.5% for AGIs $50k-75k, 10.2% for AGIs $75k-100k, 11.2% for AGIs $100k-200k, 5.2% for AGIs over 200k)
Net capital gain/loss in AGI: +$431,502 (reported on 71.0% of returns)
Here:
+$431,502
State:
+$30,460
(% of AGI for various income ranges: 5.2% for AGIs below $25k, 3.3% for AGIs $25k-50k, 5.5% for AGIs $50k-75k, 4.0% for AGIs $75k-100k, 5.1% for AGIs $100k-200k, 45.4% for AGIs over 200k)
Profit/loss from business: +$99,665 (reported on 24.3% of returns)
Here:
+$99,665
State:
+$17,064
(% of AGI for various income ranges: 4.8% for AGIs below $25k, 9.4% for AGIs $25k-50k, 4.0% for AGIs $50k-75k, 7.2% for AGIs $75k-100k, 7.5% for AGIs $100k-200k, 3.2% for AGIs over 200k)
Taxable individual retirement arrangement distribution: $61,145 (reported on 24.9% of returns)
94028:
$61,145
California:
$19,557
(% of AGI for various income ranges: 5.4% for AGIs below $25k, 5.4% for AGIs $25k-50k, 10.6% for AGIs $50k-75k, 10.0% for AGIs $75k-100k, 10.6% for AGIs $100k-200k, 1.7% for AGIs over 200k)
Self-employment retirement plans: $40,220 (reported on 8.7% of returns)
94028:
$40,220
California:
$24,530
Total itemized deductions: $177,048 (18% of AGI, reported on 70.7% of returns)
Here:
$177,048
State:
$34,004
Here:
17.9% of AGI
State:
22.7% of AGI
(% of AGI for various income ranges: 47.3% for AGIs below $25k, 27.9% for AGIs $25k-50k, 36.7% for AGIs $50k-75k, 25.1% for AGIs $75k-100k, 29.4% for AGIs $100k-200k, 16.9% for AGIs over 200k)
Charity contributions: $45,716 (reported on 62.9% of returns)
Here:
$45,716
State:
$4,659
(% of AGI for various income ranges: 1.2% for AGIs below $25k, 1.5% for AGIs $25k-50k, 3.5% for AGIs $50k-75k, 2.3% for AGIs $75k-100k, 2.7% for AGIs $100k-200k, 4.1% for AGIs over 200k)
Taxes paid: $97,258 (reported on 70.4% of returns)
94028:
$97,258
State:
$14,448
(% of AGI for various income ranges: 10.9% for AGIs below $25k, 6.7% for AGIs $25k-50k, 8.3% for AGIs $50k-75k, 7.7% for AGIs $75k-100k, 11.0% for AGIs $100k-200k, 9.6% for AGIs over 200k)
Earned income credit: $683 (reported on 1.7% of returns)
Here:
$683
State:
$2,286
(% of AGI for various income ranges: 0.6% for AGIs below $25k)
Percentage of individuals using paid preparers for their 2012 taxes: 71.9%
Here:
72%
State:
64%
(% for various income ranges: 63.4% for AGIs below $25k, 60.6% for AGIs $25k-50k, 64.0% for AGIs $50k-75k, 66.7% for AGIs $75k-100k, 70.2% for AGIs $100k-200k, 81.9% for AGIs over 200k)
Averages for the 2004 tax year for zip code 94028, filed in 2005:
Average Adjusted Gross Income (AGI) in 2004: $411,558 (Individual Income Tax Returns)
Here:
$411,558
State:
$58,600
Salary/wage: $283,854 (reported on 61.0% of returns)
Here:
$283,854
State:
$49,455
(% of AGI for various income ranges: 50.4% for AGIs $10k-25k, 45.8% for AGIs $25k-50k, 34.9% for AGIs $50k-75k, 34.3% for AGIs $75k-100k, 41.8% for AGIs over 100k)
Taxable interest for individuals: $15,449 (reported on 79.9% of returns)
This zip code:
$15,449
California:
$2,365
(% of AGI for various income ranges: 6.4% for AGIs $10k-25k, 5.2% for AGIs $25k-50k, 6.0% for AGIs $50k-75k, 5.6% for AGIs $75k-100k, 2.8% for AGIs over 100k)
Taxable dividends: $30,037 (reported on 78.1% of returns)
Here:
$30,037
State:
$4,746
(% of AGI for various income ranges: 17.1% for AGIs $10k-25k, 9.7% for AGIs $25k-50k, 13.2% for AGIs $50k-75k, 10.5% for AGIs $75k-100k, 5.4% for AGIs over 100k)
Net capital gain/loss: +$145,377 (reported on 74.2% of returns)
Here:
+$145,377
State:
+$23,418
(% of AGI for various income ranges: 5.9% for AGIs $10k-25k, 5.5% for AGIs $25k-50k, 4.8% for AGIs $50k-75k, 6.8% for AGIs $75k-100k, 26.8% for AGIs over 100k)
Profit/loss from business: +$64,165 (reported on 24.9% of returns)
Here:
+$64,165
State:
+$16,826
(% of AGI for various income ranges: 9.6% for AGIs $10k-25k, 6.4% for AGIs $25k-50k, 6.5% for AGIs $50k-75k, 6.3% for AGIs $75k-100k, 3.8% for AGIs over 100k)
IRA payment deduction: $3,931 (reported on 3.4% of returns)
94028:
$3,931
California:
$3,192
(% of AGI for various income ranges: 0.6% for AGIs $25k-50k, 0.5% for AGIs $50k-75k, 0.0% for AGIs over 100k)
Self-employed pension: $27,746 (reported on 9.0% of returns)
Here:
$27,746
California:
$17,688
(% of AGI for various income ranges: 2.4% for AGIs $10k-25k, 0.7% for AGIs $75k-100k, 0.6% for AGIs over 100k)
Total itemized deductions: $111,227 (19% of AGI, reported on 67.8% of returns)
Here:
$111,227
State:
$28,113
Here:
18.8% of AGI
State:
25.3% of AGI
(% of AGI for various income ranges: 38.9% for AGIs $10k-25k, 28.6% for AGIs $25k-50k, 34.2% for AGIs $50k-75k, 32.6% for AGIs $75k-100k, 17.6% for AGIs over 100k)
Charity contributions deductions: $29,915 (5% of AGI, reported on 63.3% of returns)
Here:
$29,915
State:
$3,923
Here:
4.8% of AGI
State:
3.3% of AGI
(% of AGI for various income ranges: 2.4% for AGIs $10k-25k, 3.0% for AGIs $25k-50k, 4.8% for AGIs $50k-75k, 4.1% for AGIs $75k-100k, 4.6% for AGIs over 100k)
Total tax: $108,206 (reported on 84.6% of returns)
94028:
$108,206
State:
$10,761
(% of AGI for various income ranges: 5.9% for AGIs $10k-25k, 7.1% for AGIs $25k-50k, 9.2% for AGIs $50k-75k, 10.0% for AGIs $75k-100k, 22.6% for AGIs over 100k)
Earned income credit: $1,036 (reported on 1.7% of returns)
Here:
$1,036
State:
$1,763
Percentage of individuals using paid preparers for their 2004 taxes: 70.1%
Here:
70%
State:
66%
(% for various income ranges: 63.6% for AGIs below $10k, 60.0% for AGIs $10k-25k, 54.8% for AGIs $25k-50k, 69.5% for AGIs $50k-75k, 67.8% for AGIs $75k-100k, 77.6% for AGIs over 100k)
Likely homosexual households (counted as self-reported same-sex unmarried-partner households)
Lesbian couples: 0.7% of all households
Gay men: 0.0% of all households
Household received Food Stamps/SNAP in the past 12 months: 41 Household did not receive Food Stamps/SNAP in the past 12 months: 2,516
Women who had a birth in the past 12 months: 9 (9 now married, 0 unmarried) Women who did not have a birth in the past 12 months: 869 (411 now married, 455 unmarried)
Housing units in zip code 94028 with a mortgage: 1,103 (266 second mortgage, 240 both second mortgage and home equity loan) Houses without a mortgage: 53
Median monthly owner costs for units with a mortgage: $3,876 Median monthly owner costs for units without a mortgage: $1,556
Residents with income below the poverty level in 2022:
This zip code:
3.1%
Whole state:
12.2%
Residents with income below 50% of the poverty level in 2022:
This zip code:
2.1%
Whole state:
6.2%
Median number of rooms in houses and condos:
Here:
7.6
State:
6.0
Median number of rooms in apartments:
Here:
3.2
State:
3.9
Notable locations in this zip code not listed on our city pages
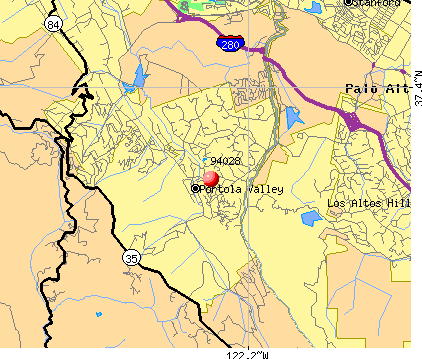
Notable locations in zip code 94028: Rancho Corte Madera (A), Pony Tracks Ranch (B), Portola Valley Town Hall (C), Portola Valley Branch San Mateo County Library (D), Woodside Fire Protection District Station 8 (E). Display/hide their locations on the map
Churches in zip code 94028 include: Woodside Priory (A), Ladera Community United Church of Christ (B), Valley United Presbyterian Church (C), Our Lady of the Wayside Roman Catholic Church (D), Christ Episcopal Church (E). Display/hide their locations on the map
Parks in zip code 94028 include: Casa De Tableta State Historic Landmark (1), Jasper Ridge Biological Preserve (2), Frog Pond Park (3), Windy Hill Open Space (4). Display/hide their locations on the map
In group quarters: 57 (-1 institutionalized population)
Size of family households: 932 2-persons, 333 3-persons, 374 4-persons, 109 5-persons, 81 6-persons, 25 7-or-more-persons
Size of nonfamily households: 679 1-person, 85 2-persons
934 married couples with children.
0 single-parent households ().
83.8% of residents of 94028 zip code speak English at home.
7.0% of residents speak Spanish at home (25% very well, 16% well, 42% not well, 17% not at all).
7.4% of residents speak other Indo-European language at home (93% very well, 7% well).
2.7% of residents speak Asian or Pacific Island language at home (89% very well, 5% well, 6% not well).
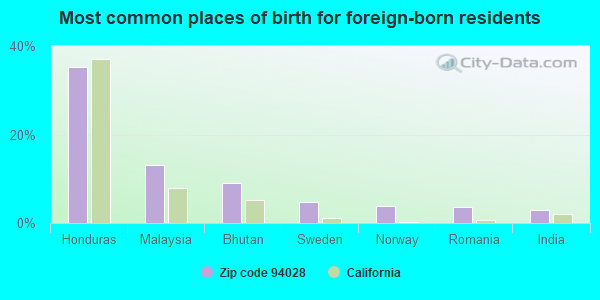
Foreign born population: 1,233 (18.1%) (46.1% of them are naturalized citizens)
This zip code:
18.1%
Whole state:
26.7%
35%Honduras
13%Malaysia
9%Bhutan
5%Sweden
4%Norway
4%Romania
3%India
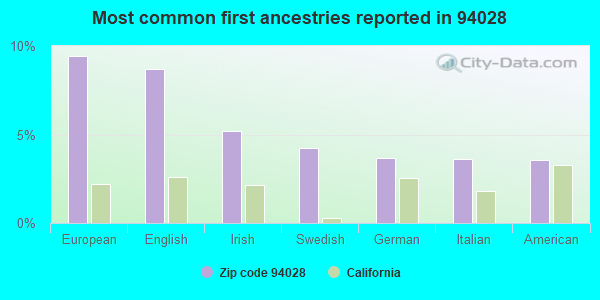
9%European
9%English
5%Irish
4%Swedish
4%German
4%Italian
4%American
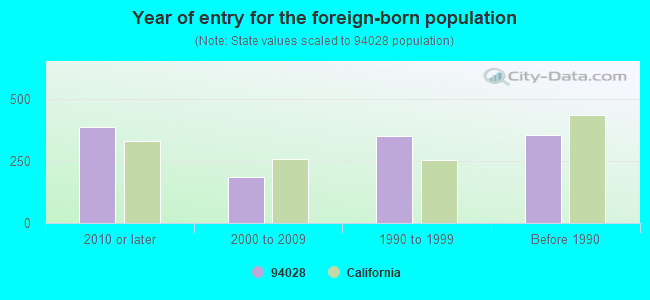
Year of entry for the foreign-born population
3542010 or later
1952000 to 2009
3401990 to 1999
496Before 1990
Housing units lacking complete kitchen facilities: 5.3%
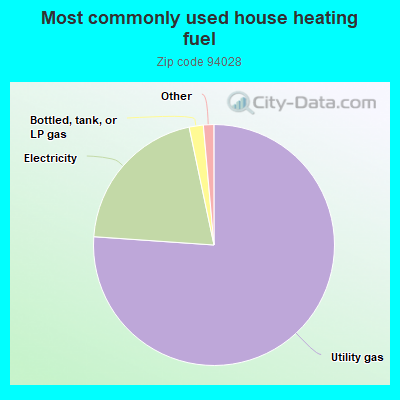
76.1%Utility gas
20.6%Electricity
1.9%Bottled, tank, or LP gas
0.5%Solar energy
0.5%Other fuel
Population in 1990: 6,379. Population change in the 1990s: +216 (+3.4%).
Place of birth for U.S.-born residents:
This state: 3,168
Northeast: 879
Midwest: 742
South: 286
West: 326
74% of the 94028 zip code residents lived in the same house 5 years ago. Out of people who lived in different houses, 37% lived in this county. Out of people who lived in different counties, 50% lived in California.
94% of the 94028 zip code residents lived in the same house 1 year ago. Out of people who lived in different houses, 50% moved from this county. Out of people who lived in different houses, 24% moved from different county within same state. Out of people who lived in different houses, 23% moved from different state. Out of people who lived in different houses, 8% moved from abroad.
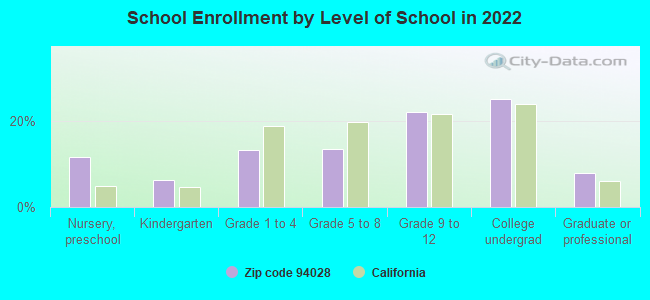
Private vs. public school enrollment:
Students in private schools in grades 1 to 8 (elementary and middle school): 94
Here:
23.8%
California:
10.5%
Students in private schools in grades 9 to 12 (high school): 194
Here:
60.5%
California:
8.5%
Students in private undergraduate colleges: 250
Here:
66.6%
California:
15.9%
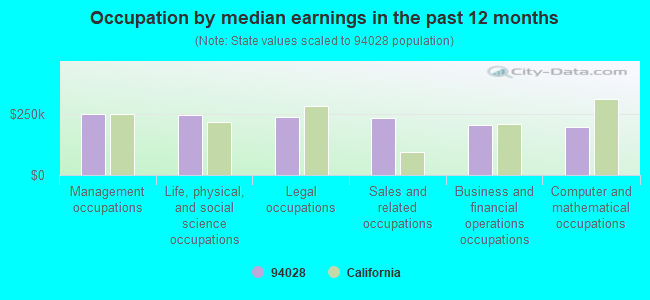
Occupation by median earnings in the past 12 months ($)
248,553Management occupations
242,578Life, physical, and social science occupations
237,352Legal occupations
232,863Sales and related occupations
203,742Business and financial operations occupations
194,141Computer and mathematical occupations
Companies with federal contracts located in this zip code:
FINEMECH INC (35 KIOWA CT in PORTOLA VALLEY, CA; small business)
$5,280 with Army for Miscellaneous Maintenance and Repair Shop Specialized Equipment. Signed on 2006-04-13. Completion date: 2006-05-12.
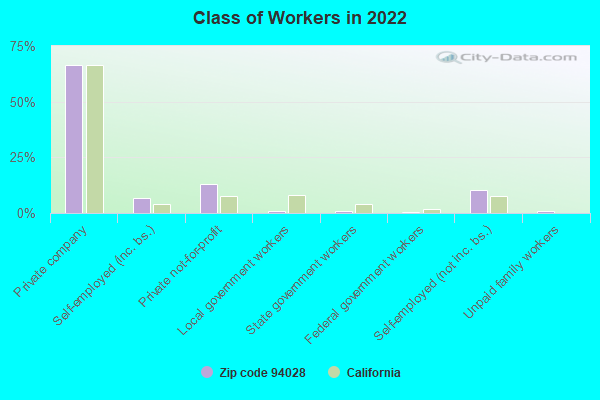
Top industries in this zip code by the number of employees in 2005:
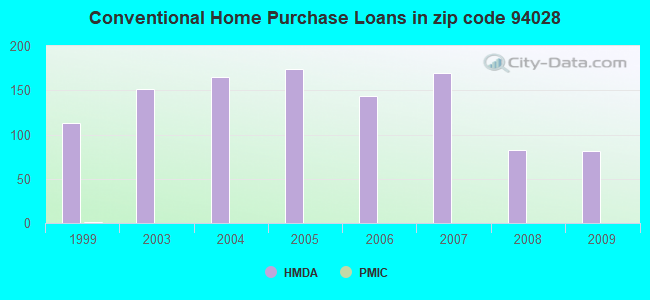
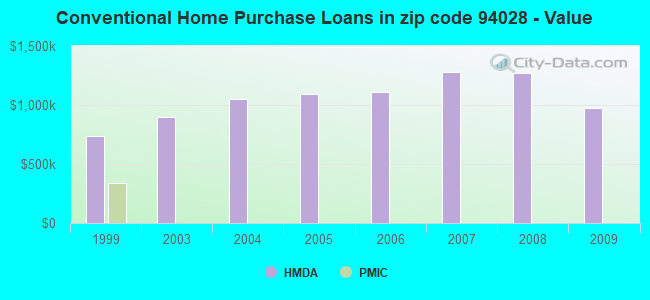
Detailed HMDA statistics for the following Tracts:6132.00
Private Mortgage Insurance Companies Aggregated Statistics For Year 1999 (Based on 2 partial tracts)
A) Conventional Home Purchase Loans
Number
Average Value
LOANS ORIGINATED
1
$336,370
APPLICATIONS APPROVED, NOT ACCEPTED
0
$0
APPLICATIONS DENIED
0
$0
APPLICATIONS WITHDRAWN
0
$0
FILES CLOSED FOR INCOMPLETENESS
0
$0
2006 - 2018 National Fire Incident Reporting System (NFIRS) incidents
According to the data from the years 2006 - 2018 the average number of fire incidents per year is 9. The highest number of fire incidents - 20 took place in 2017, and the least - 0 in 2012. The data has an increasing trend.
When looking into fire subcategories, the most incidents belonged to: Outside Fires (48.7%), and Structure Fires (34.2%).
Fire incident types reported to NFIRS in Zip Code 94028


 Nearest zip codes: 94304, 94305, 94022, 94027, 94025, 94306.


 According to the data from the years 2006 - 2018 the average number of fire incidents per year is 9. The highest number of fire incidents - 20 took place in 2017, and the least - 0 in 2012. The data has an increasing trend.
 When looking into fire subcategories, the most incidents belonged to: Outside Fires (48.7%), and Structure Fires (34.2%).