Estimated zip code population in 2022: 17,135 Zip code population in 2010: 13,862 Zip code population in 2000: 13,371
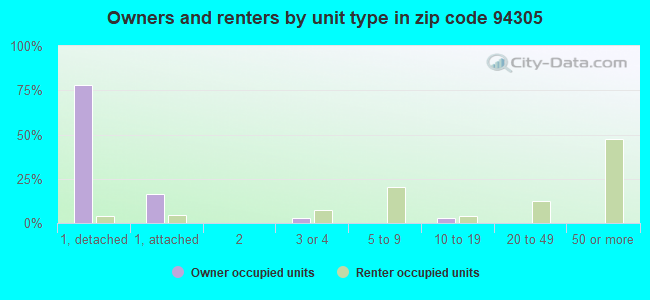
Houses and condos: 4,185 Renter-occupied apartments: 2,656
% of renters here:
73%
State:
44%
March 2022 cost of living index in zip code 94305: 147.6 (very high, U.S. average is 100)
Land area: 5.1 sq. mi. Water area: 0.0 sq. mi.
Population density: 3,341 people per square mile
(average).
OSM Map
General Map
Google Map
MSN Map
OSM Map
General Map
Google Map
MSN Map
OSM Map
General Map
Google Map
MSN Map
OSM Map
General Map
Google Map
MSN Map
Please wait while loading the map...
Real estate property taxes paid for housing units in 2022:
This zip code:
0.4% ($7,924)
California:
0.7% ($4,831)
Median real estate property taxes paid for housing units with mortgages in 2022: $10,330 (0.5%) Median real estate property taxes paid for housing units with no mortgage in 2022: $5,908 (0.3%)
Business Search- 14 Million verified businesses
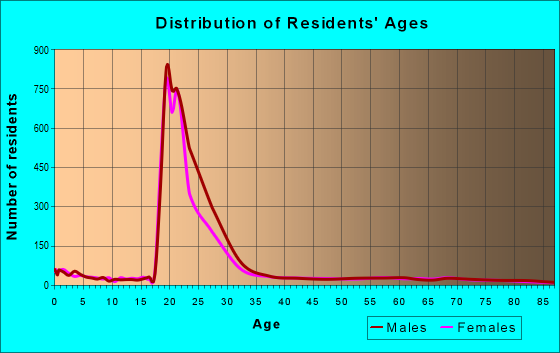
Males: 8,332
(48.6%)
Females: 8,803
(51.4%)
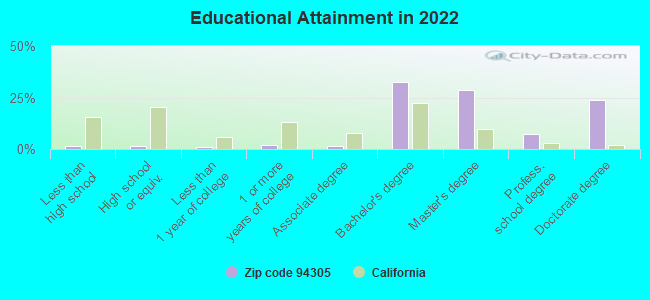
For population 25 years and over in 94305:
High school or higher: 101.9%
Bachelor's degree or higher: 95.7%
Graduate or professional degree: 61.9%
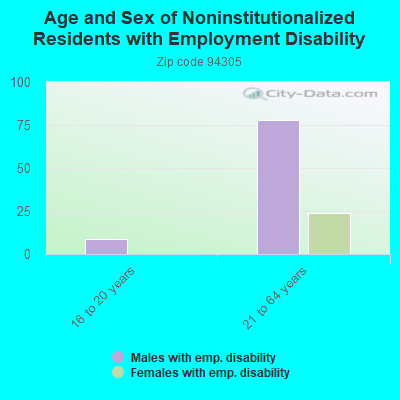
Unemployed: 5.4%
Mean travel time to work (commute): 14.9 minutes
For population 15 years and over in 94305:
Never married: 81.9%
Now married: 15.1%
Separated: 0.1%
Widowed: 2.0%
Divorced: 0.9%
Zip code 94305 compared to state average:
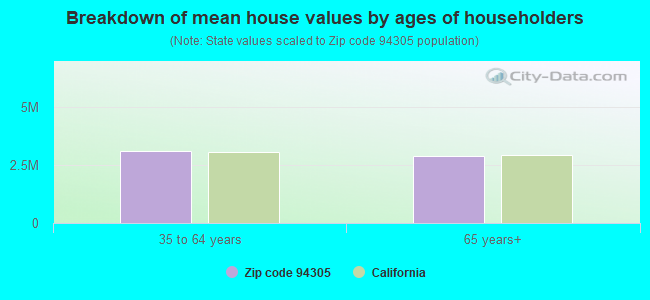
Median house value significantly above state average.
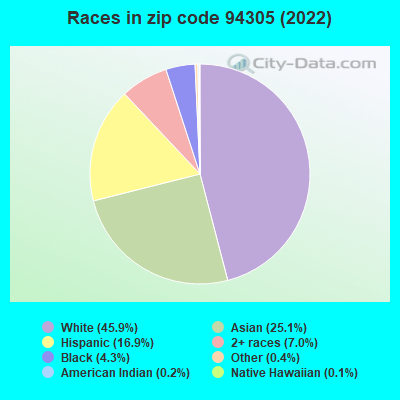
Hispanic race population percentage below state average.
Median age significantly below state average.
Renting percentage above state average.
Length of stay since moving in significantly above state average.
Number of rooms per house below state average.
Number of college students significantly above state average.
Estimated median house/condo value in 2022: $2,171,698
94305:
$2,171,698
California:
$715,900
Median resident age:
This zip code:
22.5 years
California median age:
37.9 years
Average household size:
This zip code:
2.0 people
California:
2.8 people
Averages for the 2020 tax year for zip code 94305, filed in 2021:
Average Adjusted Gross Income (AGI) in 2020: $250,489 (Individual Income Tax Returns)
Here:
$250,489
State:
$95,910
Salary/wage: $151,313 (reported on 91.2% of returns)
Here:
$151,313
State:
$77,331
(% of AGI for various income ranges: 1550.7% for AGIs below $25k, 5145.9% for AGIs $25k-50k, 8026.8% for AGIs $50k-75k, 11187.7% for AGIs $75k-100k, 20485.8% for AGIs $100k-200k, 169923.5% for AGIs over 200k)
Taxable interest for individuals: $3,818 (reported on 53.2% of returns)
This zip code:
$3,818
California:
$2,294
(% of AGI for various income ranges: 11.7% for AGIs below $25k, 14.8% for AGIs $25k-50k, 45.6% for AGIs $50k-75k, 45.4% for AGIs $75k-100k, 206.3% for AGIs $100k-200k, 2989.0% for AGIs over 200k)
Ordinary dividends: $15,944 (reported on 49.8% of returns)
Here:
$15,944
State:
$10,949
(% of AGI for various income ranges: 62.9% for AGIs below $25k, 39.8% for AGIs $25k-50k, 118.2% for AGIs $50k-75k, 332.3% for AGIs $75k-100k, 585.3% for AGIs $100k-200k, 11933.5% for AGIs over 200k)
Net capital gain/loss in AGI: +$126,776 (reported on 45.3% of returns)
Here:
+$126,776
State:
+$49,306
(% of AGI for various income ranges: 46.0% for AGIs below $25k, 68.8% for AGIs $25k-50k, 218.2% for AGIs $50k-75k, 545.4% for AGIs $75k-100k, 862.6% for AGIs $100k-200k, 93241.0% for AGIs over 200k)
Profit/loss from business: +$89,464 (reported on 21.1% of returns)
Here:
+$89,464
State:
+$15,671
(% of AGI for various income ranges: 69.3% for AGIs below $25k, 119.8% for AGIs $25k-50k, 153.2% for AGIs $50k-75k, 160.0% for AGIs $75k-100k, 383.2% for AGIs $100k-200k, 30091.0% for AGIs over 200k)
Taxable individual retirement arrangement distribution: $70,812 (reported on 7.3% of returns)
94305:
$70,812
California:
$23,505
(% of AGI for various income ranges: 59.8% for AGIs $25k-50k, 1241.1% for AGIs $100k-200k, 7145.0% for AGIs over 200k)
Self-employed (Keogh) retirement plans: $39,667 (reported on 4.5% of returns)
94305:
$39,667
California:
$30,163
(% of AGI for various income ranges: 2975.0% for AGIs over 200k)
Total itemized deductions: $85,652 (reported on 18.4% of returns)
Here:
$85,652
State:
$39,517
(% of AGI for various income ranges: 343.2% for AGIs $50k-75k, 1140.0% for AGIs $100k-200k, 24457.5% for AGIs over 200k)
Charity contributions: $57,361 (reported on 16.3% of returns)
Here:
$57,361
State:
$12,598
(% of AGI for various income ranges: 10.7% for AGIs below $25k, 258.9% for AGIs $100k-200k, 15219.0% for AGIs over 200k)
Taxes paid: $9,754 (reported on 18.4% of returns)
94305:
$9,754
State:
$8,807
(% of AGI for various income ranges: 56.5% for AGIs $50k-75k, 310.0% for AGIs $100k-200k, 2584.5% for AGIs over 200k)
Earned income credit: $500 (reported on 3.0% of returns)
Here:
$500
State:
$2,074
(% of AGI for various income ranges: 11.9% for AGIs below $25k)
Percentage of individuals using paid preparers for their 2020 taxes: 92.1%
Here:
92%
State:
92%
(% for various income ranges: 90.0% for AGIs below $25k, 91.2% for AGIs $25k-50k, 92.2% for AGIs $50k-75k, 94.7% for AGIs $75k-100k, 94.4% for AGIs $100k-200k, 92.9% for AGIs over 200k)
Averages for the 2012 tax year for zip code 94305, filed in 2013:
Average Adjusted Gross Income (AGI) in 2012: $170,478 (Individual Income Tax Returns)
Here:
$170,478
State:
$72,726
Salary/wage: $112,529 (reported on 89.3% of returns)
Here:
$112,529
State:
$59,079
(% of AGI for various income ranges: 99.0% for AGIs below $25k, 92.5% for AGIs $25k-50k, 87.9% for AGIs $50k-75k, 78.3% for AGIs $75k-100k, 66.6% for AGIs $100k-200k, 53.1% for AGIs over 200k)
Taxable interest for individuals: $3,695 (reported on 58.2% of returns)
This zip code:
$3,695
California:
$2,146
(% of AGI for various income ranges: 0.9% for AGIs below $25k, 0.5% for AGIs $25k-50k, 0.5% for AGIs $50k-75k, 1.5% for AGIs $75k-100k, 0.9% for AGIs $100k-200k, 1.4% for AGIs over 200k)
Ordinary dividends: $18,492 (reported on 44.6% of returns)
Here:
$18,492
State:
$9,308
(% of AGI for various income ranges: 3.2% for AGIs below $25k, 1.2% for AGIs $25k-50k, 2.7% for AGIs $50k-75k, 2.9% for AGIs $75k-100k, 3.3% for AGIs $100k-200k, 5.5% for AGIs over 200k)
Net capital gain/loss in AGI: +$52,293 (reported on 38.2% of returns)
Here:
+$52,293
State:
+$30,460
(% of AGI for various income ranges: 0.2% for AGIs below $25k, 0.3% for AGIs $25k-50k, 0.9% for AGIs $75k-100k, 1.3% for AGIs $100k-200k, 14.9% for AGIs over 200k)
Profit/loss from business: +$58,537 (reported on 25.4% of returns)
Here:
+$58,537
State:
+$17,064
(% of AGI for various income ranges: 3.8% for AGIs below $25k, 0.9% for AGIs $25k-50k, 2.5% for AGIs $50k-75k, 1.7% for AGIs $75k-100k, 2.7% for AGIs $100k-200k, 10.6% for AGIs over 200k)
Taxable individual retirement arrangement distribution: $72,122 (reported on 11.4% of returns)
94305:
$72,122
California:
$19,557
(% of AGI for various income ranges: 2.0% for AGIs below $25k, 6.0% for AGIs $50k-75k, 5.9% for AGIs $100k-200k, 5.2% for AGIs over 200k)
Self-employment retirement plans: $20,931 (reported on 5.7% of returns)
94305:
$20,931
California:
$24,530
(% of AGI for various income ranges: 0.9% for AGIs over 200k)
Total itemized deductions: $92,815 (25% of AGI, reported on 40.0% of returns)
Here:
$92,815
State:
$34,004
Here:
24.8% of AGI
State:
22.7% of AGI
(% of AGI for various income ranges: 2.8% for AGIs $25k-50k, 6.3% for AGIs $50k-75k, 12.0% for AGIs $75k-100k, 16.5% for AGIs $100k-200k, 25.1% for AGIs over 200k)
Charity contributions: $22,560 (reported on 33.9% of returns)
Here:
$22,560
State:
$4,659
(% of AGI for various income ranges: 0.5% for AGIs below $25k, 0.8% for AGIs $50k-75k, 1.1% for AGIs $75k-100k, 1.6% for AGIs $100k-200k, 5.5% for AGIs over 200k)
Taxes paid: $52,794 (reported on 39.6% of returns)
94305:
$52,794
State:
$14,448
(% of AGI for various income ranges: 0.4% for AGIs $25k-50k, 2.0% for AGIs $50k-75k, 4.5% for AGIs $75k-100k, 7.7% for AGIs $100k-200k, 14.6% for AGIs over 200k)
Earned income credit: $950 (reported on 3.6% of returns)
Here:
$950
State:
$2,286
(% of AGI for various income ranges: 1.3% for AGIs below $25k)
Percentage of individuals using paid preparers for their 2012 taxes: 36.8%
Here:
37%
State:
64%
(% for various income ranges: 23.5% for AGIs below $25k, 14.7% for AGIs $25k-50k, 30.0% for AGIs $50k-75k, 42.9% for AGIs $75k-100k, 55.9% for AGIs $100k-200k, 65.2% for AGIs over 200k)
Averages for the 2004 tax year for zip code 94305, filed in 2005:
Average Adjusted Gross Income (AGI) in 2004: $154,241 (Individual Income Tax Returns)
Here:
$154,241
State:
$58,600
Salary/wage: $67,271 (reported on 84.0% of returns)
Here:
$67,271
State:
$49,455
(% of AGI for various income ranges: 91.8% for AGIs below $10k, 90.0% for AGIs $10k-25k, 89.3% for AGIs $25k-50k, 80.0% for AGIs $50k-75k, 75.3% for AGIs $75k-100k, 30.0% for AGIs over 100k)
Taxable interest for individuals: $6,990 (reported on 49.5% of returns)
This zip code:
$6,990
California:
$2,365
(% of AGI for various income ranges: 2.9% for AGIs below $10k, 1.2% for AGIs $10k-25k, 0.7% for AGIs $25k-50k, 0.7% for AGIs $50k-75k, 1.3% for AGIs $75k-100k, 2.4% for AGIs over 100k)
Taxable dividends: $11,599 (reported on 36.2% of returns)
Here:
$11,599
State:
$4,746
(% of AGI for various income ranges: 5.5% for AGIs below $10k, 1.7% for AGIs $10k-25k, 1.1% for AGIs $25k-50k, 3.0% for AGIs $50k-75k, 2.6% for AGIs $75k-100k, 2.8% for AGIs over 100k)
Net capital gain/loss: +$200,048 (reported on 31.2% of returns)
Here:
+$200,048
State:
+$23,418
(% of AGI for various income ranges: -2.3% for AGIs below $10k, 0.5% for AGIs $10k-25k, 0.8% for AGIs $25k-50k, 1.6% for AGIs $50k-75k, 0.9% for AGIs $75k-100k, 45.8% for AGIs over 100k)
Profit/loss from business: +$77,766 (reported on 17.8% of returns)
Here:
+$77,766
State:
+$16,826
(% of AGI for various income ranges: 1.6% for AGIs below $10k, 1.4% for AGIs $10k-25k, 0.5% for AGIs $25k-50k, 2.1% for AGIs $50k-75k, -0.1% for AGIs $75k-100k, 10.0% for AGIs over 100k)
IRA payment deduction: $2,977 (reported on 1.2% of returns)
94305:
$2,977
California:
$3,192
Self-employed pension: $25,727 (reported on 4.3% of returns)
Here:
$25,727
California:
$17,688
Total itemized deductions: $36,835 (12% of AGI, reported on 47.6% of returns)
Here:
$36,835
State:
$28,113
Here:
12.4% of AGI
State:
25.3% of AGI
(% of AGI for various income ranges: 16.5% for AGIs below $10k, 4.7% for AGIs $10k-25k, 5.1% for AGIs $25k-50k, 7.6% for AGIs $50k-75k, 14.0% for AGIs $75k-100k, 11.9% for AGIs over 100k)
Charity contributions deductions: $12,359 (2% of AGI, reported on 26.5% of returns)
Here:
$12,359
State:
$3,923
Here:
2.5% of AGI
State:
3.3% of AGI
(% of AGI for various income ranges: 0.4% for AGIs below $10k, 0.3% for AGIs $10k-25k, 0.4% for AGIs $25k-50k, 1.2% for AGIs $50k-75k, 1.9% for AGIs $75k-100k, 2.3% for AGIs over 100k)
Total tax: $45,635 (reported on 79.1% of returns)
94305:
$45,635
State:
$10,761
(% of AGI for various income ranges: 2.6% for AGIs below $10k, 7.0% for AGIs $10k-25k, 8.8% for AGIs $25k-50k, 11.4% for AGIs $50k-75k, 13.0% for AGIs $75k-100k, 25.3% for AGIs over 100k)
Earned income credit: $790 (reported on 2.8% of returns)
Here:
$790
State:
$1,763
Percentage of individuals using paid preparers for their 2004 taxes: 26.8%
Here:
27%
State:
66%
(% for various income ranges: 14.7% for AGIs below $10k, 11.2% for AGIs $10k-25k, 12.0% for AGIs $25k-50k, 35.8% for AGIs $50k-75k, 47.5% for AGIs $75k-100k, 65.9% for AGIs over 100k)
Likely homosexual households (counted as self-reported same-sex unmarried-partner households)
Lesbian couples: 0.3% of all households
Gay men: 0.0% of all households
Household received Food Stamps/SNAP in the past 12 months: 47 Household did not receive Food Stamps/SNAP in the past 12 months: 3,500
Women who had a birth in the past 12 months: 108 (77 now married, 31 unmarried) Women who did not have a birth in the past 12 months: 7,360 (536 now married, 6,923 unmarried)
Housing units in zip code 94305 with a mortgage: 459 (108 second mortgage, 9 home equity loan, 28 both second mortgage and home equity loan) Median monthly owner costs for units with a mortgage: $3,876 Median monthly owner costs for units without a mortgage: $1,556
Residents with income below the poverty level in 2022:
This zip code:
21.0%
Whole state:
12.2%
Residents with income below 50% of the poverty level in 2022:
This zip code:
6.3%
Whole state:
6.2%
Median number of rooms in houses and condos:
Here:
7.3
State:
6.0
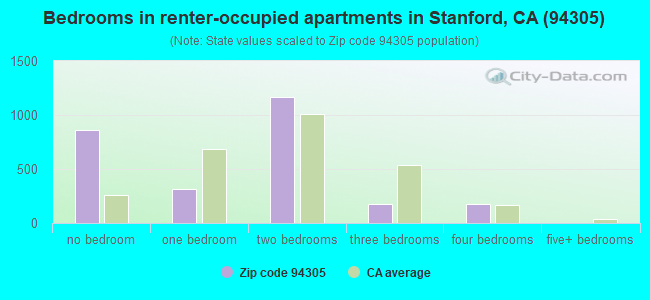
Median number of rooms in apartments:
Here:
3.0
State:
3.9
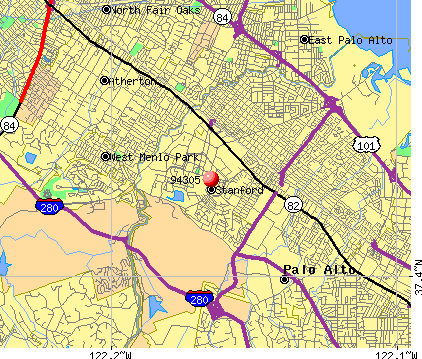
Notable locations in this zip code not listed on our city pages
Notable locations in zip code 94305: The Quadrangle (A), Stanford Golf Course (B), Wilbur Hall (C), Varian Hall (D), Turing Hall (E), Tresidder Memorial Union (F), Toyon Hall (G), Terman Center (H), Sweet Hall (I), Storke Hall (J), Stern Hall (K), Sterling Quadrangle (L), Stanford Museum (M), Stanford Center for Research and Development in Education (N), Stanford Auxiliary Library (O), Spruce Hall (P), Sloan Hall (Q), Skilling Hall (R), Serra Complex (S), Sequoia Hall (T). Display/hide their locations on the map
Parks in zip code 94305 include: Angell Field (1), Escondido Mall (2), Galvez Mall (3), Guinean Sculpture Garden (4), Lasuan Mall (5), Lomita Mall (6), Rodin Sculpture Garden (7), Stanford Stadium (8), White Memorial Plaza (9). Display/hide their locations on the map
747 married couples with children.
161 single-parent households (92 men, 69 women).
59.4% of residents of 94305 zip code speak English at home.
11.3% of residents speak Spanish at home (87% very well, 11% well, 1% not well).
9.3% of residents speak other Indo-European language at home (86% very well, 12% well, 1% not well).
17.7% of residents speak Asian or Pacific Island language at home (78% very well, 16% well, 3% not well, 3% not at all).
1.6% of residents speak other language at home (91% very well, 9% not at all).
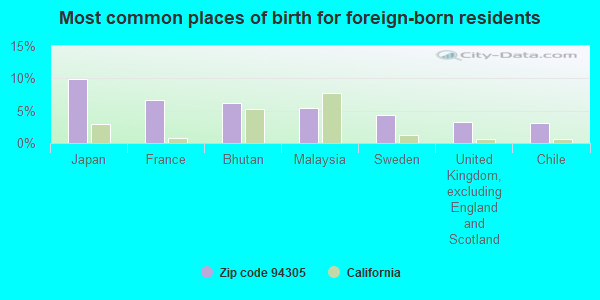
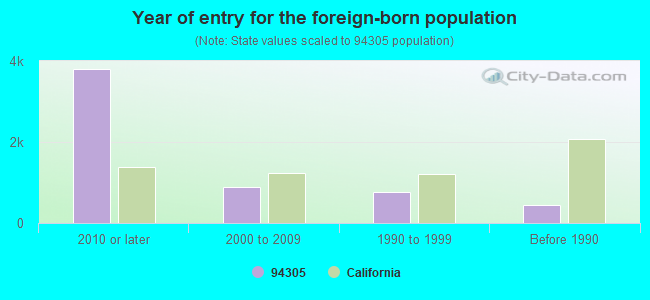
Foreign born population: 4,889 (28.5%) (28.0% of them are naturalized citizens)
Facilities with environmental interests located in this zip code:
ESCONDIDO ELEMENTARY (890 ESCONDIDO ROAD in STANFORD, CA)
(National Center for Education Statistics) - STATE ID-6048250 Organizations: PALO ALTO UNIFIED (SCHOOL DISTRICT)
NIXON (LUCILLE M.) ELEMENTARY (1711 STANFORD AVE. in STANFORD, CA)
(National Center for Education Statistics) - STATE ID-6068241 Organizations: PALO ALTO UNIFIED (SCHOOL DISTRICT)
CARDINAL COGENERATION, INC. (BUILDING 14 - 105/STANFORD UNIVERSITY in STANFORD, CA)
(Integrated Compliance Information System) - ICIS-09-1993-0026, FORMAL ENFORCEMENT ACTION Business SIC classification: ELECTRIC AND OTHER SERVICES COMBINED
CARDINAL COGEN A JOINT VENTURE (CAMPUS & JORDAN WAY in PALO ALTO, CA)
AIR MAJOR (AIRS/AFS) CRITERIA AND HAZARDOUS AIR POLLUTANT INVENTORY (Inventory of air pollution sources) Business SIC classification: ELECTRIC AND OTHER SERVICES COMBINED; GENERAL MEDICAL AND SURGICAL HOSPITALS Alternative names: CARDINAL COGEN INC
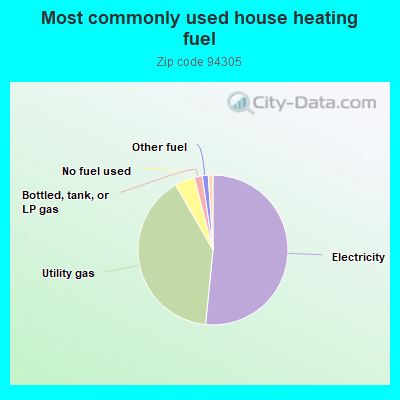
51.6%Electricity
40.1%Utility gas
4.3%No fuel used
1.7%Bottled, tank, or LP gas
1.3%Other fuel
1.0%Solar energy
Population in 1990: 18,097.
Place of birth for U.S.-born residents:
This state: 6,430
Northeast: 1,713
Midwest: 1,390
South: 1,132
West: 964
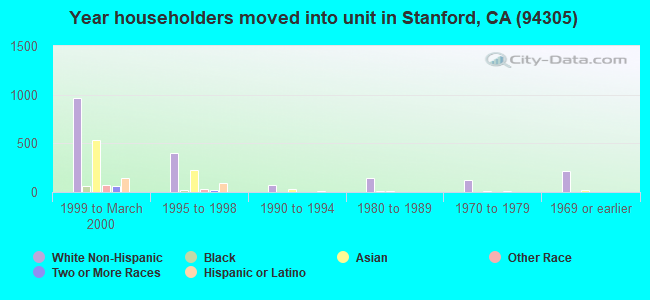
17% of the 94305 zip code residents lived in the same house 5 years ago. Out of people who lived in different houses, 12% lived in this county. Out of people who lived in different counties, 50% lived in California.
74% of the 94305 zip code residents lived in the same house 1 year ago. Out of people who lived in different houses, 31% moved from this county. Out of people who lived in different houses, 20% moved from different county within same state. Out of people who lived in different houses, 18% moved from different state. Out of people who lived in different houses, 35% moved from abroad.
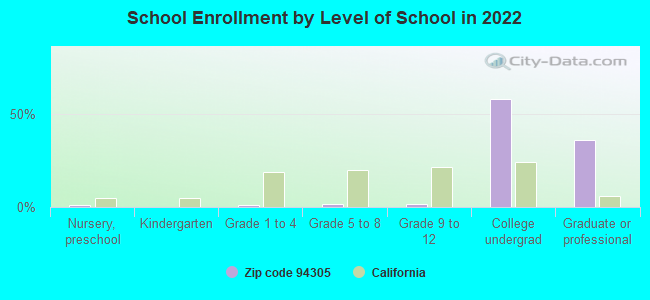
Private vs. public school enrollment:
Students in private schools in grades 1 to 8 (elementary and middle school): 68
Here:
18.2%
California:
10.5%
Students in private schools in grades 9 to 12 (high school): 31
Here:
14.4%
California:
8.5%
Students in private undergraduate colleges: 4,458
Here:
55.0%
California:
15.9%
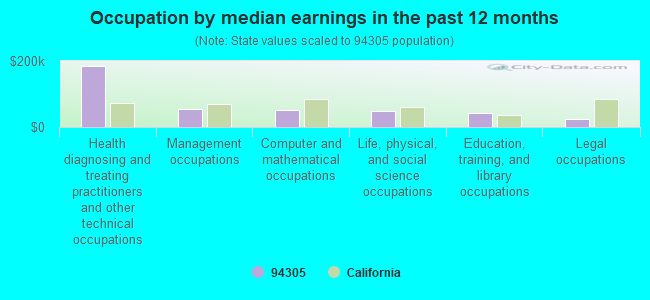
Occupation by median earnings in the past 12 months ($)
124,010Health diagnosing and treating practitioners and other technical occupations
46,386Life, physical, and social science occupations
44,947Computer and mathematical occupations
44,823Education, training, and library occupations
42,984Management occupations
34,146Architecture and engineering occupations
Companies with biggest federal contracts located in this zip code:
STANFORD UNIVERSITY (04655T PANAMA ST in STANFORD, CA) : $30,976,864 in 11 contractsfrom 1999 to 2005
Contracts for Tuition, Registration, and Membership Fees, Other Defense -- Advanced Development (R&D), Other Medical Services by Navy, Air Force, Department of Veterans Affairs Signed by year:2000: $150,000; 2001: $328,160; 2002: $0; 2003: $293,859; 2004: $35,000; 2005: $29,160,000; 2006: $0.
Biggest contracts:
$10,035,000 with Navy for Tuition, Registration, and Membership Fees. Signed on 2005-01-18. Completion date: 2005-05-20.
$10,035,000, same as above.Signed on 2005-03-28. Completion date: 2005-05-20.
$9,090,000, same as above.Signed on 2005-09-26. Completion date: 2005-12-23.
$597,895 with Air Force for Other Defense -- Advanced Development (R&D). Signed on 1999-12-28. Completion date: 2002-02-15.
STANFORD, LELAND JUNIOR UNIVER (651 SERRA ST in STANFORD, CA)
$775,836 with Navy for Other Defense -- Applied Research and Exploratory Development (R&D). Signed on 2000-02-07. Completion date: 2000-04-03.
STANFORD, LELAND JUNIOR UNIVER (STANFORD UNIVERSITY in STANFORD, CA) : $737,285 in 4 contractsfrom 1999 to 2000
$700,210 with Army for Other Research and Development -- Basic Research (R&D). Signed on 1999-12-03. Completion date: 2001-03-24.
$205,000, same as above.Signed on 2000-03-10. Completion date: 2001-06-30.
-$34,962, same as above.Signed on 2000-05-15. Completion date: 2000-12-31.
-$132,963, same as above.Signed on 2000-03-24. Completion date: 2000-06-30.
LEADING AERONAUTICAL TECHNOLOG (739 SAN RAFAEL PL in PALO ALTO, CA; small business) : $723,575 in 2 contractsfrom 1999 to 2000
$365,000 with Army for Other Defense -- Applied Research and Exploratory Development (R&D). Signed on 1999-11-18. Completion date: 2001-11-18.
$358,575, same as above.Signed on 2000-07-26. Completion date: 2001-11-18.
frank wolak (Stanford Unversity in Stanford, CA; small business) : $651,998 in 4 contractsfrom 1999 to 2005
$431,664 with Offices, Boards and Divisions (includes Attorney General, Deputy Attorney General, etc.) for Expert Witness. Taking place in DC. Signed on 2005-07-05. Completion date: 2005-11-15.
$98,334 with Offices, Boards and Divisions (includes Attorney General, Deputy Attorney General, etc.) for Expert Witness. Signed on 2004-09-24. Completion date: 2005-06-01.
$69,000 with Offices, Boards and Divisions (includes Attorney General, Deputy Attorney General, etc.) for Expert Witness. Taking place in DC. Signed on 1999-11-15. Completion date: 2000-04-15.
$53,000, same as above.Signed on 2001-05-15. Completion date: 2001-05-15.
CASCADE TECHNOLOGIES, INC (812 ESPLANADA WAY in STANFORD, CA; small business) : $569,995 in 2 contractsfrom 2004 to 2005
$500,000 with Navy for Defense Electronics and Communication Equipment -- Applied Research and Exploratory Development (R&D). Signed on 2005-08-26. Completion date: 2007-08-31.
$69,995 with Navy for Defense Electronics and Communication Equipment -- Basic Research (R&D). Signed on 2004-02-20. Completion date: 2004-08-19.
JEFFREY ZWIEBEL (2 RYAN COURT in STANFORD, CA) : $451,250 in 5 contractsfrom 2001 to 2005
Contracts for Legal Services, Expert Witness by Offices, Boards and Divisions (includes Attorney General, Deputy Attorney General, etc.) Signed by year:2000: $0; 2001: $50,000; 2002: $0; 2003: $290,000; 2004: $41,250; 2005: $70,000; 2006: $0.
Biggest contracts:
$145,000 with Offices, Boards and Divisions (includes Attorney General, Deputy Attorney General, etc.) for Legal Services. Signed on 2003-09-09. Completion date: 2004-09-08.
$145,000 with Offices, Boards and Divisions (includes Attorney General, Deputy Attorney General, etc.) for Legal Services. Taking place in DC. Signed on 2003-08-15. Completion date: 2004-09-15.
$70,000 with Offices, Boards and Divisions (includes Attorney General, Deputy Attorney General, etc.) for Expert Witness. Taking place in DC. Signed on 2005-02-28. Completion date: 2006-02-28.
$50,000 with Offices, Boards and Divisions (includes Attorney General, Deputy Attorney General, etc.) for Legal Services. Taking place in DC. Signed on 2001-05-15. Completion date: 2001-09-15.
THE LELAND JUNIOR STANFORD UNI (CENTER FOR ECNMIC DVPMENT in STANFORD, CA; small business) : $262,000 in 2 contractsin 2001
$188,000 with Offices, Boards and Divisions (includes Attorney General, Deputy Attorney General, etc.) for Expert Witness. Taking place in DC. Signed on 2001-02-15. Completion date: 2001-09-15.
$74,000, same as above.Signed on 2001-04-15. Completion date: 2001-09-15.
joseph bankman (559 nathan abbot way in stanford, ct; small business) : $259,090 in 3 contractsfrom 2004 to 2005
$129,872 with Offices, Boards and Divisions (includes Attorney General, Deputy Attorney General, etc.) for Expert Witness. Signed on 2004-07-27. Completion date: 2005-01-05.
$120,968 with Offices, Boards and Divisions (includes Attorney General, Deputy Attorney General, etc.) for Expert Witness. Taking place in CT. Signed on 2004-07-23. Completion date: 2004-12-15.
$8,250, same as above.Signed on 2005-10-21. Completion date: 2006-08-15.
STANFORD, LELAND JUNIOR UNIVER (301 ENCINA HL in STANFORD, CA)
$199,670 with Navy for Other Research and Development -- Applied Research and Exploratory Development (R&D). Signed on 2000-06-09. Completion date: 2001-04-30.
Top industries in this zip code by the number of employees in 2005:
Educational Services: Colleges, Universities, and Professional Schools (over 1000 employees: 1 establishment)
Health Care and Social Assistance: General Medical and Surgical Hospitals (over 1000: 1)
Accommodation and Food Services: Food Service Contractors (100-249: 1, 50-99: 2, 10-19: 2, 5-9: 2, 1-4: 3)
Administrative and Support and Waste Management and Remediation Services: Janitorial Services (100-249: 1)
Professional, Scientific, and Technical Services: Research and Development in the Physical, Engineering, and Life Sciences (50-99: 1, 10-19: 1, 1-4: 1)
Professional, Scientific, and Technical Services: Research and Development in the Social Sciences and Humanities (20-49: 2, 10-19: 1, 5-9: 1)
Information: Newspaper Publishers (50-99: 1)
Other Services (except Public Administration): Civic and Social Organizations (50-99: 1)
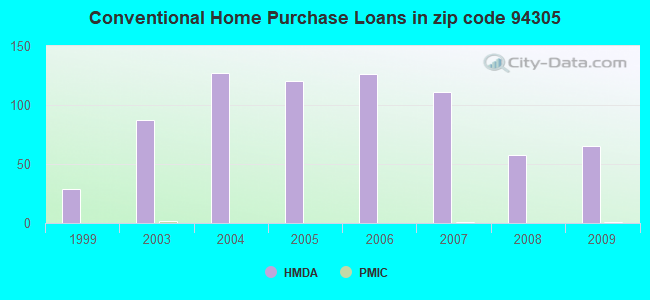
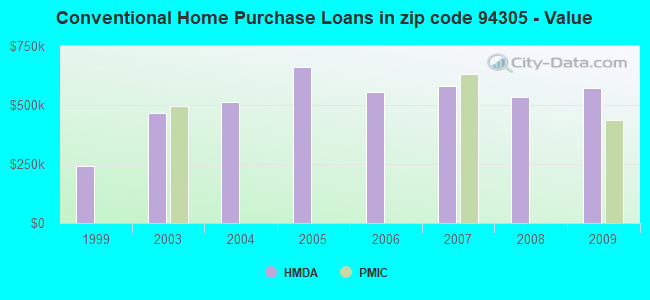
Detailed PMIC statistics for the following Tracts:5115.00
2007 - 2018 National Fire Incident Reporting System (NFIRS) incidents
Based on the data from the years 2007 - 2018 the average number of fire incidents per year is 25. The highest number of fire incidents - 40 took place in 2018, and the least - 0 in 2008. The data has a growing trend.
When looking into fire subcategories, the most incidents belonged to: Outside Fires (46.5%), and Structure Fires (33.7%).
Fire incident types reported to NFIRS in Zip Code 94305
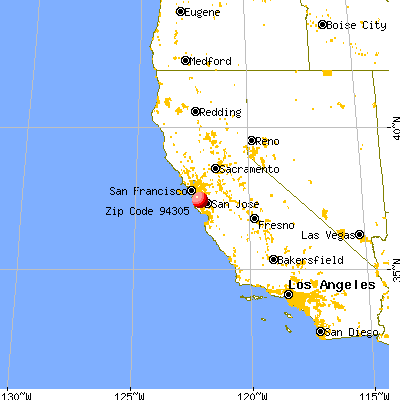


 Nearest zip codes: 94301, 94025, 94306, 94304, 94027, 94028.
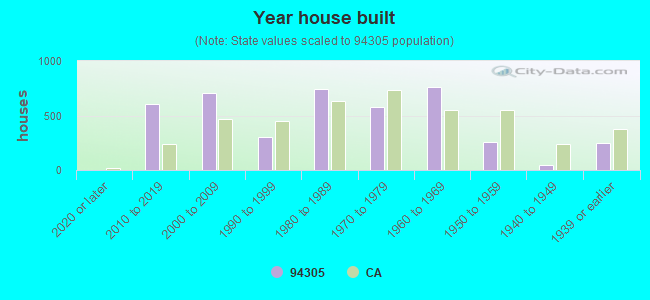


 Based on the data from the years 2007 - 2018 the average number of fire incidents per year is 25. The highest number of fire incidents - 40 took place in 2018, and the least - 0 in 2008. The data has a growing trend.
 When looking into fire subcategories, the most incidents belonged to: Outside Fires (46.5%), and Structure Fires (33.7%).