Estimated zip code population in 2022: 16,053
Zip code population in 2010: 12,717
Zip code population in 2000: 11,145
Houses and condos: 5,418
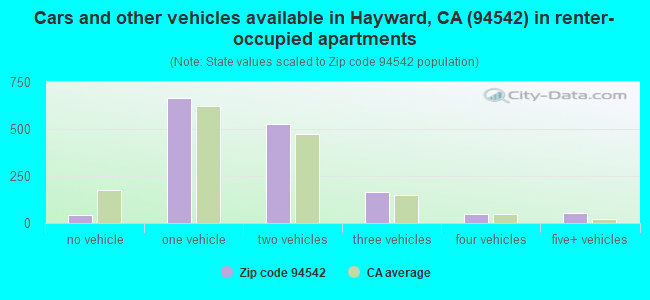
Renter-occupied apartments: 1,490
% of renters here:
29%State:
44%
March 2022 cost of living index in zip code 94542: 120.0
(high, U.S. average is 100)
Land area: 5.7
sq. mi.
Water area: 0.0
sq. mi.
Population density: 2,814 people per square mile (average).
OSM Map
General Map
Google Map
MSN Map
OSM Map
General Map
Google Map
MSN Map
OSM Map
General Map
Google Map
MSN Map
OSM Map
General Map
Google Map
MSN Map
Please wait while loading the map...
Real estate property taxes paid for housing units in 2022:
This zip code:
0.8% ($8,965)California:
0.7% ($4,831)
Median real estate property taxes paid for housing units with mortgages in 2022: $10,182 (0.9%)
Median real estate property taxes paid for housing units with no mortgage in 2022: $5,598 (0.5%)
Business Search - 14 Million verified businesses
Males: 8,649 Females: 7,403
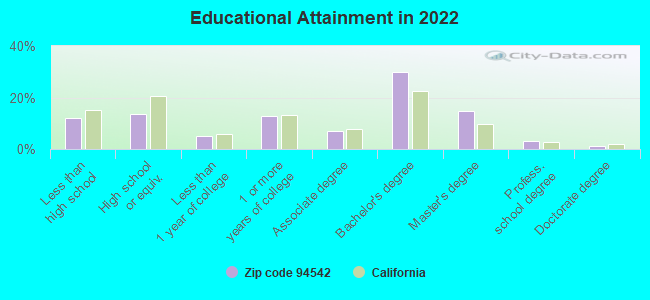
For population 25 years and over in 94542:
High school or higher: 88.2%Bachelor's degree or higher: 49.5%Graduate or professional degree: 19.4%Unemployed: 6.4%Mean travel time to work (commute): 35.9 minutes
For population 15 years and over in 94542:
Never married: 43.2%Now married: 48.7%Separated: 1.4%Widowed: 2.7%Divorced: 4.0%
Zip code 94542 compared to state average:
Median house value above state average. Black race population percentage above state average. Renting percentage below state average. Length of stay since moving in significantly above state average. Number of college students above state average. 4,673 29.1% White 4,293 26.7% Hispanic or Latino 3,807 23.7% Asian 1,597 10.0% Black 1,426 8.9% Two or more races 154 1.0% Native Hawaiian and Other 55 0.3% American Indian 45 0.3% Some other race
Data:
Median household income ($)
Median household income (% change since 2000)
Household income diversity
Ratio of average income to average house value (%)
Ratio of average income to average rent
Median household income ($) - White
Median household income ($) - Black or African American
Median household income ($) - Asian
Median household income ($) - Hispanic or Latino
Median household income ($) - American Indian and Alaska Native
Median household income ($) - Multirace
Median household income ($) - Other Race
Median household income for houses/condos with a mortgage ($)
Median household income for apartments without a mortgage ($)
Races - White alone (%)
Races - White alone (% change since 2000)
Races - Black alone (%)
Races - Black alone (% change since 2000)
Races - American Indian alone (%)
Races - American Indian alone (% change since 2000)
Races - Asian alone (%)
Races - Asian alone (% change since 2000)
Races - Hispanic (%)
Races - Hispanic (% change since 2000)
Races - Native Hawaiian and Other Pacific Islander alone (%)
Races - Native Hawaiian and Other Pacific Islander alone (% change since 2000)
Races - Two or more races (%)
Races - Two or more races (% change since 2000)
Races - Other race alone (%)
Races - Other race alone (% change since 2000)
Racial diversity
Unemployment (%)
Unemployment (% change since 2000)
Unemployment (%) - White
Unemployment (%) - Black or African American
Unemployment (%) - Asian
Unemployment (%) - Hispanic or Latino
Unemployment (%) - American Indian and Alaska Native
Unemployment (%) - Multirace
Unemployment (%) - Other Race
Population density (people per square mile)
Population - Males (%)
Population - Females (%)
Population - Males (%) - White
Population - Males (%) - Black or African American
Population - Males (%) - Asian
Population - Males (%) - Hispanic or Latino
Population - Males (%) - American Indian and Alaska Native
Population - Males (%) - Multirace
Population - Males (%) - Other Race
Population - Females (%) - White
Population - Females (%) - Black or African American
Population - Females (%) - Asian
Population - Females (%) - Hispanic or Latino
Population - Females (%) - American Indian and Alaska Native
Population - Females (%) - Multirace
Population - Females (%) - Other Race
Coronavirus confirmed cases (May 28, 2024)
Deaths caused by coronavirus (May 28, 2024)
Coronavirus confirmed cases (per 100k population) (May 28, 2024)
Deaths caused by coronavirus (per 100k population) (May 28, 2024)
Daily increase in number of cases (May 28, 2024)
Weekly increase in number of cases (May 28, 2024)
Cases doubled (in days) (May 28, 2024)
Hospitalized patients (Apr 18, 2022)
Negative test results (Apr 18, 2022)
Total test results (Apr 18, 2022)
COVID Vaccine doses distributed (per 100k population) (Sep 19, 2023)
COVID Vaccine doses administered (per 100k population) (Sep 19, 2023)
COVID Vaccine doses distributed (Sep 19, 2023)
COVID Vaccine doses administered (Sep 19, 2023)
Likely homosexual households (%)
Likely homosexual households (% change since 2000)
Likely homosexual households - Lesbian couples (%)
Likely homosexual households - Lesbian couples (% change since 2000)
Likely homosexual households - Gay men (%)
Likely homosexual households - Gay men (% change since 2000)
Cost of living index
Median gross rent ($)
Median contract rent ($)
Median monthly housing costs ($)
Median house or condo value ($)
Median house or condo value ($ change since 2000)
Mean house or condo value by units in structure - 1, detached ($)
Mean house or condo value by units in structure - 1, attached ($)
Mean house or condo value by units in structure - 2 ($)
Mean house or condo value by units in structure by units in structure - 3 or 4 ($)
Mean house or condo value by units in structure - 5 or more ($)
Mean house or condo value by units in structure - Boat, RV, van, etc. ($)
Mean house or condo value by units in structure - Mobile home ($)
Median house or condo value ($) - White
Median house or condo value ($) - Black or African American
Median house or condo value ($) - Asian
Median house or condo value ($) - Hispanic or Latino
Median house or condo value ($) - American Indian and Alaska Native
Median house or condo value ($) - Multirace
Median house or condo value ($) - Other Race
Median resident age
Resident age diversity
Median resident age - Males
Median resident age - Females
Median resident age - White
Median resident age - Black or African American
Median resident age - Asian
Median resident age - Hispanic or Latino
Median resident age - American Indian and Alaska Native
Median resident age - Multirace
Median resident age - Other Race
Median resident age - Males - White
Median resident age - Males - Black or African American
Median resident age - Males - Asian
Median resident age - Males - Hispanic or Latino
Median resident age - Males - American Indian and Alaska Native
Median resident age - Males - Multirace
Median resident age - Males - Other Race
Median resident age - Females - White
Median resident age - Females - Black or African American
Median resident age - Females - Asian
Median resident age - Females - Hispanic or Latino
Median resident age - Females - American Indian and Alaska Native
Median resident age - Females - Multirace
Median resident age - Females - Other Race
Commute - mean travel time to work (minutes)
Travel time to work - Less than 5 minutes (%)
Travel time to work - Less than 5 minutes (% change since 2000)
Travel time to work - 5 to 9 minutes (%)
Travel time to work - 5 to 9 minutes (% change since 2000)
Travel time to work - 10 to 19 minutes (%)
Travel time to work - 10 to 19 minutes (% change since 2000)
Travel time to work - 20 to 29 minutes (%)
Travel time to work - 20 to 29 minutes (% change since 2000)
Travel time to work - 30 to 39 minutes (%)
Travel time to work - 30 to 39 minutes (% change since 2000)
Travel time to work - 40 to 59 minutes (%)
Travel time to work - 40 to 59 minutes (% change since 2000)
Travel time to work - 60 to 89 minutes (%)
Travel time to work - 60 to 89 minutes (% change since 2000)
Travel time to work - 90 or more minutes (%)
Travel time to work - 90 or more minutes (% change since 2000)
Marital status - Never married (%)
Marital status - Now married (%)
Marital status - Separated (%)
Marital status - Widowed (%)
Marital status - Divorced (%)
Median family income ($)
Median family income (% change since 2000)
Median non-family income ($)
Median non-family income (% change since 2000)
Median per capita income ($)
Median per capita income (% change since 2000)
Median family income ($) - White
Median family income ($) - Black or African American
Median family income ($) - Asian
Median family income ($) - Hispanic or Latino
Median family income ($) - American Indian and Alaska Native
Median family income ($) - Multirace
Median family income ($) - Other Race
Median year house/condo built
Median year apartment built
Year house built - Built 2005 or later (%)
Year house built - Built 2000 to 2004 (%)
Year house built - Built 1990 to 1999 (%)
Year house built - Built 1980 to 1989 (%)
Year house built - Built 1970 to 1979 (%)
Year house built - Built 1960 to 1969 (%)
Year house built - Built 1950 to 1959 (%)
Year house built - Built 1940 to 1949 (%)
Year house built - Built 1939 or earlier (%)
Average household size
Household density (households per square mile)
Average household size - White
Average household size - Black or African American
Average household size - Asian
Average household size - Hispanic or Latino
Average household size - American Indian and Alaska Native
Average household size - Multirace
Average household size - Other Race
Occupied housing units (%)
Vacant housing units (%)
Owner occupied housing units (%)
Renter occupied housing units (%)
Vacancy status - For rent (%)
Vacancy status - For sale only (%)
Vacancy status - Rented or sold, not occupied (%)
Vacancy status - For seasonal, recreational, or occasional use (%)
Vacancy status - For migrant workers (%)
Vacancy status - Other vacant (%)
Residents with income below the poverty level (%)
Residents with income below 50% of the poverty level (%)
Children below poverty level (%)
Poor families by family type - Married-couple family (%)
Poor families by family type - Male, no wife present (%)
Poor families by family type - Female, no husband present (%)
Poverty status for native-born residents (%)
Poverty status for foreign-born residents (%)
Poverty among high school graduates not in families (%)
Poverty among people who did not graduate high school not in families (%)
Residents with income below the poverty level (%) - White
Residents with income below the poverty level (%) - Black or African American
Residents with income below the poverty level (%) - Asian
Residents with income below the poverty level (%) - Hispanic or Latino
Residents with income below the poverty level (%) - American Indian and Alaska Native
Residents with income below the poverty level (%) - Multirace
Residents with income below the poverty level (%) - Other Race
Air pollution - Air Quality Index (AQI)
Air pollution - CO
Air pollution - NO2
Air pollution - SO2
Air pollution - Ozone
Air pollution - PM10
Air pollution - PM25
Air pollution - Pb
Crime - Murders per 100,000 population
Crime - Rapes per 100,000 population
Crime - Robberies per 100,000 population
Crime - Assaults per 100,000 population
Crime - Burglaries per 100,000 population
Crime - Thefts per 100,000 population
Crime - Auto thefts per 100,000 population
Crime - Arson per 100,000 population
Crime - City-data.com crime index
Crime - Violent crime index
Crime - Property crime index
Crime - Murders per 100,000 population (5 year average)
Crime - Rapes per 100,000 population (5 year average)
Crime - Robberies per 100,000 population (5 year average)
Crime - Assaults per 100,000 population (5 year average)
Crime - Burglaries per 100,000 population (5 year average)
Crime - Thefts per 100,000 population (5 year average)
Crime - Auto thefts per 100,000 population (5 year average)
Crime - Arson per 100,000 population (5 year average)
Crime - City-data.com crime index (5 year average)
Crime - Violent crime index (5 year average)
Crime - Property crime index (5 year average)
1996 Presidential Elections Results (%) - Democratic Party (Clinton)
1996 Presidential Elections Results (%) - Republican Party (Dole)
1996 Presidential Elections Results (%) - Other
2000 Presidential Elections Results (%) - Democratic Party (Gore)
2000 Presidential Elections Results (%) - Republican Party (Bush)
2000 Presidential Elections Results (%) - Other
2004 Presidential Elections Results (%) - Democratic Party (Kerry)
2004 Presidential Elections Results (%) - Republican Party (Bush)
2004 Presidential Elections Results (%) - Other
2008 Presidential Elections Results (%) - Democratic Party (Obama)
2008 Presidential Elections Results (%) - Republican Party (McCain)
2008 Presidential Elections Results (%) - Other
2012 Presidential Elections Results (%) - Democratic Party (Obama)
2012 Presidential Elections Results (%) - Republican Party (Romney)
2012 Presidential Elections Results (%) - Other
2016 Presidential Elections Results (%) - Democratic Party (Clinton)
2016 Presidential Elections Results (%) - Republican Party (Trump)
2016 Presidential Elections Results (%) - Other
2020 Presidential Elections Results (%) - Democratic Party (Biden)
2020 Presidential Elections Results (%) - Republican Party (Trump)
2020 Presidential Elections Results (%) - Other
Ancestries Reported - Arab (%)
Ancestries Reported - Czech (%)
Ancestries Reported - Danish (%)
Ancestries Reported - Dutch (%)
Ancestries Reported - English (%)
Ancestries Reported - French (%)
Ancestries Reported - French Canadian (%)
Ancestries Reported - German (%)
Ancestries Reported - Greek (%)
Ancestries Reported - Hungarian (%)
Ancestries Reported - Irish (%)
Ancestries Reported - Italian (%)
Ancestries Reported - Lithuanian (%)
Ancestries Reported - Norwegian (%)
Ancestries Reported - Polish (%)
Ancestries Reported - Portuguese (%)
Ancestries Reported - Russian (%)
Ancestries Reported - Scotch-Irish (%)
Ancestries Reported - Scottish (%)
Ancestries Reported - Slovak (%)
Ancestries Reported - Subsaharan African (%)
Ancestries Reported - Swedish (%)
Ancestries Reported - Swiss (%)
Ancestries Reported - Ukrainian (%)
Ancestries Reported - United States (%)
Ancestries Reported - Welsh (%)
Ancestries Reported - West Indian (%)
Ancestries Reported - Other (%)
Educational Attainment - No schooling completed (%)
Educational Attainment - Less than high school (%)
Educational Attainment - High school or equivalent (%)
Educational Attainment - Less than 1 year of college (%)
Educational Attainment - 1 or more years of college (%)
Educational Attainment - Associate degree (%)
Educational Attainment - Bachelor's degree (%)
Educational Attainment - Master's degree (%)
Educational Attainment - Professional school degree (%)
Educational Attainment - Doctorate degree (%)
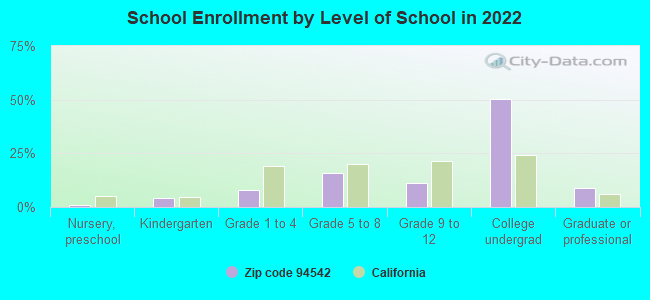
School Enrollment - Nursery, preschool (%)
School Enrollment - Kindergarten (%)
School Enrollment - Grade 1 to 4 (%)
School Enrollment - Grade 5 to 8 (%)
School Enrollment - Grade 9 to 12 (%)
School Enrollment - College undergrad (%)
School Enrollment - Graduate or professional (%)
School Enrollment - Not enrolled in school (%)
School enrollment - Public schools (%)
School enrollment - Private schools (%)
School enrollment - Not enrolled (%)
Median number of rooms in houses and condos
Median number of rooms in apartments
Housing units lacking complete plumbing facilities (%)
Housing units lacking complete kitchen facilities (%)
Density of houses
Urban houses (%)
Rural houses (%)
Households with people 60 years and over (%)
Households with people 65 years and over (%)
Households with people 75 years and over (%)
Households with one or more nonrelatives (%)
Households with no nonrelatives (%)
Population in households (%)
Family households (%)
Nonfamily households (%)
Population in families (%)
Family households with own children (%)
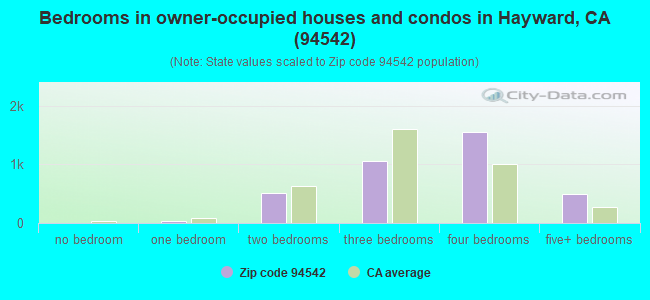
Median number of bedrooms in owner occupied houses
Mean number of bedrooms in owner occupied houses
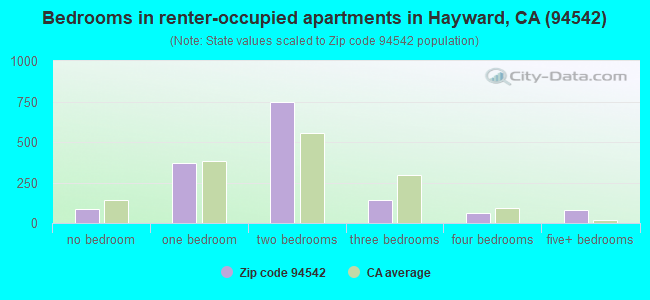
Median number of bedrooms in renter occupied houses
Mean number of bedrooms in renter occupied houses
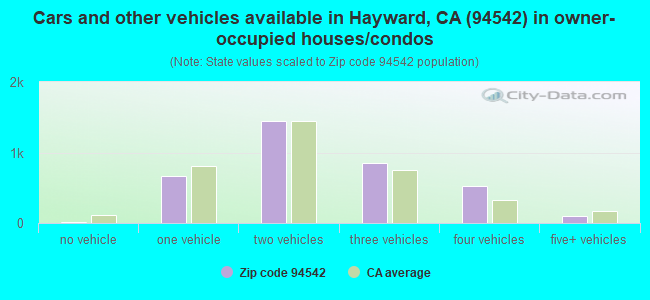
Median number of vehichles in owner occupied houses
Mean number of vehichles in owner occupied houses
Median number of vehichles in renter occupied houses
Mean number of vehichles in renter occupied houses
Mortgage status - with mortgage (%)
Mortgage status - with second mortgage (%)
Mortgage status - with home equity loan (%)
Mortgage status - with both second mortgage and home equity loan (%)
Mortgage status - without a mortgage (%)
Average family size
Average family size - White
Average family size - Black or African American
Average family size - Asian
Average family size - Hispanic or Latino
Average family size - American Indian and Alaska Native
Average family size - Multirace
Average family size - Other Race
Geographical mobility - Same house 1 year ago (%)
Geographical mobility - Moved within same county (%)
Geographical mobility - Moved from different county within same state (%)
Geographical mobility - Moved from different state (%)
Geographical mobility - Moved from abroad (%)
Place of birth - Born in state of residence (%)
Place of birth - Born in other state (%)
Place of birth - Native, outside of US (%)
Place of birth - Foreign born (%)
Housing units in structures - 1, detached (%)
Housing units in structures - 1, attached (%)
Housing units in structures - 2 (%)
Housing units in structures - 3 or 4 (%)
Housing units in structures - 5 to 9 (%)
Housing units in structures - 10 to 19 (%)
Housing units in structures - 20 to 49 (%)
Housing units in structures - 50 or more (%)
Housing units in structures - Mobile home (%)
Housing units in structures - Boat, RV, van, etc. (%)
House/condo owner moved in on average (years ago)
Renter moved in on average (years ago)
Year householder moved into unit - Moved in 1999 to March 2000 (%)
Year householder moved into unit - Moved in 1995 to 1998 (%)
Year householder moved into unit - Moved in 1990 to 1994 (%)
Year householder moved into unit - Moved in 1980 to 1989 (%)
Year householder moved into unit - Moved in 1970 to 1979 (%)
Year householder moved into unit - Moved in 1969 or earlier (%)
Means of transportation to work - Drove car alone (%)
Means of transportation to work - Carpooled (%)
Means of transportation to work - Public transportation (%)
Means of transportation to work - Bus or trolley bus (%)
Means of transportation to work - Streetcar or trolley car (%)
Means of transportation to work - Subway or elevated (%)
Means of transportation to work - Railroad (%)
Means of transportation to work - Ferryboat (%)
Means of transportation to work - Taxicab (%)
Means of transportation to work - Motorcycle (%)
Means of transportation to work - Bicycle (%)
Means of transportation to work - Walked (%)
Means of transportation to work - Other means (%)
Working at home (%)
Industry diversity
Most Common Industries - Agriculture, forestry, fishing and hunting, and mining (%)
Most Common Industries - Agriculture, forestry, fishing and hunting (%)
Most Common Industries - Mining, quarrying, and oil and gas extraction (%)
Most Common Industries - Construction (%)
Most Common Industries - Manufacturing (%)
Most Common Industries - Wholesale trade (%)
Most Common Industries - Retail trade (%)
Most Common Industries - Transportation and warehousing, and utilities (%)
Most Common Industries - Transportation and warehousing (%)
Most Common Industries - Utilities (%)
Most Common Industries - Information (%)
Most Common Industries - Finance and insurance, and real estate and rental and leasing (%)
Most Common Industries - Finance and insurance (%)
Most Common Industries - Real estate and rental and leasing (%)
Most Common Industries - Professional, scientific, and management, and administrative and waste management services (%)
Most Common Industries - Professional, scientific, and technical services (%)
Most Common Industries - Management of companies and enterprises (%)
Most Common Industries - Administrative and support and waste management services (%)
Most Common Industries - Educational services, and health care and social assistance (%)
Most Common Industries - Educational services (%)
Most Common Industries - Health care and social assistance (%)
Most Common Industries - Arts, entertainment, and recreation, and accommodation and food services (%)
Most Common Industries - Arts, entertainment, and recreation (%)
Most Common Industries - Accommodation and food services (%)
Most Common Industries - Other services, except public administration (%)
Most Common Industries - Public administration (%)
Occupation diversity
Most Common Occupations - Management, business, science, and arts occupations (%)
Most Common Occupations - Management, business, and financial occupations (%)
Most Common Occupations - Management occupations (%)
Most Common Occupations - Business and financial operations occupations (%)
Most Common Occupations - Computer, engineering, and science occupations (%)
Most Common Occupations - Computer and mathematical occupations (%)
Most Common Occupations - Architecture and engineering occupations (%)
Most Common Occupations - Life, physical, and social science occupations (%)
Most Common Occupations - Education, legal, community service, arts, and media occupations (%)
Most Common Occupations - Community and social service occupations (%)
Most Common Occupations - Legal occupations (%)
Most Common Occupations - Education, training, and library occupations (%)
Most Common Occupations - Arts, design, entertainment, sports, and media occupations (%)
Most Common Occupations - Healthcare practitioners and technical occupations (%)
Most Common Occupations - Health diagnosing and treating practitioners and other technical occupations (%)
Most Common Occupations - Health technologists and technicians (%)
Most Common Occupations - Service occupations (%)
Most Common Occupations - Healthcare support occupations (%)
Most Common Occupations - Protective service occupations (%)
Most Common Occupations - Fire fighting and prevention, and other protective service workers including supervisors (%)
Most Common Occupations - Law enforcement workers including supervisors (%)
Most Common Occupations - Food preparation and serving related occupations (%)
Most Common Occupations - Building and grounds cleaning and maintenance occupations (%)
Most Common Occupations - Personal care and service occupations (%)
Most Common Occupations - Sales and office occupations (%)
Most Common Occupations - Sales and related occupations (%)
Most Common Occupations - Office and administrative support occupations (%)
Most Common Occupations - Natural resources, construction, and maintenance occupations (%)
Most Common Occupations - Farming, fishing, and forestry occupations (%)
Most Common Occupations - Construction and extraction occupations (%)
Most Common Occupations - Installation, maintenance, and repair occupations (%)
Most Common Occupations - Production, transportation, and material moving occupations (%)
Most Common Occupations - Production occupations (%)
Most Common Occupations - Transportation occupations (%)
Most Common Occupations - Material moving occupations (%)
People in Group quarters - Institutionalized population (%)
People in Group quarters - Correctional institutions (%)
People in Group quarters - Federal prisons and detention centers (%)
People in Group quarters - Halfway houses (%)
People in Group quarters - Local jails and other confinement facilities (including police lockups) (%)
People in Group quarters - Military disciplinary barracks (%)
People in Group quarters - State prisons (%)
People in Group quarters - Other types of correctional institutions (%)
People in Group quarters - Nursing homes (%)
People in Group quarters - Hospitals/wards, hospices, and schools for the handicapped (%)
People in Group quarters - Hospitals/wards and hospices for chronically ill (%)
People in Group quarters - Hospices or homes for chronically ill (%)
People in Group quarters - Military hospitals or wards for chronically ill (%)
People in Group quarters - Other hospitals or wards for chronically ill (%)
People in Group quarters - Hospitals or wards for drug/alcohol abuse (%)
People in Group quarters - Mental (Psychiatric) hospitals or wards (%)
People in Group quarters - Schools, hospitals, or wards for the mentally retarded (%)
People in Group quarters - Schools, hospitals, or wards for the physically handicapped (%)
People in Group quarters - Institutions for the deaf (%)
People in Group quarters - Institutions for the blind (%)
People in Group quarters - Orthopedic wards and institutions for the physically handicapped (%)
People in Group quarters - Wards in general hospitals for patients who have no usual home elsewhere (%)
People in Group quarters - Wards in military hospitals for patients who have no usual home elsewhere (%)
People in Group quarters - Juvenile institutions (%)
People in Group quarters - Long-term care (%)
People in Group quarters - Homes for abused, dependent, and neglected children (%)
People in Group quarters - Residential treatment centers for emotionally disturbed children (%)
People in Group quarters - Training schools for juvenile delinquents (%)
People in Group quarters - Short-term care, detention or diagnostic centers for delinquent children (%)
People in Group quarters - Type of juvenile institution unknown (%)
People in Group quarters - Noninstitutionalized population (%)
People in Group quarters - College dormitories (includes college quarters off campus) (%)
People in Group quarters - Military quarters (%)
People in Group quarters - On base (%)
People in Group quarters - Barracks, unaccompanied personnel housing (UPH), (Enlisted/Officer), ;and similar group living quarters for military personnel (%)
People in Group quarters - Transient quarters for temporary residents (%)
People in Group quarters - Military ships (%)
People in Group quarters - Group homes (%)
People in Group quarters - Homes or halfway houses for drug/alcohol abuse (%)
People in Group quarters - Homes for the mentally ill (%)
People in Group quarters - Homes for the mentally retarded (%)
People in Group quarters - Homes for the physically handicapped (%)
People in Group quarters - Other group homes (%)
People in Group quarters - Religious group quarters (%)
People in Group quarters - Dormitories (%)
People in Group quarters - Agriculture workers' dormitories on farms (%)
People in Group quarters - Job Corps and vocational training facilities (%)
People in Group quarters - Other workers' dormitories (%)
People in Group quarters - Crews of maritime vessels (%)
People in Group quarters - Other nonhousehold living situations (%)
People in Group quarters - Other noninstitutional group quarters (%)
Residents speaking English at home (%)
Residents speaking English at home - Born in the United States (%)
Residents speaking English at home - Native, born elsewhere (%)
Residents speaking English at home - Foreign born (%)
Residents speaking Spanish at home (%)
Residents speaking Spanish at home - Born in the United States (%)
Residents speaking Spanish at home - Native, born elsewhere (%)
Residents speaking Spanish at home - Foreign born (%)
Residents speaking other language at home (%)
Residents speaking other language at home - Born in the United States (%)
Residents speaking other language at home - Native, born elsewhere (%)
Residents speaking other language at home - Foreign born (%)
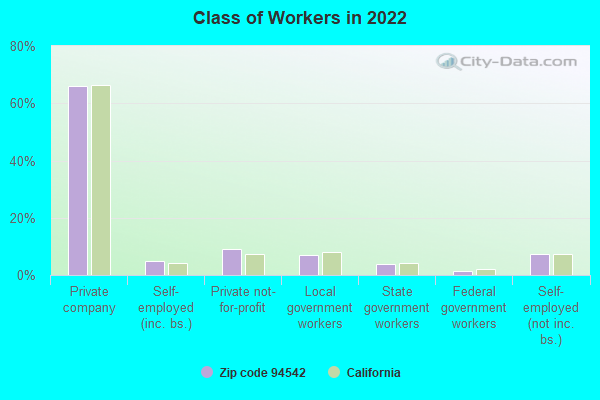
Class of Workers - Employee of private company (%)
Class of Workers - Self-employed in own incorporated business (%)
Class of Workers - Private not-for-profit wage and salary workers (%)
Class of Workers - Local government workers (%)
Class of Workers - State government workers (%)
Class of Workers - Federal government workers (%)
Class of Workers - Self-employed workers in own not incorporated business and Unpaid family workers (%)
House heating fuel used in houses and condos - Utility gas (%)
House heating fuel used in houses and condos - Bottled, tank, or LP gas (%)
House heating fuel used in houses and condos - Electricity (%)
House heating fuel used in houses and condos - Fuel oil, kerosene, etc. (%)
House heating fuel used in houses and condos - Coal or coke (%)
House heating fuel used in houses and condos - Wood (%)
House heating fuel used in houses and condos - Solar energy (%)
House heating fuel used in houses and condos - Other fuel (%)
House heating fuel used in houses and condos - No fuel used (%)
House heating fuel used in apartments - Utility gas (%)
House heating fuel used in apartments - Bottled, tank, or LP gas (%)
House heating fuel used in apartments - Electricity (%)
House heating fuel used in apartments - Fuel oil, kerosene, etc. (%)
House heating fuel used in apartments - Coal or coke (%)
House heating fuel used in apartments - Wood (%)
House heating fuel used in apartments - Solar energy (%)
House heating fuel used in apartments - Other fuel (%)
House heating fuel used in apartments - No fuel used (%)
Armed forces status - In Armed Forces (%)
Armed forces status - Civilian (%)
Armed forces status - Civilian - Veteran (%)
Armed forces status - Civilian - Nonveteran (%)
Fatal accidents locations in years 2005-2021
Fatal accidents locations in 2005
Fatal accidents locations in 2006
Fatal accidents locations in 2007
Fatal accidents locations in 2008
Fatal accidents locations in 2009
Fatal accidents locations in 2010
Fatal accidents locations in 2011
Fatal accidents locations in 2012
Fatal accidents locations in 2013
Fatal accidents locations in 2014
Fatal accidents locations in 2015
Fatal accidents locations in 2016
Fatal accidents locations in 2017
Fatal accidents locations in 2018
Fatal accidents locations in 2019
Fatal accidents locations in 2020
Fatal accidents locations in 2021
Alcohol use - People drinking some alcohol every month (%)
Alcohol use - People not drinking at all (%)
Alcohol use - Average days/month drinking alcohol
Alcohol use - Average drinks/week
Alcohol use - Average days/year people drink much
Audiometry - Average condition of hearing (%)
Audiometry - People that can hear a whisper from across a quiet room (%)
Audiometry - People that can hear normal voice from across a quiet room (%)
Audiometry - Ears ringing, roaring, buzzing (%)
Audiometry - Had a job exposure to loud noise (%)
Audiometry - Had off-work exposure to loud noise (%)
Blood Pressure & Cholesterol - Has high blood pressure (%)
Blood Pressure & Cholesterol - Checking blood pressure at home (%)
Blood Pressure & Cholesterol - Frequently checking blood cholesterol (%)
Blood Pressure & Cholesterol - Has high cholesterol level (%)
Consumer Behavior - Money monthly spent on food at supermarket/grocery store
Consumer Behavior - Money monthly spent on food at other stores
Consumer Behavior - Money monthly spent on eating out
Consumer Behavior - Money monthly spent on carryout/delivered foods
Consumer Behavior - Income spent on food at supermarket/grocery store (%)
Consumer Behavior - Income spent on food at other stores (%)
Consumer Behavior - Income spent on eating out (%)
Consumer Behavior - Income spent on carryout/delivered foods (%)
Current Health Status - General health condition (%)
Current Health Status - Blood donors (%)
Current Health Status - Has blood ever tested for HIV virus (%)
Current Health Status - Left-handed people (%)
Dermatology - People using sunscreen (%)
Diabetes - Diabetics (%)
Diabetes - Had a blood test for high blood sugar (%)
Diabetes - People taking insulin (%)
Diet Behavior & Nutrition - Diet health (%)
Diet Behavior & Nutrition - Milk product consumption (# of products/month)
Diet Behavior & Nutrition - Meals not home prepared (#/week)
Diet Behavior & Nutrition - Meals from fast food or pizza place (#/week)
Diet Behavior & Nutrition - Ready-to-eat foods (#/month)
Diet Behavior & Nutrition - Frozen meals/pizza (#/month)
Drug Use - People that ever used marijuana or hashish (%)
Drug Use - Ever used hard drugs (%)
Drug Use - Ever used any form of cocaine (%)
Drug Use - Ever used heroin (%)
Drug Use - Ever used methamphetamine (%)
Health Insurance - People covered by health insurance (%)
Kidney Conditions-Urology - Avg. # of times urinating at night
Medical Conditions - People with asthma (%)
Medical Conditions - People with anemia (%)
Medical Conditions - People with psoriasis (%)
Medical Conditions - People with overweight (%)
Medical Conditions - Elderly people having difficulties in thinking or remembering (%)
Medical Conditions - People who ever received blood transfusion (%)
Medical Conditions - People having trouble seeing even with glass/contacts (%)
Medical Conditions - People with arthritis (%)
Medical Conditions - People with gout (%)
Medical Conditions - People with congestive heart failure (%)
Medical Conditions - People with coronary heart disease (%)
Medical Conditions - People with angina pectoris (%)
Medical Conditions - People who ever had heart attack (%)
Medical Conditions - People who ever had stroke (%)
Medical Conditions - People with emphysema (%)
Medical Conditions - People with thyroid problem (%)
Medical Conditions - People with chronic bronchitis (%)
Medical Conditions - People with any liver condition (%)
Medical Conditions - People who ever had cancer or malignancy (%)
Mental Health - People who have little interest in doing things (%)
Mental Health - People feeling down, depressed, or hopeless (%)
Mental Health - People who have trouble sleeping or sleeping too much (%)
Mental Health - People feeling tired or having little energy (%)
Mental Health - People with poor appetite or overeating (%)
Mental Health - People feeling bad about themself (%)
Mental Health - People who have trouble concentrating on things (%)
Mental Health - People moving or speaking slowly or too fast (%)
Mental Health - People having thoughts they would be better off dead (%)
Oral Health - Average years since last visit a dentist
Oral Health - People embarrassed because of mouth (%)
Oral Health - People with gum disease (%)
Oral Health - General health of teeth and gums (%)
Oral Health - Average days a week using dental floss/device
Oral Health - Average days a week using mouthwash for dental problem
Oral Health - Average number of teeth
Pesticide Use - Households using pesticides to control insects (%)
Pesticide Use - Households using pesticides to kill weeds (%)
Physical Activity - People doing vigorous-intensity work activities (%)
Physical Activity - People doing moderate-intensity work activities (%)
Physical Activity - People walking or bicycling (%)
Physical Activity - People doing vigorous-intensity recreational activities (%)
Physical Activity - People doing moderate-intensity recreational activities (%)
Physical Activity - Average hours a day doing sedentary activities
Physical Activity - Average hours a day watching TV or videos
Physical Activity - Average hours a day using computer
Physical Functioning - People having limitations keeping them from working (%)
Physical Functioning - People limited in amount of work they can do (%)
Physical Functioning - People that need special equipment to walk (%)
Physical Functioning - People experiencing confusion/memory problems (%)
Physical Functioning - People requiring special healthcare equipment (%)
Prescription Medications - Average number of prescription medicines taking
Preventive Aspirin Use - Adults 40+ taking low-dose aspirin (%)
Reproductive Health - Vaginal deliveries (%)
Reproductive Health - Cesarean deliveries (%)
Reproductive Health - Deliveries resulted in a live birth (%)
Reproductive Health - Pregnancies resulted in a delivery (%)
Reproductive Health - Women breastfeeding newborns (%)
Reproductive Health - Women that had a hysterectomy (%)
Reproductive Health - Women that had both ovaries removed (%)
Reproductive Health - Women that have ever taken birth control pills (%)
Reproductive Health - Women taking birth control pills (%)
Reproductive Health - Women that have ever used Depo-Provera or injectables (%)
Reproductive Health - Women that have ever used female hormones (%)
Sexual Behavior - People 18+ that ever had sex (vaginal, anal, or oral) (%)
Sexual Behavior - Males 18+ that ever had vaginal sex with a woman (%)
Sexual Behavior - Males 18+ that ever performed oral sex on a woman (%)
Sexual Behavior - Males 18+ that ever had anal sex with a woman (%)
Sexual Behavior - Males 18+ that ever had any sex with a man (%)
Sexual Behavior - Females 18+ that ever had vaginal sex with a man (%)
Sexual Behavior - Females 18+ that ever performed oral sex on a man (%)
Sexual Behavior - Females 18+ that ever had anal sex with a man (%)
Sexual Behavior - Females 18+ that ever had any kind of sex with a woman (%)
Sexual Behavior - Average age people first had sex
Sexual Behavior - Average number of female sex partners in lifetime (males 18+)
Sexual Behavior - Average number of female vaginal sex partners in lifetime (males 18+)
Sexual Behavior - Average age people first performed oral sex on a woman (18+)
Sexual Behavior - Average number of woman performed oral sex on in lifetime (18+)
Sexual Behavior - Average number of male sex partners in lifetime (males 18+)
Sexual Behavior - Average number of male anal sex partners in lifetime (males 18+)
Sexual Behavior - Average age people first performed oral sex on a man (18+)
Sexual Behavior - Average number of male oral sex partners in lifetime (18+)
Sexual Behavior - People using protection when performing oral sex (%)
Sexual Behavior - Average number of times people have vaginal or anal sex a year
Sexual Behavior - People having sex without condom (%)
Sexual Behavior - Average number of male sex partners in lifetime (females 18+)
Sexual Behavior - Average number of male vaginal sex partners in lifetime (females 18+)
Sexual Behavior - Average number of female sex partners in lifetime (females 18+)
Sexual Behavior - Circumcised males 18+ (%)
Sleep Disorders - Average hours sleeping at night
Sleep Disorders - People that has trouble sleeping (%)
Smoking-Cigarette Use - People smoking cigarettes (%)
Taste & Smell - People 40+ having problems with smell (%)
Taste & Smell - People 40+ having problems with taste (%)
Taste & Smell - People 40+ that ever had wisdom teeth removed (%)
Taste & Smell - People 40+ that ever had tonsils teeth removed (%)
Taste & Smell - People 40+ that ever had a loss of consciousness because of a head injury (%)
Taste & Smell - People 40+ that ever had a broken nose or other serious injury to face or skull (%)
Taste & Smell - People 40+ that ever had two or more sinus infections (%)
Weight - Average height (inches)
Weight - Average weight (pounds)
Weight - Average BMI
Weight - People that are obese (%)
Weight - People that ever were obese (%)
Weight - People trying to lose weight (%)
100%
urban population.
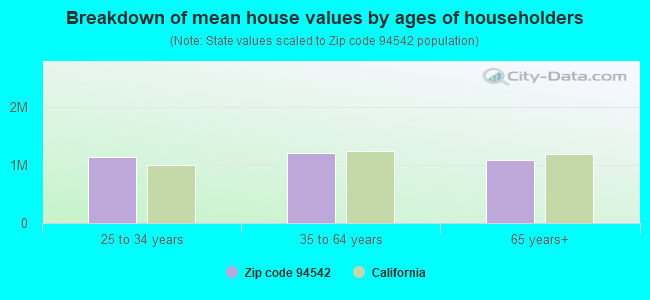
Estimated median house/condo value in 2022: $1,143,507
94542:
$1,143,507California:
$715,900
According to our research of California and other state lists, there were 16 registered sex offenders living in 94542 zip code as of May 28, 2024 . The ratio of all residents to sex offenders in zip code 94542 is 855 to 1.The ratio of registered sex offenders to all residents in this zip code is lower than the state average.
Median resident age: This zip code:
39.1 yearsCalifornia median age:
37.9 years
Average household size: This zip code:
2.9 peopleCalifornia:
2.8 people
Averages for the 2020 tax year for zip code 94542, filed in 2021:
Average Adjusted Gross Income (AGI) in 2020: $141,092 (Individual Income Tax Returns) Here:
$141,092State:
$95,910
Salary/wage: $117,705 (reported on 82.2% of returns )Here:
$117,705State:
$77,331
(% of AGI for various income ranges: 1291.1% for AGIs below $25k , 3924.8% for AGIs $25k-50k , 7200.5% for AGIs $50k-75k , 11382.5% for AGIs $75k-100k , 20998.6% for AGIs $100k-200k , 119153.3% for AGIs over 200k ) Taxable interest for individuals: $1,794 (reported on 45.9% of returns )This zip code:
$1,794California:
$2,294
(% of AGI for various income ranges: 26.6% for AGIs below $25k , 33.4% for AGIs $25k-50k , 59.5% for AGIs $50k-75k , 102.2% for AGIs $75k-100k , 225.8% for AGIs $100k-200k , 859.7% for AGIs over 200k ) Ordinary dividends: $7,251 (reported on 30.3% of returns )(% of AGI for various income ranges: 39.6% for AGIs below $25k , 57.3% for AGIs $25k-50k , 81.4% for AGIs $50k-75k , 150.0% for AGIs $75k-100k , 408.8% for AGIs $100k-200k , 3183.9% for AGIs over 200k ) Net capital gain/loss in AGI: +$33,118 (reported on 30.8% of returns )Here:
+$33,118State:
+$49,306
(% of AGI for various income ranges: 22.0% for AGIs below $25k , 50.0% for AGIs $25k-50k , 81.1% for AGIs $50k-75k , 275.0% for AGIs $75k-100k , 957.4% for AGIs $100k-200k , 18985.2% for AGIs over 200k ) Profit/loss from business: +$17,803 (reported on 18.0% of returns )Here:
+$17,803State:
+$15,671
(% of AGI for various income ranges: 118.1% for AGIs below $25k , 209.2% for AGIs $25k-50k , 223.4% for AGIs $50k-75k , 425.0% for AGIs $75k-100k , 893.3% for AGIs $100k-200k , 3082.4% for AGIs over 200k ) Taxable individual retirement arrangement distribution: $27,719 (reported on 8.1% of returns )94542:
$27,719California:
$23,505
(% of AGI for various income ranges: 54.7% for AGIs below $25k , 110.9% for AGIs $25k-50k , 155.9% for AGIs $50k-75k , 209.8% for AGIs $75k-100k , 884.7% for AGIs $100k-200k , 1849.7% for AGIs over 200k ) Self-employed (Keogh) retirement plans: $29,829 (reported on 1.0% of returns )94542:
$29,829California:
$30,163
(% of AGI for various income ranges: 83.7% for AGIs $100k-200k , 447.6% for AGIs over 200k ) Total itemized deductions: $36,223 (reported on 26.0% of returns )Here:
$36,223State:
$39,517
(% of AGI for various income ranges: 157.9% for AGIs below $25k , 295.2% for AGIs $25k-50k , 619.8% for AGIs $50k-75k , 1156.2% for AGIs $75k-100k , 2822.6% for AGIs $100k-200k , 10073.9% for AGIs over 200k ) Charity contributions: $6,543 (reported on 21.0% of returns )(% of AGI for various income ranges: 6.9% for AGIs below $25k , 24.7% for AGIs $25k-50k , 57.5% for AGIs $50k-75k , 92.0% for AGIs $75k-100k , 361.8% for AGIs $100k-200k , 1831.8% for AGIs over 200k ) Taxes paid: $9,675 (reported on 26.0% of returns )(% of AGI for various income ranges: 37.0% for AGIs below $25k , 72.8% for AGIs $25k-50k , 169.2% for AGIs $50k-75k , 363.0% for AGIs $75k-100k , 839.5% for AGIs $100k-200k , 2458.2% for AGIs over 200k ) Earned income credit: $1,749 (reported on 7.0% of returns )(% of AGI for various income ranges: 57.0% for AGIs below $25k , 39.2% for AGIs $25k-50k ) Percentage of individuals using paid preparers for their 2020 taxes: 91.9%(% for various income ranges: 90.0% for AGIs below $25k , 93.1% for AGIs $25k-50k , 91.4% for AGIs $50k-75k , 92.8% for AGIs $75k-100k , 90.6% for AGIs $100k-200k , 94.5% for AGIs over 200k )
Averages for the 2012 tax year for zip code 94542, filed in 2013:
Average Adjusted Gross Income (AGI) in 2012: $90,020 (Individual Income Tax Returns) Here:
$90,020State:
$72,726
Salary/wage: $79,105 (reported on 83.4% of returns )Here:
$79,105State:
$59,079
(% of AGI for various income ranges: 76.3% for AGIs below $25k , 79.0% for AGIs $25k-50k , 77.0% for AGIs $50k-75k , 75.7% for AGIs $75k-100k , 75.5% for AGIs $100k-200k , 68.5% for AGIs over 200k ) Taxable interest for individuals: $1,371 (reported on 45.9% of returns )This zip code:
$1,371California:
$2,146
(% of AGI for various income ranges: 1.4% for AGIs below $25k , 0.8% for AGIs $25k-50k , 0.9% for AGIs $50k-75k , 0.8% for AGIs $75k-100k , 0.6% for AGIs $100k-200k , 0.6% for AGIs over 200k ) Ordinary dividends: $4,703 (reported on 25.7% of returns )(% of AGI for various income ranges: 2.1% for AGIs below $25k , 0.9% for AGIs $25k-50k , 1.0% for AGIs $50k-75k , 1.1% for AGIs $75k-100k , 1.2% for AGIs $100k-200k , 1.7% for AGIs over 200k ) Net capital gain/loss in AGI: +$10,696 (reported on 23.1% of returns )Here:
+$10,696State:
+$30,460
(% of AGI for various income ranges: 0.3% for AGIs $50k-75k , 0.6% for AGIs $75k-100k , 0.6% for AGIs $100k-200k , 6.4% for AGIs over 200k ) Profit/loss from business: +$20,703 (reported on 17.5% of returns )Here:
+$20,703State:
+$17,064
(% of AGI for various income ranges: 11.4% for AGIs below $25k , 6.2% for AGIs $25k-50k , 4.0% for AGIs $50k-75k , 4.2% for AGIs $75k-100k , 3.4% for AGIs $100k-200k , 3.4% for AGIs over 200k ) Taxable individual retirement arrangement distribution: $20,459 (reported on 9.5% of returns )94542:
$20,459California:
$19,557
(% of AGI for various income ranges: 2.0% for AGIs below $25k , 2.0% for AGIs $25k-50k , 2.3% for AGIs $50k-75k , 2.9% for AGIs $75k-100k , 3.0% for AGIs $100k-200k , 1.3% for AGIs over 200k ) Self-employment retirement plans: $19,311 (reported on 1.6% of returns )94542:
$19,311California:
$24,530
(% of AGI for various income ranges: 0.6% for AGIs $25k-50k , 0.3% for AGIs $100k-200k , 0.5% for AGIs over 200k ) Total itemized deductions: $34,025 (23% of AGI, reported on 49.6% of returns )Here:
$34,025State:
$34,004
Here:
23.3% of AGIState:
22.7% of AGI
(% of AGI for various income ranges: 16.5% for AGIs below $25k , 14.3% for AGIs $25k-50k , 17.7% for AGIs $50k-75k , 20.8% for AGIs $75k-100k , 20.7% for AGIs $100k-200k , 18.1% for AGIs over 200k ) Charity contributions: $3,547 (reported on 41.0% of returns )(% of AGI for various income ranges: 0.6% for AGIs below $25k , 0.9% for AGIs $25k-50k , 1.4% for AGIs $50k-75k , 1.9% for AGIs $75k-100k , 2.1% for AGIs $100k-200k , 1.5% for AGIs over 200k ) Taxes paid: $14,456 (reported on 49.4% of returns )94542:
$14,456State:
$14,448
(% of AGI for various income ranges: 4.5% for AGIs below $25k , 3.5% for AGIs $25k-50k , 5.1% for AGIs $50k-75k , 7.4% for AGIs $75k-100k , 8.4% for AGIs $100k-200k , 9.6% for AGIs over 200k ) Earned income credit: $1,764 (reported on 8.8% of returns )(% of AGI for various income ranges: 3.7% for AGIs below $25k , 0.5% for AGIs $25k-50k ) Percentage of individuals using paid preparers for their 2012 taxes: 57.8%(% for various income ranges: 51.9% for AGIs below $25k , 56.6% for AGIs $25k-50k , 60.3% for AGIs $50k-75k , 57.6% for AGIs $75k-100k , 61.8% for AGIs $100k-200k , 65.5% for AGIs over 200k )
Averages for the 2004 tax year for zip code 94542, filed in 2005:
Average Adjusted Gross Income (AGI) in 2004: $69,827 (Individual Income Tax Returns) Here:
$69,827State:
$58,600
Salary/wage: $63,696 (reported on 84.2% of returns )Here:
$63,696State:
$49,455
(% of AGI for various income ranges: 73.6% for AGIs $10k-25k , 81.4% for AGIs $25k-50k , 79.8% for AGIs $50k-75k , 79.3% for AGIs $75k-100k , 72.2% for AGIs over 100k ) Taxable interest for individuals: $1,619 (reported on 54.9% of returns )This zip code:
$1,619California:
$2,365
(% of AGI for various income ranges: 1.8% for AGIs $10k-25k , 1.4% for AGIs $25k-50k , 1.0% for AGIs $50k-75k , 1.6% for AGIs $75k-100k , 1.0% for AGIs over 100k ) Taxable dividends: $2,696 (reported on 30.8% of returns )(% of AGI for various income ranges: 1.4% for AGIs $10k-25k , 0.9% for AGIs $25k-50k , 1.1% for AGIs $50k-75k , 1.1% for AGIs $75k-100k , 1.2% for AGIs over 100k ) Net capital gain/loss: +$11,364 (reported on 27.2% of returns )Here:
+$11,364State:
+$23,418
(% of AGI for various income ranges: 0.8% for AGIs $10k-25k , 0.6% for AGIs $25k-50k , 0.6% for AGIs $50k-75k , 0.7% for AGIs $75k-100k , 7.2% for AGIs over 100k ) Profit/loss from business: +$20,065 (reported on 17.9% of returns )Here:
+$20,065State:
+$16,826
(% of AGI for various income ranges: 8.3% for AGIs $10k-25k , 5.6% for AGIs $25k-50k , 4.2% for AGIs $50k-75k , 4.9% for AGIs $75k-100k , 5.3% for AGIs over 100k ) IRA payment deduction: $3,387 (reported on 3.2% of returns )94542:
$3,387California:
$3,192
(% of AGI for various income ranges: 0.2% for AGIs $25k-50k , 0.3% for AGIs $50k-75k , 0.2% for AGIs $75k-100k , 0.1% for AGIs over 100k ) Self-employed pension: $14,063 (reported on 2.2% of returns )Here:
$14,063California:
$17,688
(% of AGI for various income ranges: 0.2% for AGIs $25k-50k , 0.2% for AGIs $50k-75k , 0.5% for AGIs $75k-100k , 0.5% for AGIs over 100k ) Total itemized deductions: $29,299 (26% of AGI, reported on 51.2% of returns )Here:
$29,299State:
$28,113
Here:
26.2% of AGIState:
25.3% of AGI
(% of AGI for various income ranges: 17.5% for AGIs $10k-25k , 17.9% for AGIs $25k-50k , 23.4% for AGIs $50k-75k , 25.0% for AGIs $75k-100k , 20.6% for AGIs over 100k ) Charity contributions deductions: $3,196 (3% of AGI, reported on 45.2% of returns )Here:
2.7% of AGIState:
3.3% of AGI
(% of AGI for various income ranges: 0.9% for AGIs $10k-25k , 1.4% for AGIs $25k-50k , 2.1% for AGIs $50k-75k , 2.3% for AGIs $75k-100k , 2.2% for AGIs over 100k ) Total tax: $11,670 (reported on 83.3% of returns )94542:
$11,670State:
$10,761
(% of AGI for various income ranges: 5.1% for AGIs $10k-25k , 8.0% for AGIs $25k-50k , 9.6% for AGIs $50k-75k , 10.8% for AGIs $75k-100k , 17.2% for AGIs over 100k ) Earned income credit: $1,344 (reported on 7.6% of returns )Percentage of individuals using paid preparers for their 2004 taxes: 60.2%(% for various income ranges: 48.4% for AGIs below $10k , 58.9% for AGIs $10k-25k , 60.2% for AGIs $25k-50k , 64.9% for AGIs $50k-75k , 61.9% for AGIs $75k-100k , 65.1% for AGIs over 100k )
Estimated median household income in 2022: This zip code:
$132,236California:
$91,551
Nearest zip codes: 94544 ,
94541 ,
94587 ,
94552 ,
94546 ,
94580 .
Hayward Zip Code Map
Percentage of family households: This zip code:
47.1%California:
46.8%
Percentage of households with unmarried partners: This zip code:
7.1%California:
48.1%
Likely homosexual households (counted as self-reported same-sex unmarried-partner households)
Lesbian couples: 1.4% of all households Gay men: 0.8% of all households
Household received Food Stamps/SNAP in the past 12 months: 157Household did not receive Food Stamps/SNAP in the past 12 months: 4,839
Women who had a birth in the past 12 months: 92 (77 now married , 15 unmarried) Women who did not have a birth in the past 12 months: 3,689 (1,339 now married , 2,355 unmarried)
Housing units in zip code 94542 with a mortgage: 2,719 (381
second mortgage , 292
both second mortgage and home equity loan )
Houses without a mortgage: 35
Median monthly owner costs for units with a mortgage: $3,615
Median monthly owner costs for units without a mortgage: $1,092
Residents with income below the poverty level in 2022:
This zip code:
7.6%Whole state:
12.2%
Residents with income below 50% of the poverty level in 2022:
This zip code:
3.3%Whole state:
6.2%
Median number of rooms in houses and condos: Median number of rooms in apartments:
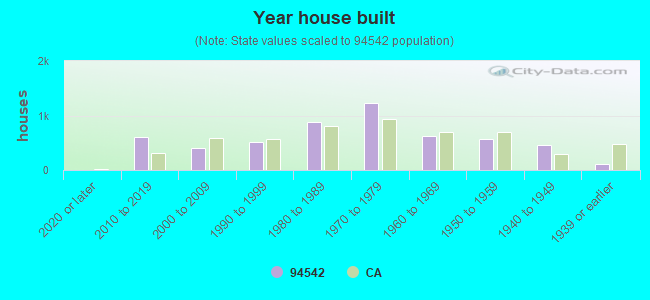
Year house built (houses)
0 2020 or later601 2010 to 2019401 2000 to 2009518 1990 to 1999872 1980 to 19891,228 1970 to 1979629 1960 to 1969564 1950 to 1959459 1940 to 1949116 1939 or earlier
Zip code 94542 household income distribution in 2022 176 Less than $10,00033 $10,000 to $14,99918 $20,000 to $24,99946 $25,000 to $29,99984 $30,000 to $34,999170 $35,000 to $39,99918 $40,000 to $44,99958 $45,000 to $49,999290 $50,000 to $59,999350 $60,000 to $74,999428 $75,000 to $99,999759 $100,000 to $124,999455 $125,000 to $149,999520 $150,000 to $199,9991,693 $200,000 or moreEstimate of home value of owner-occupied houses/condos in 2022 in zip code 94542 13 Less than $10,00022 $50,000 to $59,9999 $100,000 to $124,9994 $200,000 to $249,9996 $300,000 to $399,999172 $400,000 to $499,999433 $500,000 to $749,999999 $750,000 to $999,9991,518 $1,000,000 to $1,499,999476 $1,500,000 to $1,999,999263 $2,000,000 or moreRent paid by renters in 2022 in zip code 94542 14 $700 to $74911 $800 to $8998 $900 to $99934 $1,000 to $1,24930 $1,250 to $1,499366 $1,500 to $1,999490 $2,000 to $2,499360 $2,500 to $2,99921 $3,000 to $3,499131 $3,500 or more42 No cash rent
Median gross rent in 2022: $2,442.
Median price asked for vacant for-sale houses and condos in 2022: $1,597,639.
Estimated median house (or condo) value in 2022 for: White Non-Hispanic householders: $1,150,079Black or African American householders: $1,392,546Asian householders: $1,221,332Some other race householders: $1,131,401Two or more races householders: $1,291,547Hispanic or Latino householders: $1,061,877Estimated median house or condo value in 2022: $1,143,507
94542:
$1,143,507California:
$715,900
Lower value quartile - upper value quartile: $897,180 - $1,425,854
Mean price in 2022: Detached houses: $943,651Here:
$943,651State:
$988,808
Townhouses or other attached units: $840,709Here:
$840,709State:
$838,546
In 3-to-4-unit structures: $604,907Here:
$604,907State:
$824,253
In 5-or-more-unit structures: $495,180Here:
$495,180State:
$730,996
Mobile homes: $186,464Here:
$186,464State:
$184,506
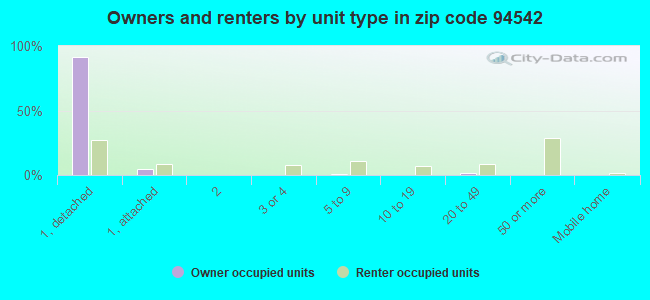
Housing units in structures:
One, detached: 3,884One, attached: 3483 or 4: 1625 to 9: 17810 to 19: 11220 to 49: 22150 or more: 506Mobile homes: 17Unemployment : 6.4%
Means of transportation to work in zip code 94542 59.8% 4,863 Drove a car alone14.9% 1,209 Carpooled0.3% 27 Bus or trolley bus2.7% 217 Streetcar or trolley car0.4% 35 Subway or elevated0.2% 20 Railroad0.1% 5 Taxi0.1% 11 Motorcycle0.1% 5 Bicycle2.3% 185 Walked0.5% 41 Other means17.8% 1,448 Worked at homeTravel time to work (commute) in zip code 94542 77 Less than 5 minutes161 5 to 9 minutes567 10 to 14 minutes697 15 to 19 minutes613 20 to 24 minutes419 25 to 29 minutes1,013 30 to 34 minutes165 35 to 39 minutes554 40 to 44 minutes821 45 to 59 minutes1,306 60 to 89 minutes298 90 or more minutes
Neighborhoods in zip code 94542: Percentage of zip code residents living and working in this county: 72.7%
Household type by relationship:
Households: 16,053
Male householders: 2,794 (532 living alone ), Female householders: 2,304 (419 living alone )2,998 spouses (2,919 opposite-sex spouses ), 474 unmarried partners , (463 opposite-sex unmarried partners ), 4,005 children (3,779 natural , 0 adopted , 223 stepchildren ), 272 grandchildren , 167 brothers or sisters , 373 parents , 0 foster children , 370 other relatives , 831 non-relatives In group quarters: 1,488 (-1 institutionalized population )
Size of family households: 1,323 2-persons , 869 3-persons , 828 4-persons , 455 5-persons , 136 6-persons , 23 7-or-more-persons
Size of nonfamily households: 948 1-person , 324 2-persons , 84 3-persons , 48 4-persons , 17 5-persons , 1 6-persons , 32 7-or-more-persons
1,585 married couples with children. single-parent households (159 men , 342 women ).
51.5% of residents of 94542 zip code speak English at home. of residents speak Spanish at home (63% very well, 22% well, 10% not well, 5% not at all ).of residents speak other Indo-European language at home (72% very well, 18% well, 6% not well, 4% not at all ).of residents speak Asian or Pacific Island language at home (60% very well, 30% well, 10% not well ).of residents speak other language at home (79% very well, 11% well, 10% not well ).
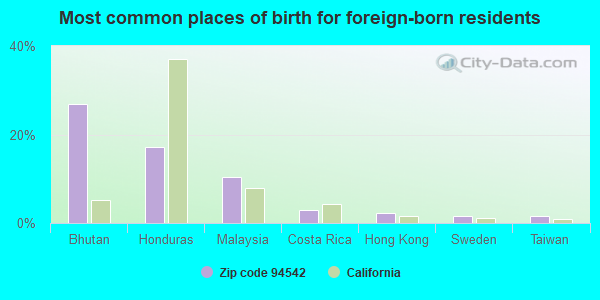
Foreign born population: 5,063 (31.5%)
(59.1%
of them are naturalized citizens )
This zip code:
31.5%Whole state:
26.7%
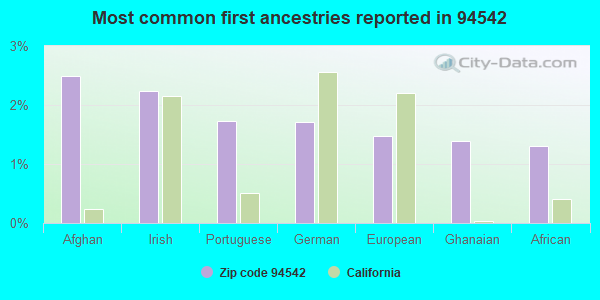
27% Bhutan 17% Honduras 10% Malaysia 3% Costa Rica 2% Hong Kong 2% Sweden 2% Taiwan 2% Afghan 2% Irish 2% Portuguese 2% German 1% European 1% Ghanaian 1% African
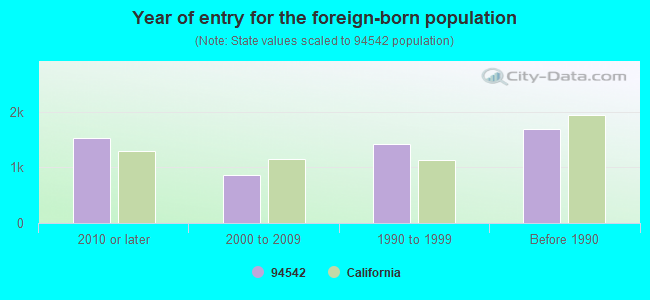
Year of entry for the foreign-born population
1,533 2010 or later 871 2000 to 2009 1,425 1990 to 1999 1,684 Before 1990
There are
29 Medical Specialists in Zip Code 94542 .
Facilities with environmental interests located in this zip code:
HIGHLAND CLEANERS (26775 HAYWARD BLVD in HAYWARD, CA)
STATE MASTER (California - Hazardous Waste Tracking) - HAZARDOU WASTE PROGRAM CRITERIA AND HAZARDOUS AIR POLLUTANT INVENTORY (Inventory of air pollution sources) Small Quantity Generators, between 100 kg and 1000 kg of hazardous waste/month (Resource Conservation and Recovery Act (tracking hazardous waste)) - notification Business SIC classification: DRYCLEANING PLANTS, EXCEPT RUG CLEANINGOrganizations: ESY TINATI (CONTACT/OWNER)
CALIF STATE UNIVERSITY HAYWARD (25800 CARLOS BEE BOULEVARD in HAYWARD, CA)
CRITERIA AND HAZARDOUS AIR POLLUTANT INVENTORY (Inventory of air pollution sources) HAZARDOUS WASTE BIENNIAL REPORTER (Resource Conservation and Recovery Act (tracking hazardous waste)) Large Quantity Generators, more that 1000 kg of hazardous waste/month (Resource Conservation and Recovery Act (tracking hazardous waste)) Business SIC classification: COLLEGES, UNIVERSITIES, AND PROFESSIONAL SCHOOLSOrganizations: CALIFORNIA STATE UNIVERSITY (CONTACT/OPERATOR)
Alternative names: CALIFORNIA STATE UNIVERSITY - HAYWARD
FLEET SERVICE DEPT ALAMEDA NEWSPAPER (25751 DOLLAR ST in HAYWARD, CA)
(Resource Conservation and Recovery Act (tracking hazardous waste)) Organizations: ALAMEDA NEWSPAPERS INC (CONTACT/OWNER)
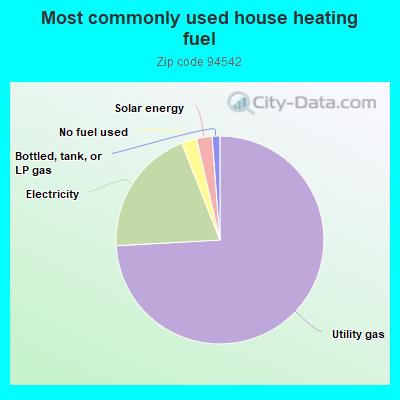
74.2% Utility gas 19.9% Electricity 2.4% No fuel used 2.4% Solar energy 1.2% Bottled, tank, or LP gas
Population in 1990: 11,165.
Place of birth for U.S.-born residents:
This state: 8,320Northeast: 549Midwest: 795South: 574West: 346
50% of the 94542 zip code residents lived in the same house 5 years ago.
Out of people who lived in different houses, 45% lived in this county.
Out of people who lived in different counties, 50% lived in California.
90% of the 94542 zip code residents lived in the same house 1 year ago.
Out of people who lived in different houses, 31% moved from this county.
Out of people who lived in different houses, 64% moved from different county within same state.
Out of people who lived in different houses, 3% moved from different state.
Out of people who lived in different houses, 5% moved from abroad.
Private vs. public school enrollment:
Students in private schools in grades 1 to 8 (elementary and middle school): 346
Here:
30.9%California:
10.5%
Students in private schools in grades 9 to 12 (high school): 132
Here:
25.5%California:
8.5%
Students in private undergraduate colleges: 142
Here:
6.3%California:
15.9%
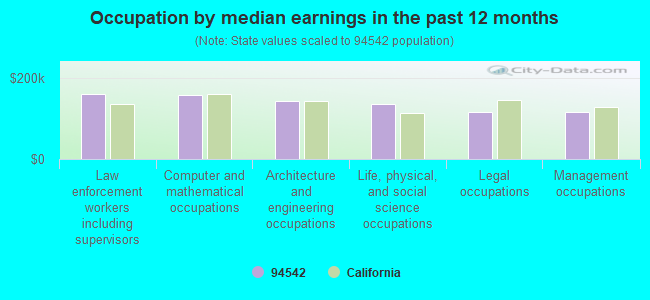
Occupation by median earnings in the past 12 months ($)
160,402 Law enforcement workers including supervisors 157,583 Computer and mathematical occupations 141,855 Architecture and engineering occupations 134,153 Life, physical, and social science occupations 115,936 Legal occupations 114,724 Management occupations
Companies with federal contracts located in this zip code:
CALIFORNIA STATE UNIVERSITY HA (25800 CARLOS BEE BOULEVARD in HAYWARD, CA)
$2,856 with Army for Educational Services. Signed on 2003-06-05. Completion date: 2003-07-03.
Top industries in this zip code by the number of employees in 2005:
Accommodation and Food Services: Food Service Contractors (50-99 employees: 1 establishment, 10-19 employees: 1 establishment)Accommodation and Food Services: Limited-Service Restaurants (20-49: 1, 10-19: 2, 5-9: 1, 1-4: 1)Real Estate and Rental and Leasing: Lessors of Residential Buildings and Dwellings (10-19: 1, 5-9: 3, 1-4: 4)Administrative and Support and Waste Management and Remediation Services: Security Guards and Patrol Services (20-49: 1, 1-4: 1)Other Services (except Public Administration): Civic and Social Organizations (20-49: 1)Health Care and Social Assistance: Offices of Physicians (except Mental Health Specialists) (20-49: 1)Health Care and Social Assistance: Other Residential Care Facilities (10-19: 2)Construction: Residential Remodelers (5-9: 3, 1-4: 3)Construction: Electrical Contractors (10-19: 1, 5-9: 1, 1-4: 1)
People in group quarters in 2010:
1,076 people in college/university student housing
28 people in group homes intended for adults
8 people in workers' group living quarters and job corps centers
4 people in other noninstitutional facilities
People in group quarters in 2000:
636 people in college dormitories (includes college quarters off campus)
Fatal accident statistics in 2014:
Fatal accident count: 1Vehicles involved in fatal accidents: 1Fatal accidents caused by drunken drivers: 0Fatalities: 1Persons involved in fatal accidents: 3Pedestrians involved in fatal accidents: 1
Fatal accident statistics in 2011:
Fatal accident count: 1Vehicles involved in fatal accidents: 1Fatal accidents caused by drunken drivers: 0Fatalities: 1Persons involved in fatal accidents: 3Pedestrians involved in fatal accidents: 0
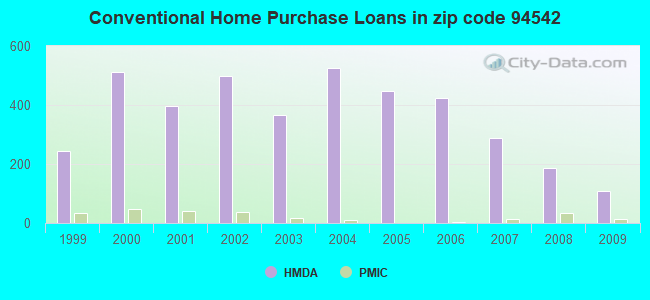
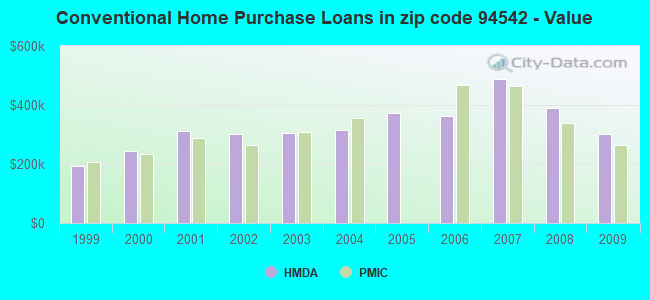
Home Mortgage Disclosure Act Aggregated Statistics For Year 2009(Based on 2 full and 6 partial tracts) A) FHA, FSA/RHS & VA B) Conventional C) Refinancings D) Home Improvement Loans E) Loans on Dwellings For 5+ Families F) Non-occupant Loans on Number Average Value Number Average Value Number Average Value Number Average Value Number Average Value Number Average Value
LOANS ORIGINATED 65 $335,599 110 $301,543 423 $304,308 10 $189,131 2 $1,116,495 38 $251,431 APPLICATIONS APPROVED, NOT ACCEPTED 6 $404,817 17 $397,547 45 $341,657 0 $0 0 $0 5 $317,238 APPLICATIONS DENIED 16 $286,809 39 $359,324 169 $347,901 5 $222,872 0 $0 18 $198,307 APPLICATIONS WITHDRAWN 13 $360,563 23 $348,381 72 $358,163 1 $143,800 0 $0 7 $306,886 FILES CLOSED FOR INCOMPLETENESS 4 $231,078 4 $410,535 21 $409,860 0 $0 0 $0 0 $0
Aggregated Statistics For Year 2008(Based on 2 full and 6 partial tracts) A) FHA, FSA/RHS & VA B) Conventional C) Refinancings D) Home Improvement Loans E) Loans on Dwellings For 5+ Families F) Non-occupant Loans on G) Loans On Manufactured Number Average Value Number Average Value Number Average Value Number Average Value Number Average Value Number Average Value Number Average Value
LOANS ORIGINATED 29 $392,556 188 $390,047 170 $342,330 23 $161,223 1 $3,563,630 36 $269,249 1 $20,290 APPLICATIONS APPROVED, NOT ACCEPTED 3 $310,390 49 $386,825 55 $373,139 5 $228,862 0 $0 9 $332,146 1 $21,940 APPLICATIONS DENIED 18 $331,550 65 $453,030 198 $448,027 41 $267,374 0 $0 30 $330,587 0 $0 APPLICATIONS WITHDRAWN 5 $378,548 34 $397,913 78 $382,152 7 $201,490 0 $0 7 $185,589 0 $0 FILES CLOSED FOR INCOMPLETENESS 2 $223,275 14 $354,820 17 $487,986 0 $0 0 $0 3 $251,210 0 $0
Aggregated Statistics For Year 2007(Based on 2 full and 6 partial tracts) A) FHA, FSA/RHS & VA B) Conventional C) Refinancings D) Home Improvement Loans E) Loans on Dwellings For 5+ Families F) Non-occupant Loans on G) Loans On Manufactured Number Average Value Number Average Value Number Average Value Number Average Value Number Average Value Number Average Value Number Average Value
LOANS ORIGINATED 2 $397,395 289 $488,067 460 $408,545 52 $276,740 3 $13,165,383 61 $393,953 0 $0 APPLICATIONS APPROVED, NOT ACCEPTED 0 $0 97 $480,064 110 $464,124 18 $381,742 0 $0 16 $489,705 0 $0 APPLICATIONS DENIED 0 $0 137 $442,648 324 $495,311 51 $258,652 0 $0 37 $484,078 3 $98,133 APPLICATIONS WITHDRAWN 0 $0 32 $438,672 134 $466,323 10 $159,043 1 $1,881,720 8 $541,199 0 $0 FILES CLOSED FOR INCOMPLETENESS 0 $0 7 $411,113 58 $490,648 1 $317,890 0 $0 2 $547,270 0 $0
Aggregated Statistics For Year 2006(Based on 2 full and 6 partial tracts) B) Conventional C) Refinancings D) Home Improvement Loans E) Loans on Dwellings For 5+ Families F) Non-occupant Loans on G) Loans On Manufactured Number Average Value Number Average Value Number Average Value Number Average Value Number Average Value Number Average Value
LOANS ORIGINATED 424 $362,905 602 $407,948 90 $355,663 4 $3,173,602 53 $416,705 0 $0 APPLICATIONS APPROVED, NOT ACCEPTED 106 $333,194 148 $444,332 16 $268,249 0 $0 19 $441,100 1 $66,910 APPLICATIONS DENIED 184 $429,317 302 $455,892 43 $287,587 1 $6,289,540 45 $517,708 0 $0 APPLICATIONS WITHDRAWN 72 $444,675 212 $444,050 16 $322,462 0 $0 11 $545,512 0 $0 FILES CLOSED FOR INCOMPLETENESS 19 $435,968 51 $415,897 8 $344,410 0 $0 3 $307,503 0 $0
Aggregated Statistics For Year 2005(Based on 2 full and 6 partial tracts) B) Conventional C) Refinancings D) Home Improvement Loans E) Loans on Dwellings For 5+ Families F) Non-occupant Loans on G) Loans On Manufactured Number Average Value Number Average Value Number Average Value Number Average Value Number Average Value Number Average Value
LOANS ORIGINATED 448 $372,603 674 $402,743 95 $303,116 1 $2,164,910 75 $335,813 1 $211,440 APPLICATIONS APPROVED, NOT ACCEPTED 104 $327,495 118 $388,236 7 $463,087 0 $0 14 $257,939 2 $67,845 APPLICATIONS DENIED 196 $375,048 287 $474,778 57 $250,297 0 $0 37 $384,337 1 $142,580 APPLICATIONS WITHDRAWN 67 $371,636 211 $386,900 47 $267,622 0 $0 13 $395,620 0 $0 FILES CLOSED FOR INCOMPLETENESS 22 $486,224 76 $466,969 11 $220,304 0 $0 4 $359,048 0 $0
Aggregated Statistics For Year 2004(Based on 2 full and 6 partial tracts) A) FHA, FSA/RHS & VA B) Conventional C) Refinancings D) Home Improvement Loans E) Loans on Dwellings For 5+ Families F) Non-occupant Loans on G) Loans On Manufactured Number Average Value Number Average Value Number Average Value Number Average Value Number Average Value Number Average Value Number Average Value
LOANS ORIGINATED 0 $0 526 $316,886 882 $319,821 52 $263,537 2 $937,725 68 $276,776 1 $217,000 APPLICATIONS APPROVED, NOT ACCEPTED 0 $0 83 $323,919 153 $306,374 11 $314,445 0 $0 11 $248,619 0 $0 APPLICATIONS DENIED 0 $0 141 $339,408 378 $347,242 44 $227,623 0 $0 36 $291,771 4 $175,305 APPLICATIONS WITHDRAWN 3 $289,210 93 $378,144 254 $323,559 19 $73,213 0 $0 19 $294,205 0 $0 FILES CLOSED FOR INCOMPLETENESS 0 $0 23 $333,372 67 $324,232 3 $148,713 0 $0 3 $307,087 0 $0
Aggregated Statistics For Year 2003(Based on 2 full and 6 partial tracts) B) Conventional C) Refinancings D) Home Improvement Loans E) Loans on Dwellings For 5+ Families F) Non-occupant Loans on Number Average Value Number Average Value Number Average Value Number Average Value Number Average Value
LOANS ORIGINATED 366 $304,383 1,737 $264,246 30 $150,227 4 $1,620,025 116 $237,759 APPLICATIONS APPROVED, NOT ACCEPTED 65 $311,311 256 $276,538 2 $66,245 0 $0 15 $289,853 APPLICATIONS DENIED 92 $317,053 396 $317,632 19 $48,585 0 $0 29 $281,734 APPLICATIONS WITHDRAWN 37 $285,149 339 $281,174 5 $50,704 0 $0 7 $316,266 FILES CLOSED FOR INCOMPLETENESS 18 $335,021 79 $361,632 0 $0 0 $0 4 $448,795
Aggregated Statistics For Year 2002(Based on 2 full and 6 partial tracts) A) FHA, FSA/RHS & VA B) Conventional C) Refinancings D) Home Improvement Loans E) Loans on Dwellings For 5+ Families F) Non-occupant Loans on Number Average Value Number Average Value Number Average Value Number Average Value Number Average Value Number Average Value
LOANS ORIGINATED 7 $141,021 497 $300,467 1,544 $264,968 24 $58,740 8 $2,276,598 61 $242,788 APPLICATIONS APPROVED, NOT ACCEPTED 1 $30,160 88 $312,313 255 $267,980 6 $69,543 0 $0 11 $175,301 APPLICATIONS DENIED 1 $159,340 99 $295,566 264 $299,599 30 $36,634 0 $0 10 $267,310 APPLICATIONS WITHDRAWN 1 $289,050 58 $241,715 311 $283,135 5 $63,340 0 $0 12 $332,322 FILES CLOSED FOR INCOMPLETENESS 0 $0 35 $325,088 119 $297,325 0 $0 0 $0 10 $312,937
Aggregated Statistics For Year 2001(Based on 2 full and 6 partial tracts) A) FHA, FSA/RHS & VA B) Conventional C) Refinancings D) Home Improvement Loans E) Loans on Dwellings For 5+ Families F) Non-occupant Loans on Number Average Value Number Average Value Number Average Value Number Average Value Number Average Value Number Average Value
LOANS ORIGINATED 6 $236,973 397 $312,070 1,192 $255,365 60 $74,617 9 $12,053,642 56 $220,909 APPLICATIONS APPROVED, NOT ACCEPTED 0 $0 73 $276,982 235 $260,098 16 $40,951 0 $0 9 $164,580 APPLICATIONS DENIED 2 $259,195 84 $269,784 318 $234,829 40 $73,046 1 $441,610 19 $237,507 APPLICATIONS WITHDRAWN 0 $0 69 $293,123 312 $247,289 26 $62,785 0 $0 11 $340,808 FILES CLOSED FOR INCOMPLETENESS 0 $0 23 $429,485 91 $270,534 4 $43,000 2 $3,487,915 2 $210,780
Aggregated Statistics For Year 2000(Based on 2 full and 6 partial tracts) A) FHA, FSA/RHS & VA B) Conventional C) Refinancings D) Home Improvement Loans E) Loans on Dwellings For 5+ Families F) Non-occupant Loans on Number Average Value Number Average Value Number Average Value Number Average Value Number Average Value Number Average Value
LOANS ORIGINATED 17 $171,765 511 $242,749 382 $172,838 74 $44,458 2 $975,160 46 $181,399 APPLICATIONS APPROVED, NOT ACCEPTED 6 $186,217 74 $219,600 71 $214,394 23 $36,358 0 $0 13 $163,419 APPLICATIONS DENIED 3 $118,793 131 $208,763 211 $203,491 20 $38,785 3 $614,557 17 $211,656 APPLICATIONS WITHDRAWN 2 $180,240 31 $246,576 136 $209,059 19 $77,522 0 $0 4 $311,768 FILES CLOSED FOR INCOMPLETENESS 0 $0 49 $229,079 81 $241,175 3 $38,080 0 $0 1 $114,300
Aggregated Statistics For Year 1999(Based on 1 full and 4 partial tracts) A) FHA, FSA/RHS & VA B) Conventional C) Refinancings D) Home Improvement Loans E) Loans on Dwellings For 5+ Families F) Non-occupant Loans on Number Average Value Number Average Value Number Average Value Number Average Value Number Average Value Number Average Value
LOANS ORIGINATED 20 $167,935 244 $194,602 326 $189,592 32 $30,137 4 $961,718 27 $156,981 APPLICATIONS APPROVED, NOT ACCEPTED 1 $139,050 22 $208,902 57 $175,627 12 $21,584 0 $0 4 $94,850 APPLICATIONS DENIED 2 $123,470 37 $209,886 108 $186,659 18 $39,343 1 $362,880 2 $154,745 APPLICATIONS WITHDRAWN 2 $119,425 37 $185,833 100 $169,851 4 $36,602 0 $0 3 $183,290 FILES CLOSED FOR INCOMPLETENESS 0 $0 14 $163,284 49 $220,023 2 $28,480 1 $3,113,260 4 $133,695
Detailed HMDA statistics for the following Tracts:
4351.02
,
4364.01 ,
4364.02 ,
4365.00
Private Mortgage Insurance Companies Aggregated Statistics For Year 2009(Based on 2 full and 6 partial tracts) A) Conventional Number Average Value
LOANS ORIGINATED 15 $262,848 APPLICATIONS APPROVED, NOT ACCEPTED 4 $276,848 APPLICATIONS DENIED 4 $295,480 APPLICATIONS WITHDRAWN 0 $0 FILES CLOSED FOR INCOMPLETENESS 0 $0
Aggregated Statistics For Year 2008(Based on 2 full and 6 partial tracts) A) Conventional B) Refinancings Number Average Value Number Average Value
LOANS ORIGINATED 34 $338,398 6 $358,350 APPLICATIONS APPROVED, NOT ACCEPTED 7 $329,941 7 $464,980 APPLICATIONS DENIED 4 $406,530 0 $0 APPLICATIONS WITHDRAWN 2 $406,880 0 $0 FILES CLOSED FOR INCOMPLETENESS 0 $0 0 $0
Aggregated Statistics For Year 2007(Based on 2 full and 6 partial tracts) A) Conventional B) Refinancings C) Non-occupant Loans on Number Average Value Number Average Value Number Average Value
LOANS ORIGINATED 14 $462,728 9 $488,971 0 $0 APPLICATIONS APPROVED, NOT ACCEPTED 7 $375,724 5 $537,692 0 $0 APPLICATIONS DENIED 3 $560,143 0 $0 2 $509,680 APPLICATIONS WITHDRAWN 0 $0 2 $452,070 0 $0 FILES CLOSED FOR INCOMPLETENESS 0 $0 0 $0 0 $0
Aggregated Statistics For Year 2006(Based on 2 full and 6 partial tracts) A) Conventional B) Refinancings C) Non-occupant Loans on Number Average Value Number Average Value Number Average Value
LOANS ORIGINATED 4 $467,448 5 $649,272 0 $0 APPLICATIONS APPROVED, NOT ACCEPTED 0 $0 2 $429,335 0 $0 APPLICATIONS DENIED 6 $706,913 1 $905,960 2 $713,750 APPLICATIONS WITHDRAWN 0 $0 1 $662,410 0 $0 FILES CLOSED FOR INCOMPLETENESS 0 $0 0 $0 0 $0
Aggregated Statistics For Year 2005(Based on 2 full and 4 partial tracts) A) Conventional B) Refinancings Number Average Value Number Average Value
LOANS ORIGINATED 0 $0 5 $524,240 APPLICATIONS APPROVED, NOT ACCEPTED 0 $0 1 $306,400 APPLICATIONS DENIED 2 $769,405 0 $0 APPLICATIONS WITHDRAWN 0 $0 0 $0 FILES CLOSED FOR INCOMPLETENESS 0 $0 0 $0
Aggregated Statistics For Year 2004(Based on 2 full and 6 partial tracts) A) Conventional B) Refinancings C) Non-occupant Loans on Number Average Value Number Average Value Number Average Value
LOANS ORIGINATED 11 $354,777 12 $313,023 0 $0 APPLICATIONS APPROVED, NOT ACCEPTED 2 $281,205 3 $322,227 0 $0 APPLICATIONS DENIED 1 $775,440 0 $0 1 $387,720 APPLICATIONS WITHDRAWN 2 $493,660 0 $0 0 $0 FILES CLOSED FOR INCOMPLETENESS 0 $0 0 $0 0 $0
Aggregated Statistics For Year 2003(Based on 2 full and 6 partial tracts) A) Conventional B) Refinancings C) Non-occupant Loans on Number Average Value Number Average Value Number Average Value
LOANS ORIGINATED 17 $307,380 11 $294,551 2 $237,365 APPLICATIONS APPROVED, NOT ACCEPTED 6 $293,985 8 $350,506 0 $0 APPLICATIONS DENIED 0 $0 0 $0 0 $0 APPLICATIONS WITHDRAWN 2 $197,235 0 $0 0 $0 FILES CLOSED FOR INCOMPLETENESS 0 $0 0 $0 0 $0
Aggregated Statistics For Year 2002(Based on 2 full and 6 partial tracts) A) Conventional B) Refinancings C) Non-occupant Loans on Number Average Value Number Average Value Number Average Value
LOANS ORIGINATED 36 $263,697 15 $307,204 1 $227,040 APPLICATIONS APPROVED, NOT ACCEPTED 7 $254,121 13 $367,916 0 $0 APPLICATIONS DENIED 0 $0 0 $0 0 $0 APPLICATIONS WITHDRAWN 2 $219,690 6 $318,870 2 $355,090 FILES CLOSED FOR INCOMPLETENESS 0 $0 0 $0 0 $0
Aggregated Statistics For Year 2001(Based on 2 full and 6 partial tracts) A) Conventional B) Refinancings C) Non-occupant Loans on Number Average Value Number Average Value Number Average Value
LOANS ORIGINATED 41 $287,581 15 $254,323 0 $0 APPLICATIONS APPROVED, NOT ACCEPTED 11 $234,950 9 $248,687 1 $337,230 APPLICATIONS DENIED 3 $243,107 4 $241,868 3 $254,853 APPLICATIONS WITHDRAWN 2 $444,260 2 $242,145 0 $0 FILES CLOSED FOR INCOMPLETENESS 0 $0 1 $337,230 1 $337,230
Aggregated Statistics For Year 2000(Based on 2 full and 6 partial tracts) A) Conventional B) Refinancings C) Non-occupant Loans on Number Average Value Number Average Value Number Average Value
LOANS ORIGINATED 48 $234,928 16 $267,353 1 $258,270 APPLICATIONS APPROVED, NOT ACCEPTED 10 $260,720 2 $336,295 0 $0 APPLICATIONS DENIED 2 $246,710 4 $275,832 0 $0 APPLICATIONS WITHDRAWN 2 $241,115 4 $222,130 0 $0 FILES CLOSED FOR INCOMPLETENESS 0 $0 0 $0 0 $0
Aggregated Statistics For Year 1999(Based on 1 full and 4 partial tracts) A) Conventional B) Refinancings Number Average Value Number Average Value
LOANS ORIGINATED 35 $206,129 22 $202,620 APPLICATIONS APPROVED, NOT ACCEPTED 3 $212,607 3 $189,337 APPLICATIONS DENIED 2 $119,635 1 $229,340 APPLICATIONS WITHDRAWN 2 $187,320 2 $191,235 FILES CLOSED FOR INCOMPLETENESS 0 $0 0 $0
Detailed PMIC statistics for the following Tracts:
4351.02
,
4364.01 ,
4364.02 ,
4365.00
Most common first names in zip code 94542 among deceased individuals Name Count Lived (average)
John 30 72.5 years Mary 29 80.7 years Robert 29 71.7 years James 22 68.6 years William 22 76.7 years George 16 75.7 years David 15 72.5 years Joseph 15 74.2 years Richard 14 61.6 years Helen 14 79.8 years
Most common last names in zip code 94542 among deceased individuals Last name Count Lived (average)
Smith 10 72.4 years Jones 8 80.4 years Williams 8 69.1 years Davis 6 79.9 years Anderson 6 78.5 years Miller 5 79.6 years Nelson 5 64.0 years Johnson 4 68.3 years Brown 4 71.2 years Hartley 4 79.3 years
Businesses in zip code 94542
Panda Express: 1Subway: 1

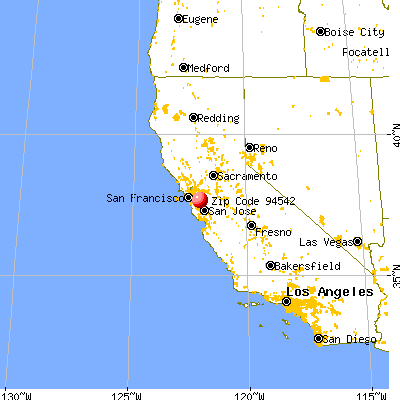

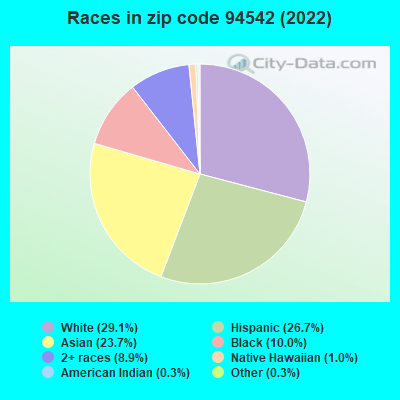


 Nearest zip codes: 94544, 94541, 94587, 94552, 94546, 94580.