Estimated median house/condo value in 2022: $1,386,412
94586:
$1,386,412
California:
$715,900
Median resident age:
This zip code:
44.7 years
California median age:
37.9 years
Average household size:
This zip code:
2.9 people
California:
2.8 people
Averages for the 2020 tax year for zip code 94586, filed in 2021:
Average Adjusted Gross Income (AGI) in 2020: $188,539 (Individual Income Tax Returns)
Here:
$188,539
State:
$95,910
Salary/wage: $158,419 (reported on 72.5% of returns)
Here:
$158,419
State:
$77,331
(% of AGI for various income ranges: 1180.0% for AGIs below $25k, 4498.0% for AGIs $25k-50k, 5202.0% for AGIs $50k-75k, 21746.0% for AGIs $100k-200k, 134216.7% for AGIs over 200k)
Taxable interest for individuals: $2,393 (reported on 52.9% of returns)
This zip code:
$2,393
California:
$2,294
(% of AGI for various income ranges: 17.5% for AGIs below $25k, 24.0% for AGIs $25k-50k, 30.0% for AGIs $50k-75k, 304.0% for AGIs $100k-200k, 1473.3% for AGIs over 200k)
Ordinary dividends: $20,238 (reported on 41.2% of returns)
Here:
$20,238
State:
$10,949
(% of AGI for various income ranges: 235.0% for AGIs below $25k, 106.0% for AGIs $50k-75k, 626.0% for AGIs $100k-200k, 12633.3% for AGIs over 200k)
Net capital gain/loss in AGI: +$34,770 (reported on 39.2% of returns)
Here:
+$34,770
State:
+$49,306
(% of AGI for various income ranges: 157.5% for AGIs below $25k, 222.0% for AGIs $50k-75k, 996.0% for AGIs $100k-200k, 20940.0% for AGIs over 200k)
Profit/loss from business: +$33,322 (reported on 17.6% of returns)
Here:
+$33,322
State:
+$15,671
(% of AGI for various income ranges: 742.5% for AGIs below $25k, 8353.3% for AGIs over 200k)
Taxable individual retirement arrangement distribution: $30,617 (reported on 11.8% of returns)
94586:
$30,617
California:
$23,505
(% of AGI for various income ranges: 3674.0% for AGIs $100k-200k)
Total itemized deductions: $48,307 (reported on 27.5% of returns)
Here:
$48,307
State:
$39,517
(% of AGI for various income ranges: 1706.0% for AGIs $25k-50k, 2748.0% for AGIs $100k-200k, 15120.0% for AGIs over 200k)
Charity contributions: $8,082 (reported on 21.6% of returns)
Here:
$8,082
State:
$12,598
(% of AGI for various income ranges: 402.0% for AGIs $100k-200k, 2293.3% for AGIs over 200k)
Taxes paid: $9,086 (reported on 27.5% of returns)
94586:
$9,086
State:
$8,807
(% of AGI for various income ranges: 318.0% for AGIs $25k-50k, 822.0% for AGIs $100k-200k, 2340.0% for AGIs over 200k)
Earned income credit: $1,300 (reported on 3.9% of returns)
Here:
$1,300
State:
$2,074
(% of AGI for various income ranges: 65.0% for AGIs below $25k)
Percentage of individuals using paid preparers for their 2020 taxes: 94.1%
Here:
94%
State:
92%
(% for various income ranges: 88.9% for AGIs below $25k, 100.0% for AGIs $25k-50k, 85.7% for AGIs $50k-75k, 100.0% for AGIs $75k-100k, 91.7% for AGIs $100k-200k, 100.0% for AGIs over 200k)
Averages for the 2012 tax year for zip code 94586, filed in 2013:
Average Adjusted Gross Income (AGI) in 2012: $140,946 (Individual Income Tax Returns)
Here:
$140,946
State:
$72,726
Salary/wage: $99,246 (reported on 75.0% of returns)
Here:
$99,246
State:
$59,079
(% of AGI for various income ranges: 71.3% for AGIs below $25k, 74.9% for AGIs $25k-50k, 66.8% for AGIs $50k-75k, 56.4% for AGIs $75k-100k, 68.8% for AGIs $100k-200k, 43.5% for AGIs over 200k)
Taxable interest for individuals: $2,019 (reported on 50.0% of returns)
This zip code:
$2,019
California:
$2,146
(% of AGI for various income ranges: 0.4% for AGIs below $25k, 0.3% for AGIs $25k-50k, 1.1% for AGIs $50k-75k, 0.5% for AGIs $75k-100k, 0.5% for AGIs $100k-200k, 0.8% for AGIs over 200k)
Ordinary dividends: $6,772 (reported on 34.6% of returns)
Here:
$6,772
State:
$9,308
(% of AGI for various income ranges: 5.1% for AGIs below $25k, 1.2% for AGIs $50k-75k, 2.6% for AGIs $75k-100k, 0.9% for AGIs $100k-200k, 1.8% for AGIs over 200k)
Net capital gain/loss in AGI: +$27,350 (reported on 30.8% of returns)
Here:
+$27,350
State:
+$30,460
(% of AGI for various income ranges: 2.9% for AGIs $100k-200k, 9.0% for AGIs over 200k)
Profit/loss from business: +$35,110 (reported on 19.2% of returns)
Here:
+$35,110
State:
+$17,064
(% of AGI for various income ranges: 22.1% for AGIs below $25k, 8.3% for AGIs $50k-75k, 6.2% for AGIs $100k-200k, 4.2% for AGIs over 200k)
Taxable individual retirement arrangement distribution: $15,975 (reported on 15.4% of returns)
94586:
$15,975
California:
$19,557
Total itemized deductions: $51,473 (21% of AGI, reported on 50.0% of returns)
Here:
$51,473
State:
$34,004
Here:
21.1% of AGI
State:
22.7% of AGI
(% of AGI for various income ranges: 20.5% for AGIs $25k-50k, 15.7% for AGIs $50k-75k, 19.6% for AGIs $75k-100k, 22.2% for AGIs $100k-200k, 17.6% for AGIs over 200k)
Charity contributions: $4,023 (reported on 42.3% of returns)
Here:
$4,023
State:
$4,659
(% of AGI for various income ranges: 1.4% for AGIs below $25k, 1.1% for AGIs $50k-75k, 1.4% for AGIs $75k-100k, 1.5% for AGIs $100k-200k, 1.2% for AGIs over 200k)
Taxes paid: $24,681 (reported on 50.0% of returns)
94586:
$24,681
State:
$14,448
(% of AGI for various income ranges: 4.9% for AGIs $25k-50k, 3.3% for AGIs $50k-75k, 6.4% for AGIs $75k-100k, 8.8% for AGIs $100k-200k, 10.2% for AGIs over 200k)
Earned income credit: $1,450 (reported on 7.7% of returns)
Here:
$1,450
State:
$2,286
(% of AGI for various income ranges: 3.5% for AGIs below $25k)
Percentage of individuals using paid preparers for their 2012 taxes: 57.7%
Here:
58%
State:
64%
(% for various income ranges: 46.2% for AGIs below $25k, 50.0% for AGIs $25k-50k, 57.1% for AGIs $50k-75k, 66.7% for AGIs $75k-100k, 63.6% for AGIs $100k-200k, 71.4% for AGIs over 200k)
Averages for the 2004 tax year for zip code 94586, filed in 2005:
Average Adjusted Gross Income (AGI) in 2004: $97,665 (Individual Income Tax Returns)
Here:
$97,665
State:
$58,600
Salary/wage: $81,418 (reported on 81.7% of returns)
Here:
$81,418
State:
$49,455
(% of AGI for various income ranges: 113.1% for AGIs below $10k, 70.6% for AGIs $10k-25k, 76.1% for AGIs $25k-50k, 74.1% for AGIs $50k-75k, 84.2% for AGIs $75k-100k, 63.3% for AGIs over 100k)
Taxable interest for individuals: $1,443 (reported on 56.7% of returns)
This zip code:
$1,443
California:
$2,365
(% of AGI for various income ranges: 2.7% for AGIs below $10k, 1.4% for AGIs $10k-25k, 0.6% for AGIs $25k-50k, 1.1% for AGIs $50k-75k, 0.4% for AGIs $75k-100k, 0.9% for AGIs over 100k)
Taxable dividends: $2,294 (reported on 34.5% of returns)
Here:
$2,294
State:
$4,746
(% of AGI for various income ranges: 2.3% for AGIs below $10k, 2.0% for AGIs $10k-25k, 0.8% for AGIs $25k-50k, 0.8% for AGIs $50k-75k, 0.6% for AGIs $75k-100k, 0.8% for AGIs over 100k)
Net capital gain/loss: +$15,308 (reported on 28.5% of returns)
Here:
+$15,308
State:
+$23,418
(% of AGI for various income ranges: -4.2% for AGIs below $10k, -1.0% for AGIs $10k-25k, 0.6% for AGIs $25k-50k, 3.6% for AGIs $50k-75k, -0.2% for AGIs $75k-100k, 6.0% for AGIs over 100k)
Profit/loss from business: +$36,562 (reported on 20.5% of returns)
Here:
+$36,562
State:
+$16,826
(% of AGI for various income ranges: -6.2% for AGIs below $10k, 8.4% for AGIs $10k-25k, 0.9% for AGIs $25k-50k, 0.8% for AGIs $50k-75k, 4.0% for AGIs $75k-100k, 10.1% for AGIs over 100k)
Self-employed pension: $25,714 (reported on 2.7% of returns)
Here:
$25,714
California:
$17,688
Total itemized deductions: $46,789 (27% of AGI, reported on 48.1% of returns)
Here:
$46,789
State:
$28,113
Here:
27.4% of AGI
State:
25.3% of AGI
(% of AGI for various income ranges: 26.8% for AGIs $10k-25k, 9.5% for AGIs $25k-50k, 22.5% for AGIs $50k-75k, 24.1% for AGIs $75k-100k, 24.5% for AGIs over 100k)
Charity contributions deductions: $3,282 (2% of AGI, reported on 42.9% of returns)
Here:
$3,282
State:
$3,923
Here:
2.1% of AGI
State:
3.3% of AGI
(% of AGI for various income ranges: 1.0% for AGIs $25k-50k, 1.4% for AGIs $50k-75k, 1.2% for AGIs $75k-100k, 1.6% for AGIs over 100k)
Total tax: $18,694 (reported on 84.6% of returns)
94586:
$18,694
State:
$10,761
(% of AGI for various income ranges: 5.0% for AGIs below $10k, 5.5% for AGIs $10k-25k, 8.9% for AGIs $25k-50k, 9.9% for AGIs $50k-75k, 10.8% for AGIs $75k-100k, 19.2% for AGIs over 100k)
Earned income credit: $1,048 (reported on 4.1% of returns)
Here:
$1,048
State:
$1,763
Percentage of individuals using paid preparers for their 2004 taxes: 60.2%
Here:
60%
State:
66%
(% for various income ranges: 47.6% for AGIs below $10k, 52.4% for AGIs $10k-25k, 52.5% for AGIs $25k-50k, 65.9% for AGIs $50k-75k, 62.9% for AGIs $75k-100k, 74.2% for AGIs over 100k)
Likely homosexual households (counted as self-reported same-sex unmarried-partner households)
Lesbian couples: 0.3% of all households
Gay men: 0.0% of all households
Household received Food Stamps/SNAP in the past 12 months: 0 Household did not receive Food Stamps/SNAP in the past 12 months: 319
Women who had a birth in the past 12 months: 14 (14 now married, 0 unmarried) Women who did not have a birth in the past 12 months: 129 (61 now married, 67 unmarried)
Housing units in zip code 94586 with a mortgage: 172 (27 second mortgage, 3 home equity loan, 18 both second mortgage and home equity loan) Houses without a mortgage: 7
Median monthly owner costs for units with a mortgage: $3,876 Median monthly owner costs for units without a mortgage: $946
Residents with income below the poverty level in 2022:
This zip code:
6.1%
Whole state:
12.2%
Residents with income below 50% of the poverty level in 2022:
This zip code:
2.1%
Whole state:
6.2%
Median number of rooms in houses and condos:
Here:
6.7
State:
6.0
Median number of rooms in apartments:
Here:
5.3
State:
3.9
Notable locations in this zip code not listed on our city pages
Notable locations in zip code 94586: San Francisco Water Temple (A), Sunol Valley Golf Course (B), Vallecitos Atomic Laboratory (C), East Bay Regional Park District Ambulance Station 4 (D), Department of Forestry and Fire Protection Station 14 Sunol (E). Display/hide their locations on the map
Streams, rivers, and creeks: Indian Creek (A), Indian Joe Creek (B), San Antonio Creek (C), Vallecitos Creek (D), Sheridan Creek (E), Sinbad Creek (F), Leyden Creek (G), Pirate Creek (H), Apperson Creek (I). Display/hide their locations on the map
In group quarters: 3 (-1 institutionalized population)
Size of family households: 119 2-persons, 56 3-persons, 43 4-persons, 33 5-persons, 3 6-persons, 8 7-or-more-persons
Size of nonfamily households: 41 1-person, 21 2-persons
187 married couples with children.
19 single-parent households (12 men, 7 women).
79.2% of residents of 94586 zip code speak English at home.
5.6% of residents speak Spanish at home (14% very well, 63% well, 18% not well, 6% not at all).
10.3% of residents speak other Indo-European language at home (97% very well, 3% well).
4.8% of residents speak Asian or Pacific Island language at home (75% very well, 2% well, 23% not well).
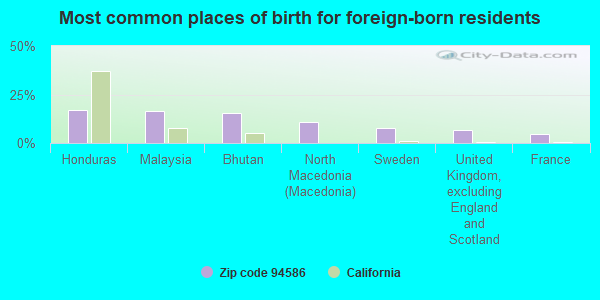
Foreign born population: 165 (17.4%) (91.1% of them are naturalized citizens)
This zip code:
17.4%
Whole state:
26.7%
17%Honduras
16%Malaysia
15%Bhutan
11%North Macedonia (Macedonia)
8%Sweden
7%United Kingdom, excluding England and Scotland
5%France
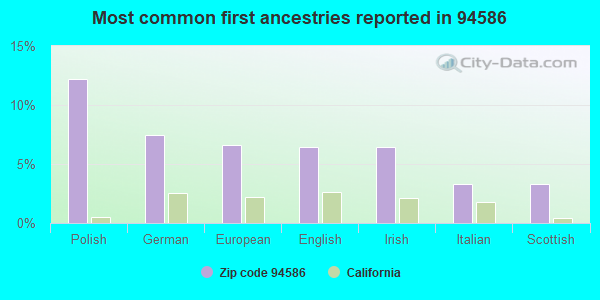
12%Polish
7%German
7%European
6%English
6%Irish
3%Italian
3%Scottish
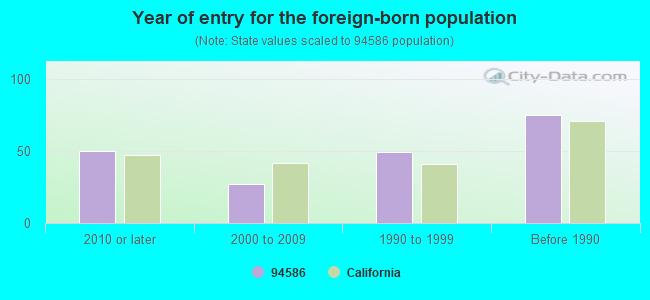
Year of entry for the foreign-born population
502010 or later
272000 to 2009
491990 to 1999
75Before 1990
Facilities with environmental interests located in this zip code:
MISSION VALLEY ROCK CO (7999 ALTHERNOUR WAY in SUNOL, CA)
AIR SYNTHETIC MINOR (AIRS/AFS) CRITERIA AND HAZARDOUS AIR POLLUTANT INVENTORY (Inventory of air pollution sources) Business SIC classification: ASPHALT PAVING MIXTURES AND BLOCKS; BRICK, STONE, AND RELATED CONSTRUCTION MATERIALS
Housing units lacking complete kitchen facilities: 1.3%
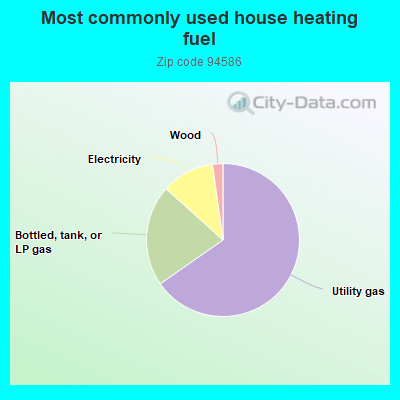
65.7%Utility gas
21.5%Bottled, tank, or LP gas
11.2%Electricity
2.2%Wood
Population in 1990: 953.
Place of birth for U.S.-born residents:
This state: 587
Northeast: 20
Midwest: 52
South: 28
West: 61
81% of the 94586 zip code residents lived in the same house 5 years ago. Out of people who lived in different houses, 64% lived in this county. Out of people who lived in different counties, 50% lived in California.
86% of the 94586 zip code residents lived in the same house 1 year ago. Out of people who lived in different houses, 36% moved from this county. Out of people who lived in different houses, 56% moved from different county within same state. Out of people who lived in different houses, 6% moved from different state.
Private vs. public school enrollment:
Students in private schools in grades 1 to 8 (elementary and middle school): 10
Here:
11.8%
California:
10.5%
Students in private schools in grades 9 to 12 (high school):
Here:
0.0%
California:
8.5%
Students in private undergraduate colleges: 12
Here:
25.0%
California:
15.9%
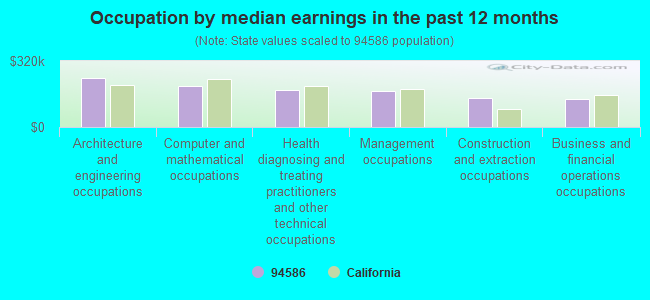
Occupation by median earnings in the past 12 months ($)
236,850Architecture and engineering occupations
197,910Computer and mathematical occupations
177,045Health diagnosing and treating practitioners and other technical occupations
175,229Management occupations
141,424Construction and extraction occupations
136,732Business and financial operations occupations
Companies with federal contracts located in this zip code:
PDE SOLUTIONS INC (2690 PARK WAY in SUNOL, CA; small business)
$3,351 with Navy for ADP Software. Signed on 2006-05-30. Completion date: 2006-06-13.
Top industries in this zip code by the number of employees in 2005:
Arts, Entertainment, and Recreation: Golf Courses and Country Clubs (100-249 employees: 1 establishment)
Mining: Other Crushed and Broken Stone Mining and Quarrying (50-99: 1)
Construction: Site Preparation Contractors (20-49: 1, 5-9: 1, 1-4: 1)
Construction: Masonry Contractors (20-49: 1)
Construction: Poured Concrete Foundation and Structure Contractors (20-49: 1)
Construction: Residential Remodelers (20-49: 1)
Construction: Plumbing, Heating, and Air-Conditioning Contractors (20-49: 1)
Other Services (except Public Administration): Pet Care (except Veterinary) Services (20-49: 1)
Fatal accident statistics in 2014:
Fatal accident count: 2
Vehicles involved in fatal accidents: 4
Fatal accidents caused by drunken drivers: 1
Fatalities: 2
Persons involved in fatal accidents: 4
Pedestrians involved in fatal accidents: 0
Fatal accident statistics in 2013:
Fatal accident count: 2
Vehicles involved in fatal accidents: 5
Fatal accidents caused by drunken drivers: 0
Fatalities: 2
Persons involved in fatal accidents: 9
Pedestrians involved in fatal accidents: 0
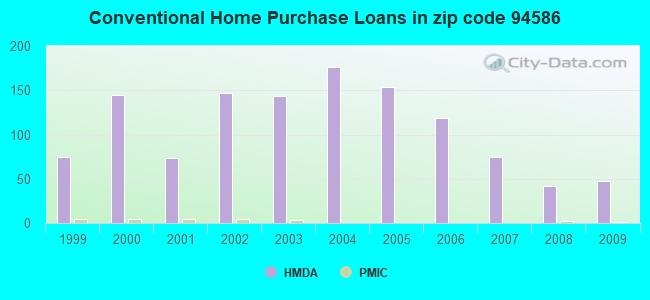
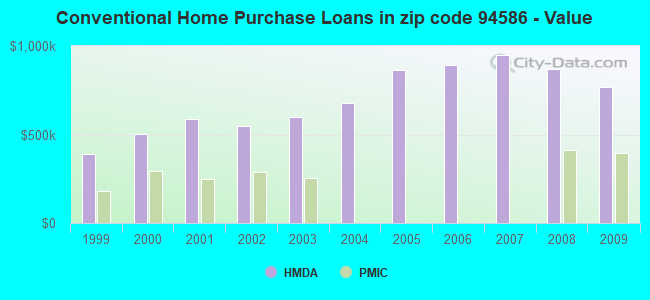
Home Mortgage Disclosure Act Aggregated Statistics For Year 2009 (Based on 4 partial tracts)
A) FHA, FSA/RHS & VA Home Purchase Loans
B) Conventional Home Purchase Loans
C) Refinancings
D) Home Improvement Loans
F) Non-occupant Loans on < 5 Family Dwellings (A B C & D)
Number
Average Value
Number
Average Value
Number
Average Value
Number
Average Value
Number
Average Value
LOANS ORIGINATED
3
$381,180
48
$767,779
324
$506,342
9
$372,830
6
$407,335
APPLICATIONS APPROVED, NOT ACCEPTED
0
$0
7
$644,697
33
$563,346
1
$219,100
1
$313,000
APPLICATIONS DENIED
0
$0
12
$884,732
62
$704,605
3
$182,613
1
$424,800
APPLICATIONS WITHDRAWN
1
$267,930
8
$899,269
40
$633,436
0
$0
0
$0
FILES CLOSED FOR INCOMPLETENESS
0
$0
0
$0
16
$610,244
0
$0
0
$0
Aggregated Statistics For Year 2008 (Based on 4 partial tracts)
A) FHA, FSA/RHS & VA Home Purchase Loans
B) Conventional Home Purchase Loans
C) Refinancings
D) Home Improvement Loans
F) Non-occupant Loans on < 5 Family Dwellings (A B C & D)
Number
Average Value
Number
Average Value
Number
Average Value
Number
Average Value
Number
Average Value
LOANS ORIGINATED
4
$340,890
42
$871,891
117
$620,596
8
$554,616
4
$519,485
APPLICATIONS APPROVED, NOT ACCEPTED
0
$0
13
$856,393
23
$700,929
0
$0
1
$828,820
APPLICATIONS DENIED
2
$503,345
10
$1,186,448
48
$832,435
5
$254,588
5
$721,964
APPLICATIONS WITHDRAWN
1
$154,000
13
$874,208
22
$724,890
0
$0
2
$1,192,490
FILES CLOSED FOR INCOMPLETENESS
0
$0
3
$1,150,650
7
$929,413
2
$425,440
1
$502,050
Aggregated Statistics For Year 2007 (Based on 4 partial tracts)
B) Conventional Home Purchase Loans
C) Refinancings
D) Home Improvement Loans
F) Non-occupant Loans on < 5 Family Dwellings (A B C & D)
G) Loans On Manufactured Home Dwelling (A B C & D)
Number
Average Value
Number
Average Value
Number
Average Value
Number
Average Value
Number
Average Value
LOANS ORIGINATED
75
$950,578
173
$853,090
14
$429,441
11
$752,018
1
$106,420
APPLICATIONS APPROVED, NOT ACCEPTED
16
$1,012,789
39
$833,243
3
$573,553
3
$488,000
0
$0
APPLICATIONS DENIED
20
$952,633
61
$1,020,981
5
$392,194
3
$1,299,513
0
$0
APPLICATIONS WITHDRAWN
12
$1,023,858
30
$870,431
5
$984,922
1
$1,677,390
0
$0
FILES CLOSED FOR INCOMPLETENESS
6
$971,825
7
$929,833
2
$673,160
0
$0
0
$0
Aggregated Statistics For Year 2006 (Based on 4 partial tracts)
B) Conventional Home Purchase Loans
C) Refinancings
D) Home Improvement Loans
F) Non-occupant Loans on < 5 Family Dwellings (A B C & D)
Number
Average Value
Number
Average Value
Number
Average Value
Number
Average Value
LOANS ORIGINATED
119
$890,172
193
$792,059
12
$725,936
12
$387,662
APPLICATIONS APPROVED, NOT ACCEPTED
31
$838,604
26
$844,299
2
$237,600
3
$548,533
APPLICATIONS DENIED
36
$909,808
48
$864,983
6
$444,975
1
$2,031,580
APPLICATIONS WITHDRAWN
14
$1,011,159
30
$771,890
2
$241,075
2
$282,610
FILES CLOSED FOR INCOMPLETENESS
4
$550,575
8
$487,939
0
$0
1
$156,500
Aggregated Statistics For Year 2005 (Based on 4 partial tracts)
B) Conventional Home Purchase Loans
C) Refinancings
D) Home Improvement Loans
F) Non-occupant Loans on < 5 Family Dwellings (A B C & D)
G) Loans On Manufactured Home Dwelling (A B C & D)
Number
Average Value
Number
Average Value
Number
Average Value
Number
Average Value
Number
Average Value
LOANS ORIGINATED
154
$862,849
227
$733,942
24
$596,495
13
$454,525
1
$77,620
APPLICATIONS APPROVED, NOT ACCEPTED
27
$865,549
33
$717,226
4
$373,850
1
$1,296,210
0
$0
APPLICATIONS DENIED
36
$1,034,433
57
$838,738
8
$449,700
5
$784,366
2
$72,595
APPLICATIONS WITHDRAWN
37
$574,676
39
$626,985
2
$691,510
14
$240,056
0
$0
FILES CLOSED FOR INCOMPLETENESS
5
$1,038,024
14
$828,333
1
$116,800
0
$0
0
$0
Aggregated Statistics For Year 2004 (Based on 4 partial tracts)
B) Conventional Home Purchase Loans
C) Refinancings
D) Home Improvement Loans
F) Non-occupant Loans on < 5 Family Dwellings (A B C & D)
G) Loans On Manufactured Home Dwelling (A B C & D)
Number
Average Value
Number
Average Value
Number
Average Value
Number
Average Value
Number
Average Value
LOANS ORIGINATED
176
$676,584
352
$622,847
13
$421,058
12
$375,423
1
$53,840
APPLICATIONS APPROVED, NOT ACCEPTED
36
$685,564
65
$588,484
2
$873,800
4
$610,662
0
$0
APPLICATIONS DENIED
40
$662,199
60
$672,176
6
$308,167
7
$377,417
0
$0
APPLICATIONS WITHDRAWN
20
$844,908
48
$589,121
4
$438,288
6
$507,042
0
$0
FILES CLOSED FOR INCOMPLETENESS
8
$716,555
11
$667,410
1
$91,600
0
$0
0
$0
Aggregated Statistics For Year 2003 (Based on 4 partial tracts)
A) FHA, FSA/RHS & VA Home Purchase Loans
B) Conventional Home Purchase Loans
C) Refinancings
D) Home Improvement Loans
F) Non-occupant Loans on < 5 Family Dwellings (A B C & D)
Number
Average Value
Number
Average Value
Number
Average Value
Number
Average Value
Number
Average Value
LOANS ORIGINATED
0
$0
144
$601,262
850
$516,868
4
$94,805
21
$262,800
APPLICATIONS APPROVED, NOT ACCEPTED
1
$39,440
27
$659,826
106
$543,173
1
$32,520
1
$233,200
APPLICATIONS DENIED
0
$0
20
$725,944
98
$603,890
3
$44,753
6
$270,267
APPLICATIONS WITHDRAWN
0
$0
20
$506,852
95
$459,967
1
$50,780
7
$433,013
FILES CLOSED FOR INCOMPLETENESS
0
$0
3
$493,120
36
$679,395
0
$0
0
$0
Aggregated Statistics For Year 2002 (Based on 4 partial tracts)
A) FHA, FSA/RHS & VA Home Purchase Loans
B) Conventional Home Purchase Loans
C) Refinancings
D) Home Improvement Loans
E) Loans on Dwellings For 5+ Families
F) Non-occupant Loans on < 5 Family Dwellings (A B C & D)
Number
Average Value
Number
Average Value
Number
Average Value
Number
Average Value
Number
Average Value
Number
Average Value
LOANS ORIGINATED
1
$135,220
147
$549,794
648
$538,465
4
$105,500
1
$512,000
19
$264,913
APPLICATIONS APPROVED, NOT ACCEPTED
0
$0
18
$633,203
92
$533,973
1
$30,640
0
$0
2
$212,980
APPLICATIONS DENIED
0
$0
18
$445,736
48
$636,715
3
$106,607
0
$0
3
$604,400
APPLICATIONS WITHDRAWN
0
$0
17
$489,384
64
$515,251
2
$611,150
0
$0
1
$616,400
FILES CLOSED FOR INCOMPLETENESS
0
$0
5
$768,516
15
$689,891
0
$0
0
$0
1
$179,660
Aggregated Statistics For Year 2001 (Based on 4 partial tracts)
B) Conventional Home Purchase Loans
C) Refinancings
D) Home Improvement Loans
F) Non-occupant Loans on < 5 Family Dwellings (A B C & D)
Number
Average Value
Number
Average Value
Number
Average Value
Number
Average Value
LOANS ORIGINATED
73
$587,434
371
$521,236
13
$74,978
14
$238,545
APPLICATIONS APPROVED, NOT ACCEPTED
16
$501,139
48
$516,480
1
$118,780
1
$332,410
APPLICATIONS DENIED
14
$760,241
49
$520,000
3
$135,580
2
$281,025
APPLICATIONS WITHDRAWN
9
$544,590
48
$407,436
1
$151,990
1
$246,400
FILES CLOSED FOR INCOMPLETENESS
5
$624,330
21
$646,284
1
$16,000
0
$0
Aggregated Statistics For Year 2000 (Based on 4 partial tracts)
A) FHA, FSA/RHS & VA Home Purchase Loans
B) Conventional Home Purchase Loans
C) Refinancings
D) Home Improvement Loans
F) Non-occupant Loans on < 5 Family Dwellings (A B C & D)
Number
Average Value
Number
Average Value
Number
Average Value
Number
Average Value
Number
Average Value
LOANS ORIGINATED
1
$135,220
145
$504,112
74
$396,384
11
$95,606
8
$273,766
APPLICATIONS APPROVED, NOT ACCEPTED
0
$0
22
$614,452
15
$419,403
1
$91,300
0
$0
APPLICATIONS DENIED
0
$0
17
$482,445
24
$463,642
2
$87,830
0
$0
APPLICATIONS WITHDRAWN
0
$0
19
$641,075
12
$343,949
3
$136,153
1
$491,400
FILES CLOSED FOR INCOMPLETENESS
0
$0
9
$571,772
11
$415,547
1
$67,610
0
$0
Aggregated Statistics For Year 1999 (Based on 2 partial tracts)
A) FHA, FSA/RHS & VA Home Purchase Loans
B) Conventional Home Purchase Loans
C) Refinancings
D) Home Improvement Loans
F) Non-occupant Loans on < 5 Family Dwellings (A B C & D)
Detailed PMIC statistics for the following Tracts:4506.01
, 4507.01
2005 - 2018 National Fire Incident Reporting System (NFIRS) incidents
Based on the data from the years 2005 - 2018 the average number of fire incidents per year is 26. The highest number of fire incidents - 46 took place in 2007, and the least - 13 in 2012. The data has a rising trend.
When looking into fire subcategories, the most reports belonged to: Outside Fires (56.4%), and Mobile Property/Vehicle Fires (33.2%).
Fire incident types reported to NFIRS in Zip Code 94586

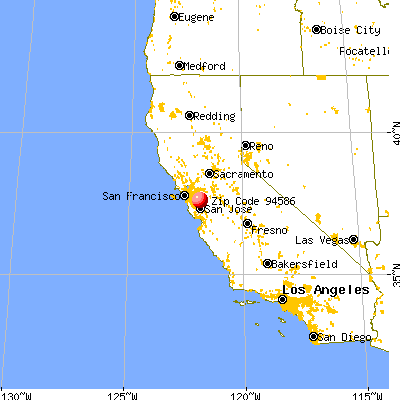


 Nearest zip codes: 94566, 94539, 94536, 94538, 95035, 94568.


 Based on the data from the years 2005 - 2018 the average number of fire incidents per year is 26. The highest number of fire incidents - 46 took place in 2007, and the least - 13 in 2012. The data has a rising trend.
 When looking into fire subcategories, the most reports belonged to: Outside Fires (56.4%), and Mobile Property/Vehicle Fires (33.2%).