Estimated zip code population in 2022: 22
Zip code population in 2010: 89
Zip code population in 2000: 245
March 2022 cost of living index in zip code 94950: 99.8
(near average, U.S. average is 100)
Land area: 8.6
sq. mi.
Water area: 0.0
sq. mi.
| Population density: 3 people per square mile | | (very low). |
![Age and Sex of Residents in zip code 94950]()
- OSM Map
- General Map
- Google Map
- MSN Map
- OSM Map
- General Map
- Google Map
- MSN Map
- OSM Map
- General Map
- Google Map
- MSN Map
- OSM Map
- General Map
- Google Map
- MSN Map
Please wait while loading the map...
Business Search - 14 Million verified businesses
| Males: 7 |  (34.8%) (34.8%) |
| Females: 14 |  (65.2%) (65.2%) |
For population 25 years and over in 94950:
- High school or higher: 102.5%
- Bachelor's degree or higher: 72.1%
- Graduate or professional degree: 36.9%
- Mean travel time to work (commute): 155.6 minutes
For population 15 years and over in 94950:
- Never married: 0.0%
- Now married: 69.6%
- Separated: 0.0%
- Widowed: 30.4%
- Divorced: 0.0%
Zip code 94950 compared to state average:
- Median household income significantly below state average.
- Median house value significantly below state average.
- Unemployed percentage significantly below state average.
- Black race population percentage significantly below state average.
- Hispanic race population percentage significantly below state average.
- Median age significantly above state average.
- Foreign-born population percentage significantly below state average.
- Renting percentage significantly below state average.
- Length of stay since moving in significantly above state average.
- Number of rooms per house significantly below state average.
- House age significantly above state average.
- Number of college students significantly below state average.
- Percentage of population with a bachelor's degree or higher significantly above state average.

- 1571.4%White
- 628.6%Two or more races
Data:
100%
rural population.
Median resident age:| This zip code: | 61.4 years |
| California median age: | 37.9 years |
Average household size:| This zip code: | 1.5 people |
| California: | 2.8 people |
Averages for the 2004 tax year for zip code 94950, filed in 2005:
Average Adjusted Gross Income (AGI) in 2004: $46,127 (Individual Income Tax Returns)
| Here: | $46,127 |
| State: | $58,600 |
Salary/wage: $43,565 (reported on 83.3% of returns)
| Here: | $43,565 |
| State: | $49,455 |
(% of AGI for various income ranges: 123.1% for AGIs $10k-25k, 86.0% for AGIs $25k-50k, 82.6% for AGIs $50k-75k, 63.8% for AGIs $75k-100k)
Taxable interest for individuals: $860 (reported on 42.2% of returns)
| This zip code: | $860 |
| California: | $2,365 |
Taxable dividends: $2,657 (reported on 34.3% of returns)
Total itemized deductions: $21,875 (24% of AGI, reported on 23.5% of returns)
| Here: | $21,875 |
| State: | $28,113 |
| Here: | 23.8% of AGI |
| State: | 25.3% of AGI |
Charity contributions deductions: $1,364 (2% of AGI, reported on 21.6% of returns)
| Here: | 1.6% of AGI |
| State: | 3.3% of AGI |
Total tax: $6,494 (reported on 85.3% of returns)
| 94950: | $6,494 |
| State: | $10,761 |
(% of AGI for various income ranges: 4.6% for AGIs $10k-25k, 10.3% for AGIs $25k-50k, 10.9% for AGIs $50k-75k, 15.5% for AGIs $75k-100k)
Percentage of individuals using paid preparers for their 2004 taxes: 47.1%
(% for various income ranges: 71.4% for AGIs below $10k, 84.2% for AGIs $10k-25k, 104.8% for AGIs $50k-75k)
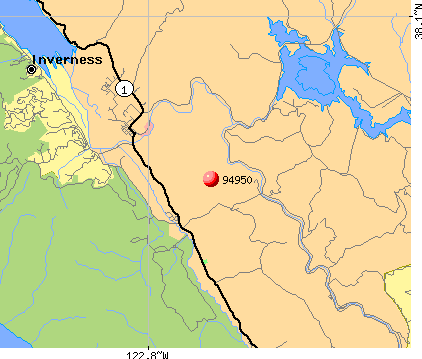
![94950 map]() Nearest zip codes: 94938
Nearest zip codes: 94938,
94933,
94924,
94963,
94956,
94946.
Percentage of family households:| This zip code: | 51.5% |
| California: | 46.8% |
Percentage of households with unmarried partners:| This zip code: | 0.0% |
| California: | 48.1% |
No gay or lesbian households reported
Household received Food Stamps/SNAP in the past 12 months: 0
Household did not receive Food Stamps/SNAP in the past 12 months: 14
Housing units in zip code 94950 with a mortgage: 15 (5
second mortgage, 5
both second mortgage and home equity loan)

- Year house built (houses)
- 02020 or later
- 02010 to 2019
- 02000 to 2009
- 01990 to 1999
- 01980 to 1989
- 01970 to 1979
- 01960 to 1969
- 71950 to 1959
- 01940 to 1949
- 81939 or earlier
![Zip code 94950 satellite photo by USGS]()
- Bedrooms in owner-occupied houses and condos in 94950
- 0no bedroom
- 01 bedroom
- 02 bedrooms
- 83 bedrooms
- 74 bedrooms
- 05+ bedrooms
- Cars and other vehicles available in 94950 in owner-occupied houses/condos
- 0no vehicle
- 71 vehicle
- 02 vehicles
- 83 vehicles
- 04 vehicles
- 05+ vehicles
Zip code 94950 household income distribution in 2022
![Zip code 94950 household income distribution in 2022]()
- 6$125,000 to $149,999
- 8$200,000 or more
Estimated median house (or condo) value in 2022 for:
- White Non-Hispanic householders: $602,496
Mean price in 2022:
Detached houses: $3,711,135| Here: | $3,711,135 |
| State: | $988,808 |
Housing units in structures:
Means of transportation to work in zip code 94950
![Means of transportation to work in zip code 94950]()
- 64.3%15Drove a car alone
- 34.3%8Worked at home
Travel time to work (commute) in zip code 94950
![Travel time to work (commute) in zip code 94950]()
- 75 to 9 minutes
- 725 to 29 minutes
Percentage of zip code residents living and working in this county: 65.2%
Household type by relationship:
Households: 22
- Male householders: 0 (0 living alone), Female householders: 15 (7 living alone)
8 spouses (8 opposite-sex spouses), 0 unmarried partners, (0 opposite-sex unmarried partners), 0 children (0 natural, 0 adopted, 0 stepchildren), 0 grandchildren, 0 brothers or sisters, 0 parents, 0 foster children, 0 other relatives, 0 non-relatives
Size of family households: 8 2-persons
Size of nonfamily households: 7 1-person
All residents speak English at home
Foreign born population: 0 (0.0%)
- 54.3%Electricity
- 47.5%Wood
Place of birth for U.S.-born residents:
- This state: 14
- Northeast: 7
58% of the 94950 zip code residents lived in the same house 5 years ago.
Out of people who lived in different houses, 34% lived in this county.
100% of the 94950 zip code residents lived in the same house 1 year ago.
Top industries in this zip code by the number of employees in 2005:
- Accommodation and Food Services: Limited-Service Restaurants (20-49 employees: 1 establishment)
- Accommodation and Food Services: Bed-and-Breakfast Inns (10-19: 1, 5-9: 1, 1-4: 1)
- Accommodation and Food Services: Full-Service Restaurants (5-9: 1)
- Wholesale Trade: Wholesale Trade Agents and Brokers (1-4: 1)
- Professional, Scientific, and Technical Services: Offices of Certified Public Accountants (1-4: 1)
- Arts, Entertainment, and Recreation: All Other Amusement and Recreation Industries (1-4: 1)
- Construction: New Single-Family Housing Construction (except Operative Builders) (1-4: 1)
- Administrative and Support and Waste Management and Remediation Services: Office Administrative Services (1-4: 1)
People in group quarters in 2010:
- 3 people in other noninstitutional facilities
People in group quarters in 2000:
- 105 people in other workers' dormitories
- 5 people in unknown juvenile institutions
Home Mortgage Disclosure Act Aggregated Statistics For Year 2009
(Based on 2 partial tracts)
|
| B) Conventional
Home Purchase Loans | C) Refinancings
| F) Non-occupant Loans on
< 5 Family Dwellings (A B C & D) |
|---|
| Number | Average Value | Number | Average Value | Number | Average Value |
|---|
| LOANS ORIGINATED | 1 | $438,540 | 10 | $359,968 | 5 | $364,734 |
| APPLICATIONS APPROVED, NOT ACCEPTED | 0 | $0 | 1 | $668,900 | 1 | $502,230 |
| APPLICATIONS DENIED | 0 | $0 | 3 | $440,223 | 1 | $462,040 |
| APPLICATIONS WITHDRAWN | 0 | $0 | 2 | $341,970 | 1 | $286,580 |
| FILES CLOSED FOR INCOMPLETENESS | 0 | $0 | 0 | $0 | 0 | $0 |
Aggregated Statistics For Year 2008
(Based on 2 partial tracts)
|
| B) Conventional
Home Purchase Loans | C) Refinancings
| F) Non-occupant Loans on
< 5 Family Dwellings (A B C & D) |
|---|
| Number | Average Value | Number | Average Value | Number | Average Value |
|---|
| LOANS ORIGINATED | 1 | $641,450 | 4 | $437,088 | 3 | $357,363 |
| APPLICATIONS APPROVED, NOT ACCEPTED | 0 | $0 | 0 | $0 | 0 | $0 |
| APPLICATIONS DENIED | 0 | $0 | 2 | $422,125 | 0 | $0 |
| APPLICATIONS WITHDRAWN | 0 | $0 | 1 | $239,140 | 0 | $0 |
| FILES CLOSED FOR INCOMPLETENESS | 0 | $0 | 0 | $0 | 0 | $0 |
Aggregated Statistics For Year 2007
(Based on 2 partial tracts)
|
| B) Conventional
Home Purchase Loans | C) Refinancings
| D) Home Improvement Loans
| F) Non-occupant Loans on
< 5 Family Dwellings (A B C & D) |
|---|
| Number | Average Value | Number | Average Value | Number | Average Value | Number | Average Value |
|---|
| LOANS ORIGINATED | 2 | $458,635 | 5 | $416,142 | 1 | $240,570 | 3 | $428,073 |
| APPLICATIONS APPROVED, NOT ACCEPTED | 0 | $0 | 1 | $165,140 | 0 | $0 | 0 | $0 |
| APPLICATIONS DENIED | 0 | $0 | 1 | $604,010 | 0 | $0 | 0 | $0 |
| APPLICATIONS WITHDRAWN | 0 | $0 | 1 | $336,980 | 0 | $0 | 0 | $0 |
| FILES CLOSED FOR INCOMPLETENESS | 0 | $0 | 0 | $0 | 0 | $0 | 0 | $0 |
Aggregated Statistics For Year 2006
(Based on 2 partial tracts)
|
| B) Conventional
Home Purchase Loans | C) Refinancings
| D) Home Improvement Loans
| F) Non-occupant Loans on
< 5 Family Dwellings (A B C & D) |
|---|
| Number | Average Value | Number | Average Value | Number | Average Value | Number | Average Value |
|---|
| LOANS ORIGINATED | 2 | $586,605 | 5 | $392,294 | 1 | $172,500 | 2 | $548,725 |
| APPLICATIONS APPROVED, NOT ACCEPTED | 0 | $0 | 1 | $383,530 | 0 | $0 | 0 | $0 |
| APPLICATIONS DENIED | 0 | $0 | 2 | $482,075 | 0 | $0 | 0 | $0 |
| APPLICATIONS WITHDRAWN | 0 | $0 | 1 | $696,790 | 0 | $0 | 0 | $0 |
| FILES CLOSED FOR INCOMPLETENESS | 0 | $0 | 0 | $0 | 0 | $0 | 0 | $0 |
Aggregated Statistics For Year 2005
(Based on 2 partial tracts)
|
| B) Conventional
Home Purchase Loans | C) Refinancings
| D) Home Improvement Loans
| F) Non-occupant Loans on
< 5 Family Dwellings (A B C & D) |
|---|
| Number | Average Value | Number | Average Value | Number | Average Value | Number | Average Value |
|---|
| LOANS ORIGINATED | 3 | $553,100 | 6 | $496,150 | 1 | $307,880 | 3 | $465,003 |
| APPLICATIONS APPROVED, NOT ACCEPTED | 1 | $420,090 | 1 | $359,810 | 0 | $0 | 0 | $0 |
| APPLICATIONS DENIED | 0 | $0 | 1 | $931,320 | 0 | $0 | 0 | $0 |
| APPLICATIONS WITHDRAWN | 1 | $442,490 | 2 | $307,110 | 0 | $0 | 0 | $0 |
| FILES CLOSED FOR INCOMPLETENESS | 0 | $0 | 0 | $0 | 0 | $0 | 0 | $0 |
Aggregated Statistics For Year 2004
(Based on 2 partial tracts)
|
| B) Conventional
Home Purchase Loans | C) Refinancings
| D) Home Improvement Loans
| F) Non-occupant Loans on
< 5 Family Dwellings (A B C & D) |
|---|
| Number | Average Value | Number | Average Value | Number | Average Value | Number | Average Value |
|---|
| LOANS ORIGINATED | 2 | $662,150 | 8 | $423,306 | 1 | $259,130 | 2 | $523,800 |
| APPLICATIONS APPROVED, NOT ACCEPTED | 0 | $0 | 2 | $368,710 | 0 | $0 | 1 | $336,540 |
| APPLICATIONS DENIED | 0 | $0 | 1 | $480,700 | 0 | $0 | 0 | $0 |
| APPLICATIONS WITHDRAWN | 1 | $262,530 | 1 | $415,590 | 0 | $0 | 0 | $0 |
| FILES CLOSED FOR INCOMPLETENESS | 1 | $160,860 | 0 | $0 | 0 | $0 | 0 | $0 |
Aggregated Statistics For Year 2003
(Based on 2 partial tracts)
|
| B) Conventional
Home Purchase Loans | C) Refinancings
| F) Non-occupant Loans on
< 5 Family Dwellings (A B C & D) |
|---|
| Number | Average Value | Number | Average Value | Number | Average Value |
|---|
| LOANS ORIGINATED | 2 | $615,595 | 23 | $313,546 | 6 | $319,482 |
| APPLICATIONS APPROVED, NOT ACCEPTED | 1 | $541,200 | 3 | $323,287 | 0 | $0 |
| APPLICATIONS DENIED | 0 | $0 | 2 | $639,640 | 1 | $307,660 |
| APPLICATIONS WITHDRAWN | 0 | $0 | 4 | $256,492 | 1 | $109,800 |
| FILES CLOSED FOR INCOMPLETENESS | 0 | $0 | 1 | $175,460 | 0 | $0 |
Aggregated Statistics For Year 2002
(Based on 2 partial tracts)
|
| B) Conventional
Home Purchase Loans | C) Refinancings
| F) Non-occupant Loans on
< 5 Family Dwellings (A B C & D) |
|---|
| Number | Average Value | Number | Average Value | Number | Average Value |
|---|
| LOANS ORIGINATED | 1 | $626,190 | 15 | $326,084 | 5 | $312,930 |
| APPLICATIONS APPROVED, NOT ACCEPTED | 1 | $216,640 | 3 | $279,110 | 0 | $0 |
| APPLICATIONS DENIED | 0 | $0 | 2 | $303,160 | 1 | $135,490 |
| APPLICATIONS WITHDRAWN | 0 | $0 | 1 | $356,960 | 0 | $0 |
| FILES CLOSED FOR INCOMPLETENESS | 0 | $0 | 1 | $335,660 | 0 | $0 |
Aggregated Statistics For Year 2001
(Based on 2 partial tracts)
|
| B) Conventional
Home Purchase Loans | C) Refinancings
| D) Home Improvement Loans
| F) Non-occupant Loans on
< 5 Family Dwellings (A B C & D) |
|---|
| Number | Average Value | Number | Average Value | Number | Average Value | Number | Average Value |
|---|
| LOANS ORIGINATED | 1 | $443,700 | 11 | $354,784 | 1 | $31,290 | 3 | $316,773 |
| APPLICATIONS APPROVED, NOT ACCEPTED | 0 | $0 | 2 | $273,730 | 0 | $0 | 1 | $86,190 |
| APPLICATIONS DENIED | 0 | $0 | 1 | $287,570 | 0 | $0 | 0 | $0 |
| APPLICATIONS WITHDRAWN | 0 | $0 | 1 | $350,370 | 0 | $0 | 0 | $0 |
| FILES CLOSED FOR INCOMPLETENESS | 0 | $0 | 0 | $0 | 0 | $0 | 0 | $0 |
Aggregated Statistics For Year 2000
(Based on 2 partial tracts)
|
| B) Conventional
Home Purchase Loans | C) Refinancings
| D) Home Improvement Loans
| F) Non-occupant Loans on
< 5 Family Dwellings (A B C & D) |
|---|
| Number | Average Value | Number | Average Value | Number | Average Value | Number | Average Value |
|---|
| LOANS ORIGINATED | 3 | $378,553 | 3 | $312,490 | 1 | $50,180 | 1 | $388,910 |
| APPLICATIONS APPROVED, NOT ACCEPTED | 0 | $0 | 0 | $0 | 0 | $0 | 0 | $0 |
| APPLICATIONS DENIED | 0 | $0 | 1 | $124,730 | 0 | $0 | 0 | $0 |
| APPLICATIONS WITHDRAWN | 0 | $0 | 0 | $0 | 0 | $0 | 0 | $0 |
| FILES CLOSED FOR INCOMPLETENESS | 0 | $0 | 0 | $0 | 0 | $0 | 0 | $0 |
Aggregated Statistics For Year 1999
(Based on 1 partial tract)
|
| B) Conventional
Home Purchase Loans | C) Refinancings
| F) Non-occupant Loans on
< 5 Family Dwellings (A B C & D) |
|---|
| Number | Average Value | Number | Average Value | Number | Average Value |
|---|
| LOANS ORIGINATED | 2 | $262,515 | 3 | $218,357 | 1 | $190,510 |
| APPLICATIONS APPROVED, NOT ACCEPTED | 0 | $0 | 0 | $0 | 0 | $0 |
| APPLICATIONS DENIED | 0 | $0 | 1 | $350,880 | 0 | $0 |
| APPLICATIONS WITHDRAWN | 0 | $0 | 1 | $244,570 | 0 | $0 |
| FILES CLOSED FOR INCOMPLETENESS | 0 | $0 | 0 | $0 | 0 | $0 |
| Most common first names in zip code 94950 among deceased individuals |
| Name | Count | Lived (average) |
|---|
| Edward | 2 | 70.5 years |
| John | 2 | 73.0 years |
| Joseph | 2 | 81.5 years |
| Robert | 2 | 67.5 years |
| Thomas | 2 | 63.0 years |
| Most common last names in zip code 94950 among deceased individuals |
| Last name | Count | Lived (average) |
|---|
| Pinkerton | 4 | 83.0 years |
| Beeman | 2 | 96.5 years |
| Dellepere | 2 | 81.1 years |
| Mcisaac | 2 | 85.5 years |
| Stewart | 2 | 89.5 years |
 100% rural population.


 Nearest zip codes: 94938, 94933, 94924, 94963, 94956, 94946.


