Estimated zip code population in 2022: 667 Zip code population in 2010: 699 Zip code population in 2000: 589
Houses and condos: 318 Renter-occupied apartments: 71
% of renters here:
24%
State:
44%
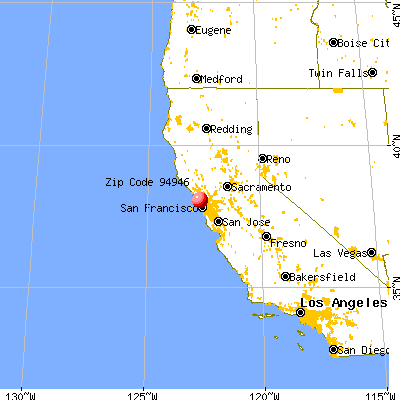
March 2022 cost of living index in zip code 94946: 119.9 (more than average, U.S. average is 100)
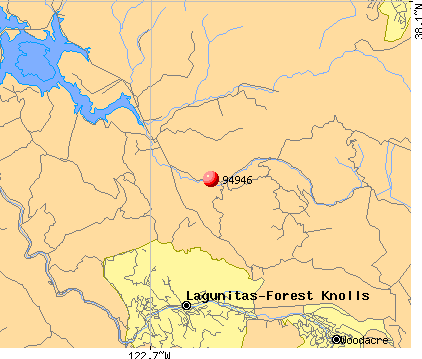
Land area: 43.7 sq. mi. Water area: 1.4 sq. mi.
Population density: 15 people per square mile
(very low).
OSM Map
General Map
Google Map
MSN Map
OSM Map
General Map
Google Map
MSN Map
OSM Map
General Map
Google Map
MSN Map
OSM Map
General Map
Google Map
MSN Map
Please wait while loading the map...
Real estate property taxes paid for housing units in 2022:
This zip code:
0.5% ($10,292)
California:
0.7% ($4,831)
Median real estate property taxes paid for housing units with mortgages in 2022: $10,330 (0.5%) Median real estate property taxes paid for housing units with no mortgage in 2022: $10,572 (0.5%)
Business Search- 14 Million verified businesses
Males: 323
(48.4%)
Females: 344
(51.6%)
For population 25 years and over in 94946:
High school or higher: 98.6%
Bachelor's degree or higher: 56.1%
Graduate or professional degree: 29.5%
Unemployed: 3.5%
Mean travel time to work (commute): 37.0 minutes
For population 15 years and over in 94946:
Never married: 28.3%
Now married: 50.7%
Separated: 1.9%
Widowed: 2.4%
Divorced: 16.7%
Zip code 94946 compared to state average:
Median house value significantly above state average.
Black race population percentage below state average.
Hispanic race population percentage significantly below state average.
Median age significantly above state average.
Foreign-born population percentage below state average.
Renting percentage below state average.
Length of stay since moving in significantly above state average.
Number of college students below state average.
Percentage of population with a bachelor's degree or higher above state average.
Estimated median house/condo value in 2022: $2,171,698
94946:
$2,171,698
California:
$715,900
Median resident age:
This zip code:
56.4 years
California median age:
37.9 years
Average household size:
This zip code:
2.2 people
California:
2.8 people
Averages for the 2020 tax year for zip code 94946, filed in 2021:
Average Adjusted Gross Income (AGI) in 2020: $236,363 (Individual Income Tax Returns)
Here:
$236,363
State:
$95,910
Salary/wage: $110,495 (reported on 63.3% of returns)
Here:
$110,495
State:
$77,331
(% of AGI for various income ranges: 738.0% for AGIs below $25k, 7503.3% for AGIs $50k-75k, 15865.0% for AGIs $100k-200k)
Taxable interest for individuals: $7,062 (reported on 53.3% of returns)
This zip code:
$7,062
California:
$2,294
(% of AGI for various income ranges: 50.0% for AGIs $50k-75k, 190.0% for AGIs $100k-200k)
Ordinary dividends: $33,021 (reported on 46.7% of returns)
Here:
$33,021
State:
$10,949
(% of AGI for various income ranges: 158.0% for AGIs below $25k, 1786.7% for AGIs $50k-75k, 1380.0% for AGIs $100k-200k)
Net capital gain/loss in AGI: +$83,115 (reported on 43.3% of returns)
Here:
+$83,115
State:
+$49,306
(% of AGI for various income ranges: 686.7% for AGIs $50k-75k, 2985.0% for AGIs $100k-200k)
Profit/loss from business: +$50,044 (reported on 30.0% of returns)
Here:
+$50,044
State:
+$15,671
(% of AGI for various income ranges: 5175.0% for AGIs $100k-200k)
Taxable individual retirement arrangement distribution: $26,425 (reported on 13.3% of returns)
94946:
$26,425
California:
$23,505
(% of AGI for various income ranges: 5285.0% for AGIs $100k-200k)
Total itemized deductions: $48,400 (reported on 30.0% of returns)
Here:
$48,400
State:
$39,517
(% of AGI for various income ranges: 8505.0% for AGIs $100k-200k)
Charity contributions: $10,000 (reported on 23.3% of returns)
Here:
$10,000
State:
$12,598
(% of AGI for various income ranges: 260.0% for AGIs $100k-200k)
Taxes paid: $9,078 (reported on 30.0% of returns)
94946:
$9,078
State:
$8,807
(% of AGI for various income ranges: 1785.0% for AGIs $100k-200k)
Percentage of individuals using paid preparers for their 2020 taxes: 93.3%
Here:
93%
State:
92%
(% for various income ranges: 85.7% for AGIs below $25k, 80.0% for AGIs $25k-50k, 100.0% for AGIs $50k-75k, 100.0% for AGIs $75k-100k, 100.0% for AGIs $100k-200k, 100.0% for AGIs over 200k)
Averages for the 2012 tax year for zip code 94946, filed in 2013:
Average Adjusted Gross Income (AGI) in 2012: $313,814 (Individual Income Tax Returns)
Here:
$313,814
State:
$72,726
Salary/wage: $128,620 (reported on 71.4% of returns)
Here:
$128,620
State:
$59,079
(% of AGI for various income ranges: 65.5% for AGIs below $25k, 74.9% for AGIs $25k-50k, 71.1% for AGIs $50k-75k, 60.9% for AGIs $100k-200k, 23.6% for AGIs over 200k)
Taxable interest for individuals: $10,320 (reported on 53.6% of returns)
This zip code:
$10,320
California:
$2,146
(% of AGI for various income ranges: 2.4% for AGIs below $25k, 0.6% for AGIs $50k-75k, 1.1% for AGIs $100k-200k, 1.9% for AGIs over 200k)
Ordinary dividends: $39,067 (reported on 42.9% of returns)
Here:
$39,067
State:
$9,308
(% of AGI for various income ranges: 13.1% for AGIs below $25k, 14.3% for AGIs $50k-75k, 5.3% for AGIs over 200k)
Net capital gain/loss in AGI: +$163,782 (reported on 39.3% of returns)
Here:
+$163,782
State:
+$30,460
(% of AGI for various income ranges: 0.8% for AGIs below $25k, 8.0% for AGIs $50k-75k, 23.2% for AGIs over 200k)
Profit/loss from business: +$26,000 (reported on 25.0% of returns)
Here:
+$26,000
State:
+$17,064
(% of AGI for various income ranges: 25.2% for AGIs below $25k, 8.1% for AGIs $50k-75k, 1.7% for AGIs over 200k)
Taxable individual retirement arrangement distribution: $68,900 (reported on 10.7% of returns)
94946:
$68,900
California:
$19,557
(% of AGI for various income ranges: 2.7% for AGIs over 200k)
Total itemized deductions: $97,580 (18% of AGI, reported on 53.6% of returns)
Here:
$97,580
State:
$34,004
Here:
17.7% of AGI
State:
22.7% of AGI
(% of AGI for various income ranges: 76.4% for AGIs below $25k, 26.6% for AGIs $50k-75k, 27.9% for AGIs $100k-200k, 15.2% for AGIs over 200k)
Charity contributions: $9,042 (reported on 42.9% of returns)
Here:
$9,042
State:
$4,659
(% of AGI for various income ranges: 1.3% for AGIs $50k-75k, 1.8% for AGIs $100k-200k, 1.2% for AGIs over 200k)
Taxes paid: $53,133 (reported on 53.6% of returns)
94946:
$53,133
State:
$14,448
(% of AGI for various income ranges: 19.3% for AGIs below $25k, 7.2% for AGIs $50k-75k, 10.4% for AGIs $100k-200k, 9.2% for AGIs over 200k)
Earned income credit: $1,300 (reported on 7.1% of returns)
Here:
$1,300
State:
$2,286
(% of AGI for various income ranges: 3.3% for AGIs below $25k)
Percentage of individuals using paid preparers for their 2012 taxes: 71.4%
Here:
71%
State:
64%
(% for various income ranges: 71.4% for AGIs below $25k, 60.0% for AGIs $25k-50k, 60.0% for AGIs $50k-75k, 75.0% for AGIs $100k-200k, 85.7% for AGIs over 200k)
Averages for the 2004 tax year for zip code 94946, filed in 2005:
Average Adjusted Gross Income (AGI) in 2004: $113,491 (Individual Income Tax Returns)
Here:
$113,491
State:
$58,600
Salary/wage: $99,820 (reported on 67.3% of returns)
Here:
$99,820
State:
$49,455
(% of AGI for various income ranges: 66.2% for AGIs $10k-25k, 64.6% for AGIs $25k-50k, 58.4% for AGIs $50k-75k, 60.1% for AGIs $75k-100k, 54.2% for AGIs over 100k)
Taxable interest for individuals: $5,617 (reported on 62.3% of returns)
This zip code:
$5,617
California:
$2,365
(% of AGI for various income ranges: 3.6% for AGIs $10k-25k, 2.3% for AGIs $25k-50k, 1.0% for AGIs $50k-75k, 4.5% for AGIs $75k-100k, 2.3% for AGIs over 100k)
Taxable dividends: $8,753 (reported on 53.4% of returns)
Here:
$8,753
State:
$4,746
(% of AGI for various income ranges: 7.4% for AGIs $10k-25k, 3.5% for AGIs $25k-50k, 9.2% for AGIs $50k-75k, 4.2% for AGIs $75k-100k, 3.2% for AGIs over 100k)
Net capital gain/loss: +$27,377 (reported on 43.4% of returns)
Here:
+$27,377
State:
+$23,418
(% of AGI for various income ranges: 1.9% for AGIs $10k-25k, 4.6% for AGIs $25k-50k, -0.2% for AGIs $50k-75k, 11.8% for AGIs over 100k)
Profit/loss from business: +$31,988 (reported on 29.5% of returns)
Here:
+$31,988
State:
+$16,826
(% of AGI for various income ranges: 9.9% for AGIs $10k-25k, 4.9% for AGIs $50k-75k, 9.1% for AGIs over 100k)
Total itemized deductions: $51,728 (23% of AGI, reported on 48.4% of returns)
Here:
$51,728
State:
$28,113
Here:
23.1% of AGI
State:
25.3% of AGI
(% of AGI for various income ranges: 17.7% for AGIs $25k-50k, 19.8% for AGIs $50k-75k, 33.0% for AGIs $75k-100k, 19.7% for AGIs over 100k)
Charity contributions deductions: $6,242 (3% of AGI, reported on 42.7% of returns)
Here:
$6,242
State:
$3,923
Here:
2.7% of AGI
State:
3.3% of AGI
(% of AGI for various income ranges: 2.5% for AGIs $25k-50k, 2.1% for AGIs $75k-100k, 2.3% for AGIs over 100k)
Total tax: $24,561 (reported on 79.4% of returns)
94946:
$24,561
State:
$10,761
(% of AGI for various income ranges: 5.1% for AGIs $10k-25k, 8.9% for AGIs $25k-50k, 9.5% for AGIs $50k-75k, 9.4% for AGIs $75k-100k, 17.7% for AGIs over 100k)
Earned income credit: $1,474 (reported on 6.8% of returns)
Here:
$1,474
State:
$1,763
Percentage of individuals using paid preparers for their 2004 taxes: 71.5%
Here:
72%
State:
66%
(% for various income ranges: 76.7% for AGIs below $10k, 62.0% for AGIs $10k-25k, 57.5% for AGIs $25k-50k, 59.1% for AGIs $50k-75k, 65.2% for AGIs $75k-100k, 84.9% for AGIs over 100k)
Household received Food Stamps/SNAP in the past 12 months: 8 Household did not receive Food Stamps/SNAP in the past 12 months: 283
Women who had a birth in the past 12 months: 4 (4 now married, 0 unmarried) Women who did not have a birth in the past 12 months: 101 (31 now married, 70 unmarried)
Housing units in zip code 94946 with a mortgage: 109 (21 second mortgage, 2 home equity loan, 12 both second mortgage and home equity loan) Houses without a mortgage: 3
Median monthly owner costs for units with a mortgage: $3,876 Median monthly owner costs for units without a mortgage: $1,556
Residents with income below the poverty level in 2022:
This zip code:
5.1%
Whole state:
12.2%
Residents with income below 50% of the poverty level in 2022:
This zip code:
2.5%
Whole state:
6.2%
Median number of rooms in houses and condos:
Here:
6.2
State:
6.0
Median number of rooms in apartments:
Here:
3.4
State:
3.9
Notable locations in this zip code not listed on our city pages
Notable locations in zip code 94946: Big Rock Ranch (A), Nicasio Volunteer Fire Protection District (B), Skywalker Ranch Fire Brigade (C). Display/hide their locations on the map
Size of family households: 122 2-persons, 25 3-persons, 21 4-persons, 8 5-persons, 3 7-or-more-persons
Size of nonfamily households: 87 1-person, 28 2-persons, 4 3-persons
68 married couples with children.
2 single-parent households (2 women).
85.3% of residents of 94946 zip code speak English at home.
6.4% of residents speak Spanish at home (55% very well, 12% well, 33% not well).
7.1% of residents speak other Indo-European language at home (100% very well).
0.9% of residents speak Asian or Pacific Island language at home (100% not well).
0.5% of residents speak other language at home (100% very well).
Foreign born population: 82 (12.3%) (78.4% of them are naturalized citizens)
This zip code:
12.3%
Whole state:
26.7%
22%Honduras
14%North Macedonia (Macedonia)
6%Sweden
6%Belgium
6%France
6%Taiwan
6%India
18%Canadian
15%German
9%European
6%Irish
6%English
3%French
3%Polish
Year of entry for the foreign-born population
72010 or later
182000 to 2009
281990 to 1999
33Before 1990
Facilities with environmental interests located in this zip code:
NICASIO ELEMENTARY (5555 NICASIO VALLEY ROAD in NICASIO, CA)
(National Center for Education Statistics) - STATE ID-6024483
MARIN COUNTY AGRICULTURE COM (5600 NICASIO VALLEY RD in NICASIO, CA)
(Resource Conservation and Recovery Act (tracking hazardous waste))
HALLECK CREEK (OLD RANCHERIA RD, APN 121-100- in NICASIO, CA)
CRITERIA AND HAZARDOUS AIR POLLUTANT INVENTORY (Inventory of air pollution sources) Business SIC classification: REFUSE SYSTEMS Business NAICS classification: SOLID WASTE LANDFILL.
Housing units lacking complete kitchen facilities: 3.6%
67.4%Bottled, tank, or LP gas
15.8%Electricity
9.6%Wood
4.1%Utility gas
1.7%Solar energy
1.0%Fuel oil, kerosene, etc.
1.0%Other fuel
Population in 1990: 665.
Place of birth for U.S.-born residents:
This state: 375
Northeast: 54
Midwest: 69
South: 45
West: 27
72% of the 94946 zip code residents lived in the same house 5 years ago. Out of people who lived in different houses, 65% lived in this county. Out of people who lived in different counties, 50% lived in California.
90% of the 94946 zip code residents lived in the same house 1 year ago. Out of people who lived in different houses, 45% moved from this county. Out of people who lived in different houses, 15% moved from different county within same state. Out of people who lived in different houses, 33% moved from different state. Out of people who lived in different houses, 5% moved from abroad.
Private vs. public school enrollment:
Students in private schools in grades 1 to 8 (elementary and middle school): 12
Here:
29.4%
California:
10.5%
Students in private schools in grades 9 to 12 (high school): 12
Here:
31.9%
California:
8.5%
Students in private undergraduate colleges:
Here:
0.0%
California:
15.9%
Occupation by median earnings in the past 12 months ($)
176,576Education, training, and library occupations
160,536Computer and mathematical occupations
103,518Health diagnosing and treating practitioners and other technical occupations
93,357Legal occupations
86,923Business and financial operations occupations
71,234Office and administrative support occupations
Companies with federal contracts located in this zip code:
IRONWIND INC (201 WILLOW RD in NICASIO, CA; small business) 6 employees, $1000000 revenue. : $12,985,510 in 10 contractsfrom 2003 to 2006
Contracts for Small Craft, Miscellaneous Ship and Marine Equipment by Navy, Maritime Administration, National Park Service Signed by year:2000: $0; 2001: $0; 2002: $0; 2003: $3,127,473; 2004: $3,317,274; 2005: $1,359,907; 2006: $5,180,856.
Biggest contracts:
$5,180,856 with Navy for Small Craft. Signed on 2006-04-20. Completion date: 2009-03-30.
$2,740,194, same as above.Signed on 2003-05-16. Completion date: 2004-09-16.
$1,433,547, same as above.Signed on 2004-03-30. Completion date: 2006-12-30.
$1,405,878, same as above.Signed on 2004-02-09. Completion date: 2005-05-09.
AETHER WIRE & LOCATION, INC (5950 LUCAS VALLEY RD in NICASIO, CA; small business) : $3,302,532 in 13 contractsfrom 2000 to 2004
Contracts for Defense Electronics and Communication Equipment -- Applied Research and Exploratory Development (R&D), Other Defense -- Advanced Development (R&D), Other Research and Development -- Basic Research (R&D), Other Defense -- Applied Research and Exploratory Development (R&D), and moreby Navy, Air Force, Army Signed by year:2000: $1,589,946; 2001: $1,021,121; 2002: $292,465; 2003: $300,000; 2004: $99,000; 2005: $0; 2006: $0.
Biggest contracts:
$880,000 with Navy for Defense Electronics and Communication Equipment -- Applied Research and Exploratory Development (R&D). Signed on 2000-07-27. Completion date: 2003-01-31.
$566,418 with Air Force for Other Defense -- Advanced Development (R&D). Signed on 2000-01-04. Completion date: 2001-12-31.
$300,000 with Navy for Other Research and Development -- Basic Research (R&D). Signed on 2003-08-28. Completion date: 2004-10-17.
$300,000 with Navy for Defense Electronics and Communication Equipment -- Applied Research and Exploratory Development (R&D). Signed on 2001-01-02. Completion date: 2003-01-31.
Top industries in this zip code by the number of employees in 2005:
Real Estate and Rental and Leasing: Lessors of Residential Buildings and Dwellings (50-99 employees: 1 establishment)
Other Services (except Public Administration): Grantmaking Foundations (20-49: 1, 1-4: 1)
Information: Teleproduction and Other Postproduction Services (20-49: 1)
Accommodation and Food Services: Full-Service Restaurants (20-49: 1)
Information: Motion Picture and Video Production (20-49: 1)
Professional, Scientific, and Technical Services: Research and Development in the Physical, Engineering, and Life Sciences (10-19: 1)
Construction: Other Building Finishing Contractors (10-19: 1)
Construction: Residential Remodelers (10-19: 1)
Wholesale Trade: Other Farm Product Raw Material Merchant Wholesalers (5-9: 1)
Accommodation and Food Services: Food Service Contractors (1-4: 2)
Fatal accident statistics in 2013:
Fatal accident count: 1
Vehicles involved in fatal accidents: 1
Fatal accidents caused by drunken drivers: 1
Fatalities: 1
Persons involved in fatal accidents: 1
Pedestrians involved in fatal accidents: 0
Fatal accident statistics in 2012:
Fatal accident count: 1
Vehicles involved in fatal accidents: 1
Fatal accidents caused by drunken drivers: 1
Fatalities: 1
Persons involved in fatal accidents: 1
Pedestrians involved in fatal accidents: 0
Home Mortgage Disclosure Act Aggregated Statistics For Year 2009 (Based on 2 partial tracts)
B) Conventional Home Purchase Loans
C) Refinancings
D) Home Improvement Loans
F) Non-occupant Loans on < 5 Family Dwellings (A B C & D)
Number
Average Value
Number
Average Value
Number
Average Value
Number
Average Value
LOANS ORIGINATED
4
$511,852
23
$411,547
3
$258,500
11
$380,884
APPLICATIONS APPROVED, NOT ACCEPTED
1
$294,090
5
$416,288
0
$0
1
$366,520
APPLICATIONS DENIED
1
$301,900
13
$498,103
1
$459,870
4
$439,812
APPLICATIONS WITHDRAWN
1
$182,320
7
$406,797
0
$0
0
$0
FILES CLOSED FOR INCOMPLETENESS
0
$0
3
$514,507
0
$0
1
$242,270
Aggregated Statistics For Year 2008 (Based on 2 partial tracts)
B) Conventional Home Purchase Loans
C) Refinancings
D) Home Improvement Loans
F) Non-occupant Loans on < 5 Family Dwellings (A B C & D)
Number
Average Value
Number
Average Value
Number
Average Value
Number
Average Value
LOANS ORIGINATED
7
$547,109
11
$414,942
0
$0
6
$419,857
APPLICATIONS APPROVED, NOT ACCEPTED
2
$645,160
1
$744,910
1
$495,460
0
$0
APPLICATIONS DENIED
1
$857,930
6
$586,052
1
$338,740
2
$347,320
APPLICATIONS WITHDRAWN
2
$412,105
3
$489,427
0
$0
1
$259,130
FILES CLOSED FOR INCOMPLETENESS
1
$215,420
1
$1,798,580
0
$0
1
$615,350
Aggregated Statistics For Year 2007 (Based on 2 partial tracts)
B) Conventional Home Purchase Loans
C) Refinancings
D) Home Improvement Loans
F) Non-occupant Loans on < 5 Family Dwellings (A B C & D)
Number
Average Value
Number
Average Value
Number
Average Value
Number
Average Value
LOANS ORIGINATED
6
$544,425
16
$589,688
2
$493,120
8
$579,092
APPLICATIONS APPROVED, NOT ACCEPTED
2
$658,430
3
$549,473
0
$0
3
$497,023
APPLICATIONS DENIED
1
$664,990
7
$600,539
1
$502,640
2
$523,870
APPLICATIONS WITHDRAWN
1
$350,290
3
$446,653
1
$119,880
2
$380,570
FILES CLOSED FOR INCOMPLETENESS
1
$288,780
1
$283,790
0
$0
1
$476,100
Aggregated Statistics For Year 2006 (Based on 2 partial tracts)
B) Conventional Home Purchase Loans
C) Refinancings
D) Home Improvement Loans
F) Non-occupant Loans on < 5 Family Dwellings (A B C & D)
G) Loans On Manufactured Home Dwelling (A B C & D)
Number
Average Value
Number
Average Value
Number
Average Value
Number
Average Value
Number
Average Value
LOANS ORIGINATED
10
$587,748
23
$569,317
2
$519,030
11
$513,455
0
$0
APPLICATIONS APPROVED, NOT ACCEPTED
3
$608,997
3
$449,257
1
$234,150
3
$477,353
0
$0
APPLICATIONS DENIED
1
$671,540
7
$554,289
2
$284,880
3
$449,777
1
$112,390
APPLICATIONS WITHDRAWN
2
$643,445
4
$486,252
0
$0
2
$378,385
0
$0
FILES CLOSED FOR INCOMPLETENESS
1
$95,220
1
$217,920
0
$0
0
$0
0
$0
Aggregated Statistics For Year 2005 (Based on 2 partial tracts)
B) Conventional Home Purchase Loans
C) Refinancings
D) Home Improvement Loans
F) Non-occupant Loans on < 5 Family Dwellings (A B C & D)
G) Loans On Manufactured Home Dwelling (A B C & D)
Number
Average Value
Number
Average Value
Number
Average Value
Number
Average Value
Number
Average Value
LOANS ORIGINATED
13
$728,075
33
$537,788
2
$365,585
14
$478,379
1
$248,510
APPLICATIONS APPROVED, NOT ACCEPTED
2
$803,760
5
$438,392
0
$0
2
$512,475
0
$0
APPLICATIONS DENIED
5
$554,342
7
$448,409
2
$363,400
3
$452,690
0
$0
APPLICATIONS WITHDRAWN
1
$623,460
8
$491,325
1
$753,960
2
$819,055
0
$0
FILES CLOSED FOR INCOMPLETENESS
1
$285,350
2
$370,735
0
$0
0
$0
0
$0
Aggregated Statistics For Year 2004 (Based on 2 partial tracts)
B) Conventional Home Purchase Loans
C) Refinancings
D) Home Improvement Loans
F) Non-occupant Loans on < 5 Family Dwellings (A B C & D)
G) Loans On Manufactured Home Dwelling (A B C & D)
Number
Average Value
Number
Average Value
Number
Average Value
Number
Average Value
Number
Average Value
LOANS ORIGINATED
17
$600,361
40
$429,860
3
$244,350
18
$439,179
0
$0
APPLICATIONS APPROVED, NOT ACCEPTED
4
$553,920
5
$274,612
0
$0
2
$447,070
1
$49,950
APPLICATIONS DENIED
2
$598,330
8
$503,189
1
$161,720
2
$280,045
0
$0
APPLICATIONS WITHDRAWN
3
$543,540
7
$391,766
0
$0
2
$497,960
0
$0
FILES CLOSED FOR INCOMPLETENESS
1
$701,510
2
$449,880
0
$0
1
$671,230
0
$0
Aggregated Statistics For Year 2003 (Based on 2 partial tracts)
B) Conventional Home Purchase Loans
C) Refinancings
D) Home Improvement Loans
F) Non-occupant Loans on < 5 Family Dwellings (A B C & D)
Number
Average Value
Number
Average Value
Number
Average Value
Number
Average Value
LOANS ORIGINATED
14
$449,836
95
$366,694
1
$103,340
25
$321,454
APPLICATIONS APPROVED, NOT ACCEPTED
2
$673,105
7
$319,559
0
$0
1
$281,920
APPLICATIONS DENIED
5
$416,100
13
$390,274
0
$0
5
$422,718
APPLICATIONS WITHDRAWN
3
$668,733
12
$281,136
0
$0
3
$392,957
FILES CLOSED FOR INCOMPLETENESS
0
$0
1
$646,250
0
$0
0
$0
Aggregated Statistics For Year 2002 (Based on 2 partial tracts)
B) Conventional Home Purchase Loans
C) Refinancings
D) Home Improvement Loans
F) Non-occupant Loans on < 5 Family Dwellings (A B C & D)
Number
Average Value
Number
Average Value
Number
Average Value
Number
Average Value
LOANS ORIGINATED
12
$380,910
56
$351,621
1
$544,790
14
$304,841
APPLICATIONS APPROVED, NOT ACCEPTED
2
$673,730
11
$373,391
0
$0
1
$326,560
APPLICATIONS DENIED
2
$568,830
7
$377,227
0
$0
1
$273,170
APPLICATIONS WITHDRAWN
2
$475,480
7
$457,194
0
$0
2
$211,985
FILES CLOSED FOR INCOMPLETENESS
0
$0
2
$643,910
0
$0
0
$0
Aggregated Statistics For Year 2001 (Based on 2 partial tracts)
B) Conventional Home Purchase Loans
C) Refinancings
D) Home Improvement Loans
F) Non-occupant Loans on < 5 Family Dwellings (A B C & D)
Number
Average Value
Number
Average Value
Number
Average Value
Number
Average Value
LOANS ORIGINATED
9
$406,416
36
$337,809
3
$80,027
11
$252,399
APPLICATIONS APPROVED, NOT ACCEPTED
3
$295,030
6
$416,267
1
$20,290
2
$190,130
APPLICATIONS DENIED
2
$300,960
10
$338,737
1
$56,510
0
$0
APPLICATIONS WITHDRAWN
1
$425,220
5
$301,024
0
$0
1
$169,210
FILES CLOSED FOR INCOMPLETENESS
0
$0
3
$349,353
0
$0
1
$123,320
Aggregated Statistics For Year 2000 (Based on 2 partial tracts)
B) Conventional Home Purchase Loans
C) Refinancings
D) Home Improvement Loans
F) Non-occupant Loans on < 5 Family Dwellings (A B C & D)
Number
Average Value
Number
Average Value
Number
Average Value
Number
Average Value
LOANS ORIGINATED
14
$409,517
9
$285,767
2
$73,680
4
$482,660
APPLICATIONS APPROVED, NOT ACCEPTED
3
$434,270
2
$258,970
1
$187,320
1
$495,770
APPLICATIONS DENIED
4
$601,765
5
$373,890
1
$87,420
2
$684,340
APPLICATIONS WITHDRAWN
4
$510,212
4
$224,862
0
$0
1
$156,100
FILES CLOSED FOR INCOMPLETENESS
1
$140,490
1
$86,790
0
$0
0
$0
Aggregated Statistics For Year 1999 (Based on 1 partial tract)
B) Conventional Home Purchase Loans
C) Refinancings
D) Home Improvement Loans
F) Non-occupant Loans on < 5 Family Dwellings (A B C & D)


 Nearest zip codes: 94947, 94963, 94933, 94938, 94973, 94950.


