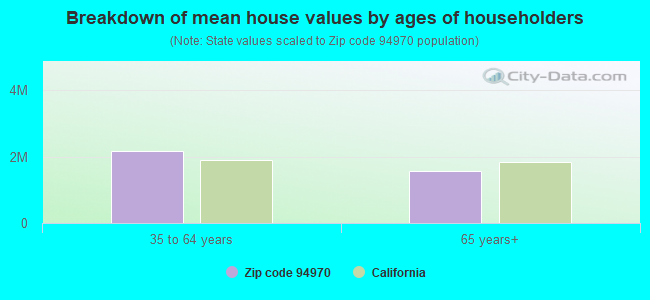
Estimated median house/condo value in 2022: $1,866,357
94970:
$1,866,357
California:
$715,900
Median resident age:
This zip code:
64.5 years
California median age:
37.9 years
Average household size:
This zip code:
1.6 people
California:
2.8 people
Averages for the 2004 tax year for zip code 94970, filed in 2005:
Average Adjusted Gross Income (AGI) in 2004: $75,278 (Individual Income Tax Returns)
Here:
$75,278
State:
$58,600
Salary/wage: $49,231 (reported on 63.5% of returns)
Here:
$49,231
State:
$49,455
(% of AGI for various income ranges: 75.1% for AGIs below $10k, 54.5% for AGIs $10k-25k, 66.1% for AGIs $25k-50k, 64.7% for AGIs $50k-75k, 53.1% for AGIs $75k-100k, 32.7% for AGIs over 100k)
Taxable interest for individuals: $3,763 (reported on 63.0% of returns)
This zip code:
$3,763
California:
$2,365
(% of AGI for various income ranges: 19.5% for AGIs below $10k, 4.3% for AGIs $10k-25k, 4.6% for AGIs $25k-50k, 3.5% for AGIs $50k-75k, 2.4% for AGIs $75k-100k, 2.8% for AGIs over 100k)
Taxable dividends: $7,235 (reported on 45.3% of returns)
Here:
$7,235
State:
$4,746
(% of AGI for various income ranges: 40.0% for AGIs below $10k, 5.5% for AGIs $10k-25k, 3.0% for AGIs $25k-50k, 4.0% for AGIs $50k-75k, 3.9% for AGIs $75k-100k, 4.2% for AGIs over 100k)
Net capital gain/loss: +$23,031 (reported on 40.5% of returns)
Here:
+$23,031
State:
+$23,418
(% of AGI for various income ranges: -13.7% for AGIs below $10k, -1.2% for AGIs $10k-25k, -1.0% for AGIs $25k-50k, 0.0% for AGIs $50k-75k, 1.7% for AGIs $75k-100k, 18.1% for AGIs over 100k)
Profit/loss from business: +$36,377 (reported on 28.9% of returns)
Here:
+$36,377
State:
+$16,826
(% of AGI for various income ranges: 39.0% for AGIs below $10k, 20.4% for AGIs $10k-25k, 11.8% for AGIs $25k-50k, 9.8% for AGIs $50k-75k, 12.3% for AGIs $75k-100k, 14.4% for AGIs over 100k)
IRA payment deduction: $4,000 (reported on 4.3% of returns)
94970:
$4,000
California:
$3,192
Self-employed pension: $26,118 (reported on 4.3% of returns)
Here:
$26,118
California:
$17,688
Total itemized deductions: $36,312 (25% of AGI, reported on 43.8% of returns)
Here:
$36,312
State:
$28,113
Here:
25.5% of AGI
State:
25.3% of AGI
(% of AGI for various income ranges: 40.8% for AGIs $10k-25k, 15.4% for AGIs $25k-50k, 23.8% for AGIs $50k-75k, 19.9% for AGIs $75k-100k, 20.8% for AGIs over 100k)
Charity contributions deductions: $5,157 (3% of AGI, reported on 40.3% of returns)
Here:
$5,157
State:
$3,923
Here:
3.5% of AGI
State:
3.3% of AGI
(% of AGI for various income ranges: 15.6% for AGIs below $10k, 0.9% for AGIs $25k-50k, 1.9% for AGIs $50k-75k, 1.2% for AGIs $75k-100k, 3.3% for AGIs over 100k)
Total tax: $15,275 (reported on 81.0% of returns)
94970:
$15,275
State:
$10,761
(% of AGI for various income ranges: 7.3% for AGIs below $10k, 7.8% for AGIs $10k-25k, 10.1% for AGIs $25k-50k, 9.8% for AGIs $50k-75k, 12.2% for AGIs $75k-100k, 19.2% for AGIs over 100k)
Earned income credit: $417 (reported on 6.1% of returns)
Here:
$417
State:
$1,763
Percentage of individuals using paid preparers for their 2004 taxes: 67.1%
Here:
67%
State:
66%
(% for various income ranges: 56.5% for AGIs below $10k, 64.2% for AGIs $10k-25k, 57.1% for AGIs $25k-50k, 70.5% for AGIs $50k-75k, 64.3% for AGIs $75k-100k, 88.5% for AGIs over 100k)
Likely homosexual households (counted as self-reported same-sex unmarried-partner households)
Lesbian couples: 3.5% of all households
Gay men: 0.0% of all households
Household received Food Stamps/SNAP in the past 12 months: 0 Household did not receive Food Stamps/SNAP in the past 12 months: 225
Women who did not have a birth in the past 12 months: 6 (0 now married, 7 unmarried)
Housing units in zip code 94970 with a mortgage: 51 (3 second mortgage, 3 both second mortgage and home equity loan) Median monthly owner costs for units with a mortgage: $2,058 Median monthly owner costs for units without a mortgage: $887
Residents with income below the poverty level in 2022:
This zip code:
4.1%
Whole state:
12.2%
Residents with income below 50% of the poverty level in 2022:
This zip code:
4.1%
Whole state:
6.2%
Median number of rooms in houses and condos:
Here:
4.8
State:
6.0
Median number of rooms in apartments:
Here:
3.0
State:
3.9
Notable locations in this zip code not listed on our city pages
Notable locations in zip code 94970: Bare Nose (A), Stinson Beach Branch Marin County Free Library (B), Stinson Beach Fire Protection District (C). Display/hide their locations on the map
In group quarters: 20 (-1 institutionalized population)
Size of family households: 59 2-persons, 6 3-persons, 7 4-persons
Size of nonfamily households: 103 1-person, 59 2-persons
6 married couples with children.
0 single-parent households ().
87.7% of residents of 94970 zip code speak English at home.
13.4% of residents speak Spanish at home (64% very well, 36% not well).
Foreign born population: 77 (19.5%) (74.4% of them are naturalized citizens)
This zip code:
19.5%
Whole state:
26.7%
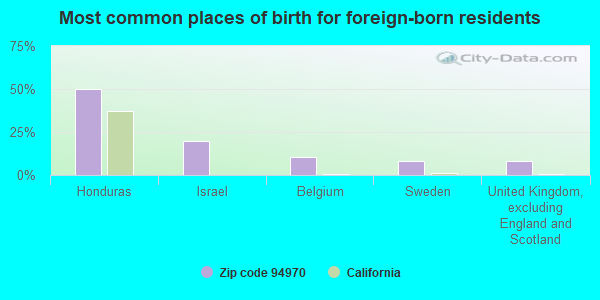
50%Honduras
20%Israel
11%Belgium
8%Sweden
8%United Kingdom, excluding England and Scotland
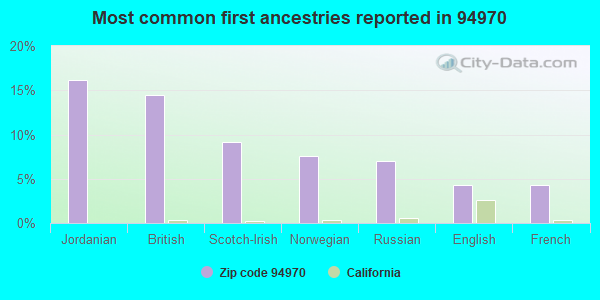
16%Jordanian
15%British
9%Scotch-Irish
8%Norwegian
7%Russian
4%English
4%French
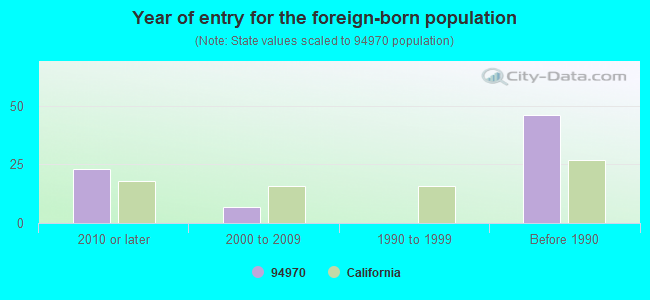
Year of entry for the foreign-born population
232010 or later
72000 to 2009
01990 to 1999
46Before 1990
Facilities with environmental interests located in this zip code:
NPS PRNS - BEACHES (HIGHWAY 1 in STINSON BEACH, CA) . Federal Facility. NATIONAL PARK SERVICE
Small Quantity Generators, between 100 kg and 1000 kg of hazardous waste/month (Resource Conservation and Recovery Act (tracking hazardous waste)) - notification COMMUNITY WATER SYSTEM (SDWIS) Organizations: DEPARTMENT OF THE INTERIOR (CONTACT/OWNER)
Alternative names: NATIONAL PARK STINSON BEACH
CALTRANS HWY 1 (BOLINAS LAGOON AND HWY 1 in STINSON BEACH, CA)
Small Quantity Generators, between 100 kg and 1000 kg of hazardous waste/month (Resource Conservation and Recovery Act (tracking hazardous waste))
Housing units lacking complete plumbing facilities: 2.4% Housing units lacking complete kitchen facilities: 2.3%
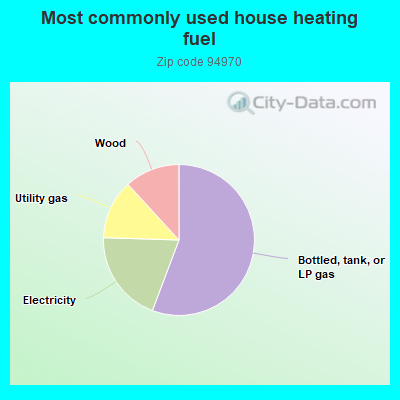
56.2%Bottled, tank, or LP gas
19.9%Electricity
12.8%Utility gas
11.9%Wood
Population in 1990: 630. Population change in the 1990s: +142 (+22.5%).
Place of birth for U.S.-born residents:
This state: 113
Northeast: 123
Midwest: 53
West: 25
63% of the 94970 zip code residents lived in the same house 5 years ago. Out of people who lived in different houses, 50% lived in this county. Out of people who lived in different counties, 50% lived in California.
96% of the 94970 zip code residents lived in the same house 1 year ago. Out of people who lived in different houses, 100% moved from this county.
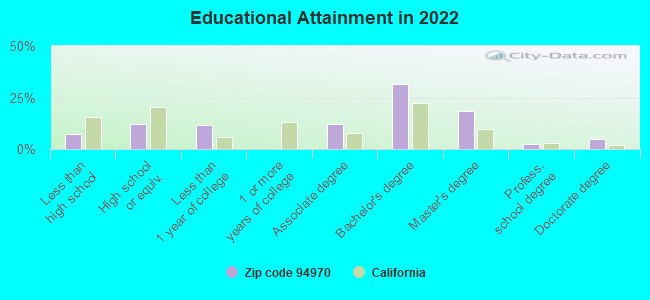
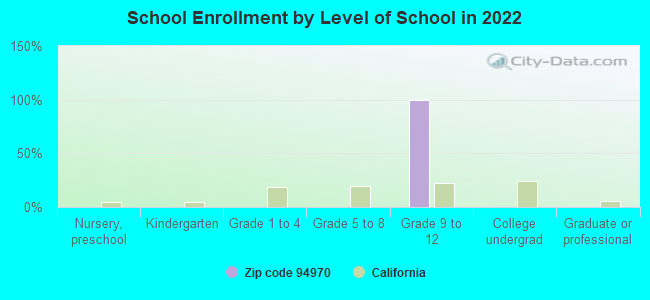
Students in private schools in grades 9 to 12 (high school):
Here:
0.0%
California:
8.5%
Top industries in this zip code by the number of employees in 2005:
Professional, Scientific, and Technical Services: Research and Development in the Physical, Engineering, and Life Sciences (100-249 employees: 1 establishment)
Construction: New Single-Family Housing Construction (except Operative Builders) (10-19: 1, 1-4: 1)
Health Care and Social Assistance: Freestanding Ambulatory Surgical and Emergency Centers (10-19: 1, 1-4: 1)
Arts, Entertainment, and Recreation: Nature Parks and Other Similar Institutions (10-19: 1)
Accommodation and Food Services: Hotels (except Casino Hotels) and Motels (5-9: 1, 1-4: 1)
Other Services (except Public Administration): Other Similar Organizations (except Business, Professional, Labor, and Political Organizations) (5-9: 1)
Real Estate and Rental and Leasing: Video Tape and Disc Rental (5-9: 1)
Real Estate and Rental and Leasing: Offices of Real Estate Agents and Brokers (1-4: 3)
People in group quarters in 2010:
4 people in workers' group living quarters and job corps centers
3 people in other noninstitutional facilities
People in group quarters in 2000:
21 people in other workers' dormitories
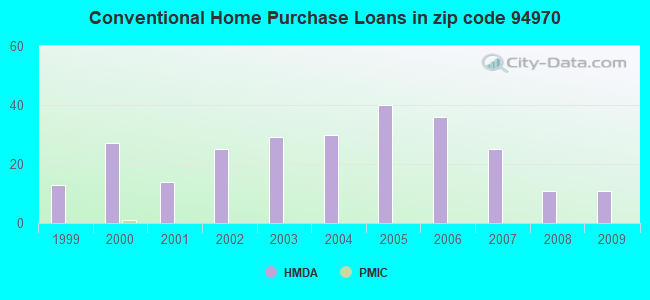
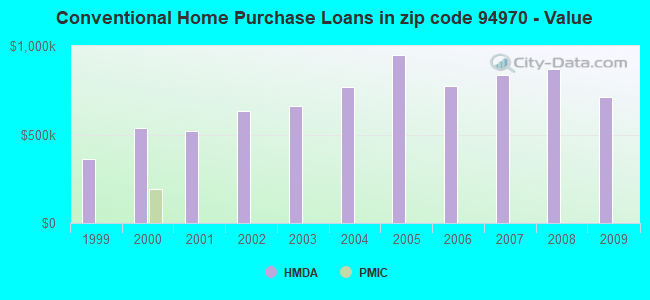
Home Mortgage Disclosure Act Aggregated Statistics For Year 2009 (Based on 2 partial tracts)
A) FHA, FSA/RHS & VA Home Purchase Loans
B) Conventional Home Purchase Loans
C) Refinancings
D) Home Improvement Loans
F) Non-occupant Loans on < 5 Family Dwellings (A B C & D)
Number
Average Value
Number
Average Value
Number
Average Value
Number
Average Value
Number
Average Value
LOANS ORIGINATED
0
$0
11
$711,635
78
$484,550
1
$588,850
39
$620,833
APPLICATIONS APPROVED, NOT ACCEPTED
0
$0
1
$338,690
11
$428,842
1
$32,490
3
$533,887
APPLICATIONS DENIED
0
$0
3
$482,447
18
$465,616
2
$338,685
6
$409,213
APPLICATIONS WITHDRAWN
1
$259,090
1
$1,218,300
9
$472,610
2
$85,280
7
$474,904
FILES CLOSED FOR INCOMPLETENESS
0
$0
1
$747,220
2
$635,545
0
$0
1
$1,055,860
Aggregated Statistics For Year 2008 (Based on 2 partial tracts)
B) Conventional Home Purchase Loans
C) Refinancings
D) Home Improvement Loans
E) Loans on Dwellings For 5+ Families
F) Non-occupant Loans on < 5 Family Dwellings (A B C & D)
Number
Average Value
Number
Average Value
Number
Average Value
Number
Average Value
Number
Average Value
LOANS ORIGINATED
11
$870,087
26
$667,410
3
$551,483
1
$365,490
20
$806,555
APPLICATIONS APPROVED, NOT ACCEPTED
2
$845,095
5
$697,680
0
$0
0
$0
2
$1,066,825
APPLICATIONS DENIED
6
$537,812
14
$601,318
0
$0
1
$1,096,470
6
$596,290
APPLICATIONS WITHDRAWN
3
$1,650,390
4
$753,315
1
$747,220
0
$0
4
$1,316,982
FILES CLOSED FOR INCOMPLETENESS
0
$0
2
$682,655
0
$0
0
$0
0
$0
Aggregated Statistics For Year 2007 (Based on 2 partial tracts)
B) Conventional Home Purchase Loans
C) Refinancings
D) Home Improvement Loans
E) Loans on Dwellings For 5+ Families
F) Non-occupant Loans on < 5 Family Dwellings (A B C & D)
Number
Average Value
Number
Average Value
Number
Average Value
Number
Average Value
Number
Average Value
LOANS ORIGINATED
25
$834,389
41
$599,106
4
$761,842
1
$730,980
27
$891,404
APPLICATIONS APPROVED, NOT ACCEPTED
6
$787,293
11
$704,473
0
$0
0
$0
10
$879,775
APPLICATIONS DENIED
4
$553,515
17
$547,279
1
$90,150
0
$0
8
$537,676
APPLICATIONS WITHDRAWN
3
$596,967
4
$521,028
0
$0
0
$0
3
$664,920
FILES CLOSED FOR INCOMPLETENESS
0
$0
2
$414,220
0
$0
0
$0
1
$97,460
Aggregated Statistics For Year 2006 (Based on 2 partial tracts)
B) Conventional Home Purchase Loans
C) Refinancings
D) Home Improvement Loans
F) Non-occupant Loans on < 5 Family Dwellings (A B C & D)
Number
Average Value
Number
Average Value
Number
Average Value
Number
Average Value
LOANS ORIGINATED
36
$773,147
51
$720,119
6
$408,672
46
$821,222
APPLICATIONS APPROVED, NOT ACCEPTED
4
$469,045
6
$601,028
2
$345,185
7
$532,919
APPLICATIONS DENIED
6
$852,810
24
$678,796
2
$146,195
8
$544,885
APPLICATIONS WITHDRAWN
6
$746,005
15
$627,127
3
$446,170
8
$641,029
FILES CLOSED FOR INCOMPLETENESS
3
$525,223
2
$699,710
0
$0
2
$688,340
Aggregated Statistics For Year 2005 (Based on 2 partial tracts)
B) Conventional Home Purchase Loans
C) Refinancings
D) Home Improvement Loans
F) Non-occupant Loans on < 5 Family Dwellings (A B C & D)
Number
Average Value
Number
Average Value
Number
Average Value
Number
Average Value
LOANS ORIGINATED
40
$950,578
81
$493,116
6
$392,970
43
$706,671
APPLICATIONS APPROVED, NOT ACCEPTED
6
$1,222,497
11
$628,569
0
$0
5
$880,912
APPLICATIONS DENIED
14
$663,857
28
$640,971
1
$487,320
15
$577,907
APPLICATIONS WITHDRAWN
2
$791,085
15
$443,895
1
$787,020
4
$475,745
FILES CLOSED FOR INCOMPLETENESS
0
$0
2
$420,315
0
$0
1
$475,140
Aggregated Statistics For Year 2004 (Based on 2 partial tracts)
B) Conventional Home Purchase Loans
C) Refinancings
D) Home Improvement Loans
F) Non-occupant Loans on < 5 Family Dwellings (A B C & D)
Number
Average Value
Number
Average Value
Number
Average Value
Number
Average Value
LOANS ORIGINATED
30
$768,477
91
$492,586
6
$399,332
57
$628,173
APPLICATIONS APPROVED, NOT ACCEPTED
6
$1,045,030
12
$507,083
1
$203,050
8
$824,485
APPLICATIONS DENIED
6
$1,117,723
21
$456,456
2
$180,715
15
$559,768
APPLICATIONS WITHDRAWN
5
$500,152
15
$438,317
2
$125,890
6
$438,588
FILES CLOSED FOR INCOMPLETENESS
1
$560,420
6
$406,912
0
$0
3
$529,283
Aggregated Statistics For Year 2003 (Based on 2 partial tracts)
B) Conventional Home Purchase Loans
C) Refinancings
D) Home Improvement Loans
E) Loans on Dwellings For 5+ Families
F) Non-occupant Loans on < 5 Family Dwellings (A B C & D)
Number
Average Value
Number
Average Value
Number
Average Value
Number
Average Value
Number
Average Value
LOANS ORIGINATED
29
$658,470
237
$411,583
1
$24,370
1
$459,710
86
$472,445
APPLICATIONS APPROVED, NOT ACCEPTED
1
$977,080
28
$321,196
0
$0
0
$0
10
$346,403
APPLICATIONS DENIED
6
$372,393
32
$477,751
2
$113,710
1
$458,890
10
$466,446
APPLICATIONS WITHDRAWN
2
$997,790
35
$374,447
0
$0
0
$0
11
$379,150
FILES CLOSED FOR INCOMPLETENESS
0
$0
3
$389,043
0
$0
0
$0
1
$262,340
Aggregated Statistics For Year 2002 (Based on 2 partial tracts)
B) Conventional Home Purchase Loans
C) Refinancings
D) Home Improvement Loans
E) Loans on Dwellings For 5+ Families
F) Non-occupant Loans on < 5 Family Dwellings (A B C & D)
Number
Average Value
Number
Average Value
Number
Average Value
Number
Average Value
Number
Average Value
LOANS ORIGINATED
25
$634,588
172
$451,970
2
$345,185
1
$649,760
58
$586,492
APPLICATIONS APPROVED, NOT ACCEPTED
6
$740,050
25
$424,423
2
$40,205
0
$0
10
$552,621
APPLICATIONS DENIED
2
$232,290
16
$569,961
1
$32,490
0
$0
5
$692,482
APPLICATIONS WITHDRAWN
5
$498,204
18
$515,882
1
$81,220
0
$0
2
$974,640
FILES CLOSED FOR INCOMPLETENESS
1
$347,620
5
$418,770
0
$0
0
$0
2
$426,405
Aggregated Statistics For Year 2001 (Based on 2 partial tracts)
B) Conventional Home Purchase Loans
C) Refinancings
D) Home Improvement Loans
E) Loans on Dwellings For 5+ Families
F) Non-occupant Loans on < 5 Family Dwellings (A B C & D)
Number
Average Value
Number
Average Value
Number
Average Value
Number
Average Value
Number
Average Value
LOANS ORIGINATED
14
$521,664
106
$442,810
6
$33,842
1
$600,220
37
$543,801
APPLICATIONS APPROVED, NOT ACCEPTED
0
$0
14
$411,611
1
$40,610
0
$0
5
$644,562
APPLICATIONS DENIED
1
$141,320
25
$560,386
2
$64,975
0
$0
6
$681,977
APPLICATIONS WITHDRAWN
2
$359,400
20
$571,748
1
$227,420
0
$0
6
$1,182,292
FILES CLOSED FOR INCOMPLETENESS
0
$0
4
$520,418
0
$0
0
$0
1
$226,600
Aggregated Statistics For Year 2000 (Based on 2 partial tracts)
B) Conventional Home Purchase Loans
C) Refinancings
D) Home Improvement Loans
E) Loans on Dwellings For 5+ Families
F) Non-occupant Loans on < 5 Family Dwellings (A B C & D)
Number
Average Value
Number
Average Value
Number
Average Value
Number
Average Value
Number
Average Value
LOANS ORIGINATED
27
$537,075
32
$406,709
5
$75,534
1
$328,940
16
$520,011
APPLICATIONS APPROVED, NOT ACCEPTED
4
$369,958
5
$497,066
1
$81,220
0
$0
2
$295,640
APPLICATIONS DENIED
2
$844,690
8
$426,710
0
$0
0
$0
3
$324,610
APPLICATIONS WITHDRAWN
3
$395,270
6
$348,975
2
$51,575
0
$0
3
$344,103
FILES CLOSED FOR INCOMPLETENESS
0
$0
0
$0
1
$8,120
0
$0
0
$0
Aggregated Statistics For Year 1999 (Based on 1 partial tract)
B) Conventional Home Purchase Loans
C) Refinancings
D) Home Improvement Loans
F) Non-occupant Loans on < 5 Family Dwellings (A B C & D)
Detailed HMDA statistics for the following Tracts:1321.00
Private Mortgage Insurance Companies Aggregated Statistics For Year 2000 (Based on 2 partial tracts)
A) Conventional Home Purchase Loans
B) Refinancings
C) Non-occupant Loans on < 5 Family Dwellings (A & B)
Number
Average Value
Number
Average Value
Number
Average Value
LOANS ORIGINATED
1
$190,050
1
$235,540
1
$190,050
APPLICATIONS APPROVED, NOT ACCEPTED
0
$0
0
$0
0
$0
APPLICATIONS DENIED
0
$0
0
$0
0
$0
APPLICATIONS WITHDRAWN
0
$0
0
$0
0
$0
FILES CLOSED FOR INCOMPLETENESS
0
$0
0
$0
0
$0
Detailed PMIC statistics for the following Tracts:1321.00
2005 - 2017 National Fire Incident Reporting System (NFIRS) incidents
According to the data from the years 2005 - 2017 the average number of fires per year is 9. The highest number of fires - 19 took place in 2014, and the least - 3 in 2012. The data has a decreasing trend.
When looking into fire subcategories, the most incidents belonged to: Outside Fires (46.2%), and Structure Fires (29.9%).
Fire incident types reported to NFIRS in Zip Code 94970

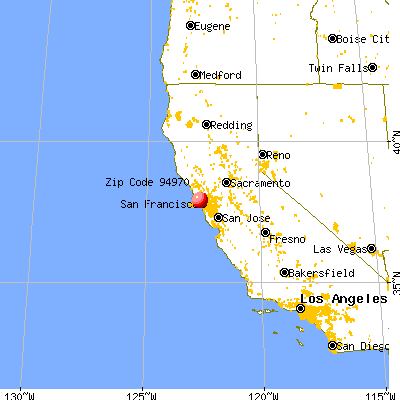


 Nearest zip codes: 94930, 94924, 94941, 94904, 94957, 94973.


 . Federal Facility. NATIONAL PARK SERVICE


 According to the data from the years 2005 - 2017 the average number of fires per year is 9. The highest number of fires - 19 took place in 2014, and the least - 3 in 2012. The data has a decreasing trend.
 When looking into fire subcategories, the most incidents belonged to: Outside Fires (46.2%), and Structure Fires (29.9%).