Estimated zip code population in 2022: 1,426 Zip code population in 2010: 1,429 Zip code population in 2000: 1,434
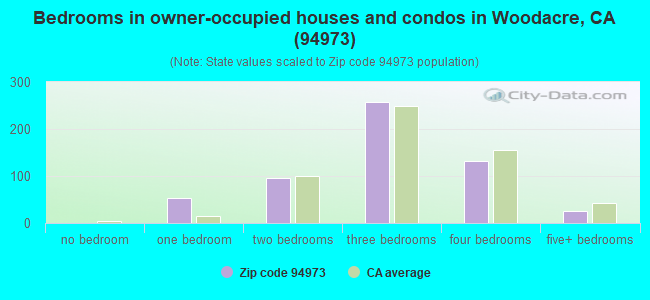
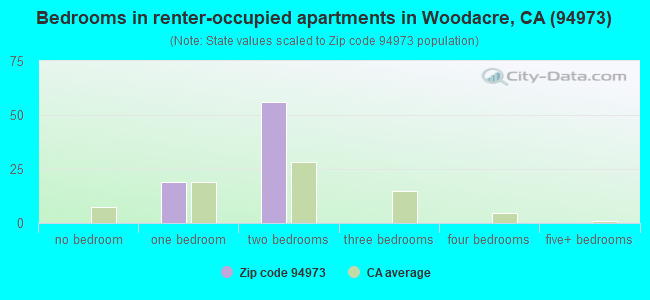
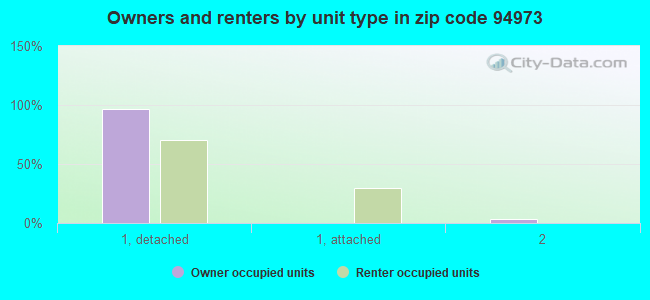
Houses and condos: 701 Renter-occupied apartments: 77
% of renters here:
12%
State:
44%
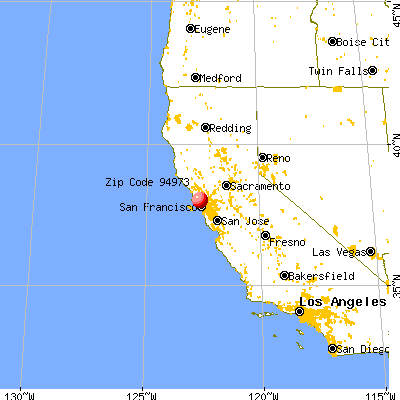
March 2022 cost of living index in zip code 94973: 128.5 (high, U.S. average is 100)
Land area: 4.0 sq. mi. Water area: 0.0 sq. mi.
Population density: 358 people per square mile
(very low).
OSM Map
General Map
Google Map
MSN Map
OSM Map
General Map
Google Map
MSN Map
OSM Map
General Map
Google Map
MSN Map
OSM Map
General Map
Google Map
MSN Map
Please wait while loading the map...
Real estate property taxes paid for housing units in 2022:
This zip code:
0.7% ($8,540)
California:
0.7% ($4,831)
Median real estate property taxes paid for housing units with mortgages in 2022: $9,224 (0.8%) Median real estate property taxes paid for housing units with no mortgage in 2022: $3,022 (0.2%)
Business Search- 14 Million verified businesses
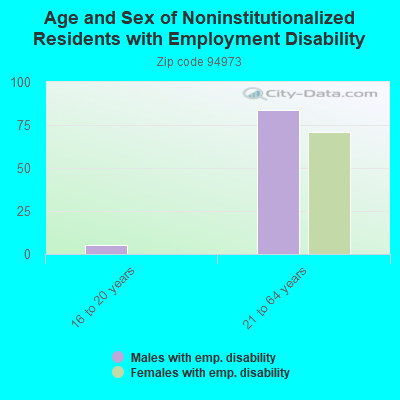
Males: 805
(56.5%)
Females: 620
(43.5%)
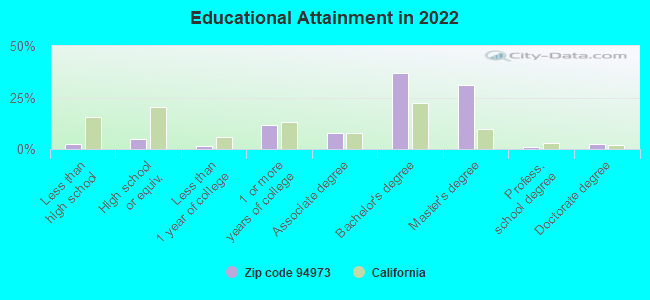
For population 25 years and over in 94973:
High school or higher: 98.4%
Bachelor's degree or higher: 72.2%
Graduate or professional degree: 34.8%
Unemployed: 4.9%
Mean travel time to work (commute): 34.7 minutes
For population 15 years and over in 94973:
Never married: 19.4%
Now married: 64.5%
Separated: 0.0%
Widowed: 6.5%
Divorced: 9.6%
Zip code 94973 compared to state average:
Median household income above state average.
Median house value above state average.
Black race population percentage significantly below state average.
Hispanic race population percentage significantly below state average.
Median age significantly above state average.
Foreign-born population percentage significantly below state average.
Renting percentage significantly below state average.
Length of stay since moving in significantly above state average.
House age above state average.
Number of college students significantly below state average.
Percentage of population with a bachelor's degree or higher significantly above state average.
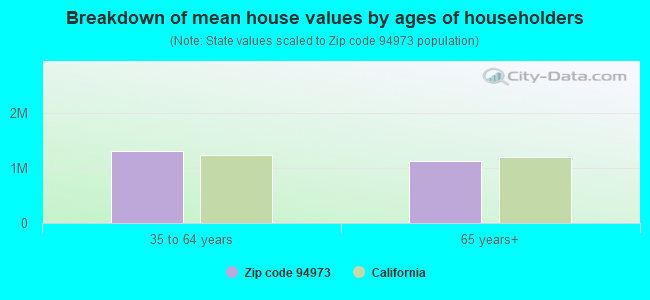
Estimated median house/condo value in 2022: $1,209,853
94973:
$1,209,853
California:
$715,900
Median resident age:
This zip code:
62.6 years
California median age:
37.9 years
Average household size:
This zip code:
2.2 people
California:
2.8 people
Averages for the 2004 tax year for zip code 94973, filed in 2005:
Average Adjusted Gross Income (AGI) in 2004: $63,628 (Individual Income Tax Returns)
Here:
$63,628
State:
$58,600
Salary/wage: $51,579 (reported on 67.3% of returns)
Here:
$51,579
State:
$49,455
(% of AGI for various income ranges: 459.7% for AGIs below $10k, 46.3% for AGIs $10k-25k, 61.7% for AGIs $25k-50k, 65.6% for AGIs $50k-75k, 69.8% for AGIs $75k-100k, 46.6% for AGIs over 100k)
Taxable interest for individuals: $1,874 (reported on 57.9% of returns)
This zip code:
$1,874
California:
$2,365
(% of AGI for various income ranges: 72.2% for AGIs below $10k, 2.0% for AGIs $10k-25k, 2.5% for AGIs $25k-50k, 1.6% for AGIs $50k-75k, 0.6% for AGIs $75k-100k, 1.6% for AGIs over 100k)
Taxable dividends: $6,502 (reported on 40.0% of returns)
Here:
$6,502
State:
$4,746
(% of AGI for various income ranges: 120.8% for AGIs below $10k, 2.8% for AGIs $10k-25k, 3.5% for AGIs $25k-50k, 1.4% for AGIs $50k-75k, 0.9% for AGIs $75k-100k, 5.3% for AGIs over 100k)
Net capital gain/loss: +$12,845 (reported on 31.5% of returns)
Here:
+$12,845
State:
+$23,418
(% of AGI for various income ranges: -36.1% for AGIs below $10k, -0.9% for AGIs $10k-25k, 0.3% for AGIs $25k-50k, -0.5% for AGIs $50k-75k, 1.7% for AGIs $75k-100k, 11.0% for AGIs over 100k)
Profit/loss from business: +$20,729 (reported on 38.3% of returns)
Here:
+$20,729
State:
+$16,826
(% of AGI for various income ranges: 262.5% for AGIs below $10k, 36.7% for AGIs $10k-25k, 15.4% for AGIs $25k-50k, 19.3% for AGIs $50k-75k, 19.3% for AGIs $75k-100k, 6.1% for AGIs over 100k)
IRA payment deduction: $3,390 (reported on 5.1% of returns)
94973:
$3,390
California:
$3,192
Self-employed pension: $14,465 (reported on 5.4% of returns)
Here:
$14,465
California:
$17,688
Total itemized deductions: $28,549 (28% of AGI, reported on 52.0% of returns)
Here:
$28,549
State:
$28,113
Here:
28.3% of AGI
State:
25.3% of AGI
(% of AGI for various income ranges: 490.3% for AGIs below $10k, 32.4% for AGIs $10k-25k, 23.9% for AGIs $25k-50k, 24.6% for AGIs $50k-75k, 25.6% for AGIs $75k-100k, 20.5% for AGIs over 100k)
Charity contributions deductions: $4,020 (4% of AGI, reported on 44.9% of returns)
Here:
$4,020
State:
$3,923
Here:
3.7% of AGI
State:
3.3% of AGI
(% of AGI for various income ranges: 18.1% for AGIs below $10k, 1.2% for AGIs $10k-25k, 1.7% for AGIs $25k-50k, 1.7% for AGIs $50k-75k, 1.3% for AGIs $75k-100k, 3.8% for AGIs over 100k)
Total tax: $11,481 (reported on 84.6% of returns)
94973:
$11,481
State:
$10,761
(% of AGI for various income ranges: 69.4% for AGIs below $10k, 9.0% for AGIs $10k-25k, 9.5% for AGIs $25k-50k, 12.3% for AGIs $50k-75k, 12.0% for AGIs $75k-100k, 18.3% for AGIs over 100k)
Earned income credit: $1,138 (reported on 8.1% of returns)
Here:
$1,138
State:
$1,763
Percentage of individuals using paid preparers for their 2004 taxes: 66.8%
Here:
67%
State:
66%
(% for various income ranges: 60.2% for AGIs below $10k, 63.0% for AGIs $10k-25k, 58.3% for AGIs $25k-50k, 72.3% for AGIs $50k-75k, 74.3% for AGIs $75k-100k, 80.0% for AGIs over 100k)
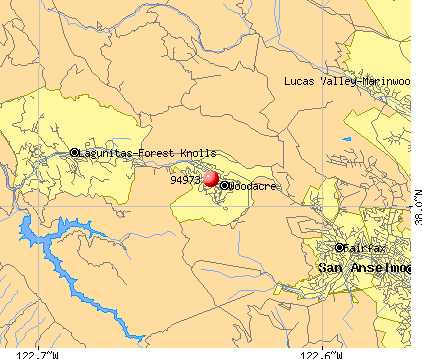
Notable locations in zip code 94973: San Geronimo National Golf Course (A), Marin County Fire Department Woodacre (B). Display/hide their locations on the map
In group quarters: 13 (-1 institutionalized population)
Size of family households: 242 2-persons, 82 3-persons, 83 4-persons, 18 5-persons
Size of nonfamily households: 166 1-person, 46 2-persons
72 married couples with children.
24 single-parent households (24 women).
95.8% of residents of 94973 zip code speak English at home.
3.2% of residents speak Spanish at home (100% very well).
1.4% of residents speak other Indo-European language at home (100% well).
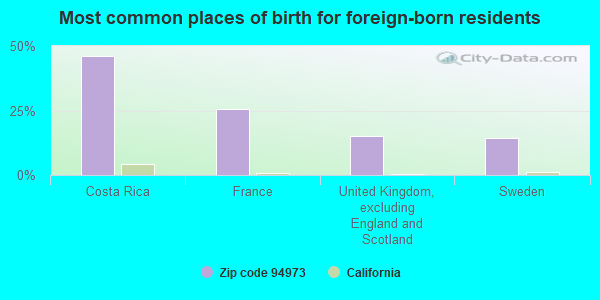
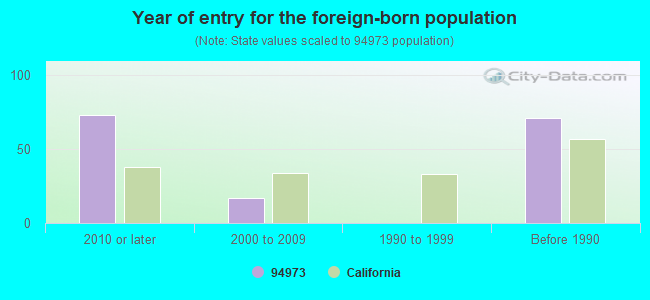
Foreign born population: 94 (6.6%) (51.0% of them are naturalized citizens)
This zip code:
6.6%
Whole state:
26.7%
49%France
28%Sweden
28%United Kingdom, excluding England and Scotland
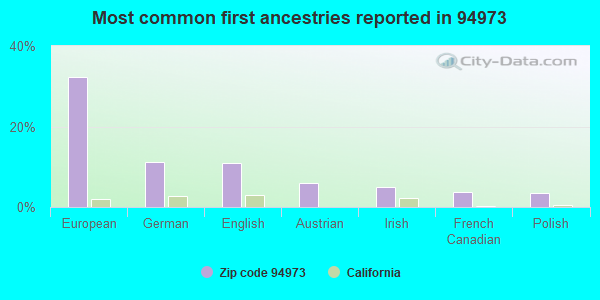
29%European
14%English
14%German
6%Austrian
4%Polish
3%Norwegian
3%Russian
Year of entry for the foreign-born population
732010 or later
172000 to 2009
01990 to 1999
71Before 1990
Housing units lacking complete plumbing facilities: 3.3% Housing units lacking complete kitchen facilities: 2.7%
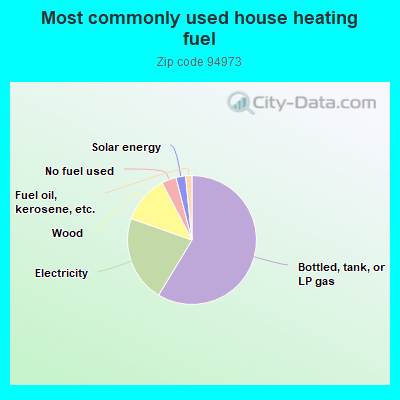
58.9%Bottled, tank, or LP gas
21.8%Electricity
12.0%Wood
3.7%No fuel used
2.4%Solar energy
1.6%Fuel oil, kerosene, etc.
Population in 1990: 1,524.
Place of birth for U.S.-born residents:
This state: 659
Northeast: 317
Midwest: 175
South: 49
West: 56
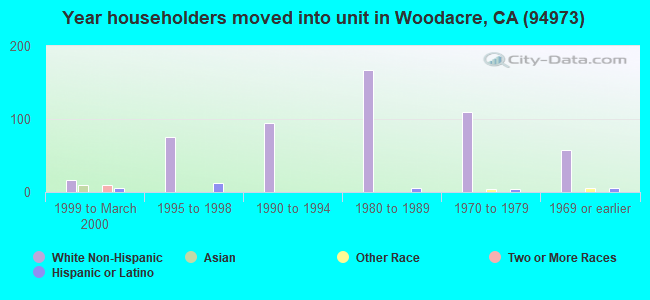
74% of the 94973 zip code residents lived in the same house 5 years ago. Out of people who lived in different houses, 59% lived in this county. Out of people who lived in different counties, 50% lived in California.
88% of the 94973 zip code residents lived in the same house 1 year ago. Out of people who lived in different houses, 33% moved from this county. Out of people who lived in different houses, 30% moved from different county within same state. Out of people who lived in different houses, 24% moved from different state. Out of people who lived in different houses, 14% moved from abroad.
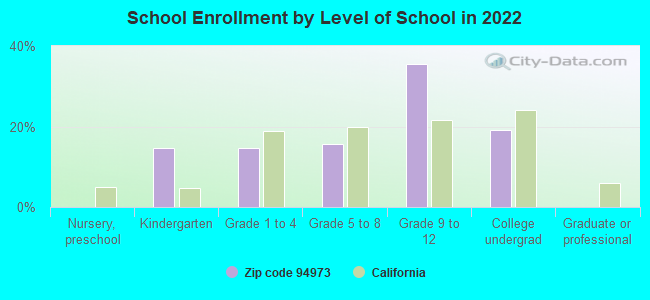
Private vs. public school enrollment:
Students in private schools in grades 1 to 8 (elementary and middle school):
Here:
0.0%
California:
10.5%
Students in private schools in grades 9 to 12 (high school):
Here:
0.0%
California:
8.5%
Students in private undergraduate colleges:
Here:
0.0%
California:
15.9%
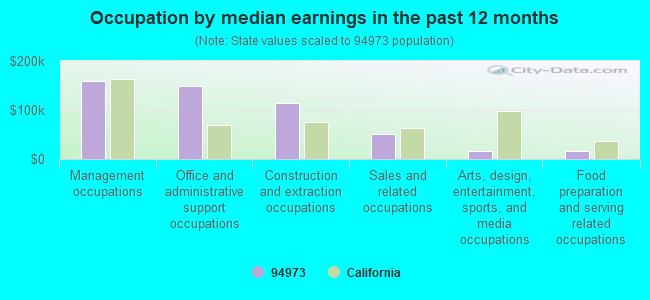
Occupation by median earnings in the past 12 months ($)
159,727Management occupations
147,984Office and administrative support occupations
114,515Construction and extraction occupations
51,028Sales and related occupations
17,075Arts, design, entertainment, sports, and media occupations
16,164Food preparation and serving related occupations
Top industries in this zip code by the number of employees in 2005:
Other Services (except Public Administration): Religious Organizations (50-99 employees: 1 establishment)
Construction: Site Preparation Contractors (10-19: 1)
Construction: Residential Remodelers (1-4: 4)
Professional, Scientific, and Technical Services: Offices of Certified Public Accountants (5-9: 1)
Administrative and Support and Waste Management and Remediation Services: Landscaping Services (1-4: 3)
Construction: New Single-Family Housing Construction (except Operative Builders) (1-4: 2)
Professional, Scientific, and Technical Services: Other Scientific and Technical Consulting Services (1-4: 2)
Construction: Commercial and Institutional Building Construction (1-4: 2)
Real Estate and Rental and Leasing: Offices of Real Estate Agents and Brokers (1-4: 1)
People in group quarters in 2010:
7 people in other noninstitutional facilities
Home Mortgage Disclosure Act Aggregated Statistics For Year 2009 (Based on 2 partial tracts)
A) FHA, FSA/RHS & VA Home Purchase Loans
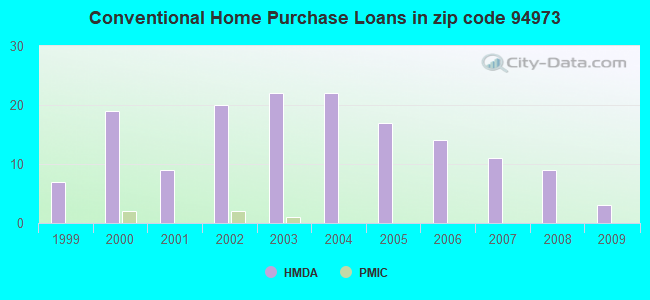
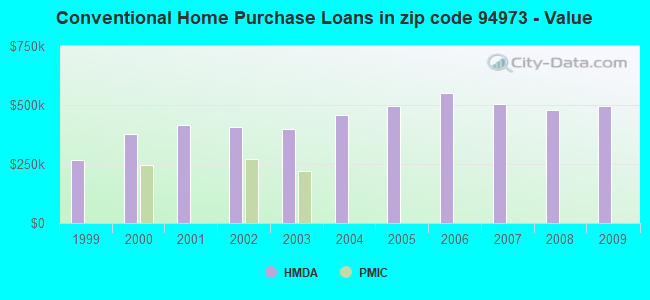
B) Conventional Home Purchase Loans
C) Refinancings
D) Home Improvement Loans
F) Non-occupant Loans on < 5 Family Dwellings (A B C & D)
Number
Average Value
Number
Average Value
Number
Average Value
Number
Average Value
Number
Average Value
LOANS ORIGINATED
1
$321,940
3
$497,763
55
$364,777
2
$224,865
5
$348,408
APPLICATIONS APPROVED, NOT ACCEPTED
0
$0
1
$557,420
8
$456,225
0
$0
1
$344,310
APPLICATIONS DENIED
0
$0
2
$371,425
21
$394,115
0
$0
1
$268,090
APPLICATIONS WITHDRAWN
0
$0
1
$293,120
6
$396,263
1
$190,740
0
$0
FILES CLOSED FOR INCOMPLETENESS
0
$0
0
$0
3
$362,767
0
$0
0
$0
Aggregated Statistics For Year 2008 (Based on 2 partial tracts)
B) Conventional Home Purchase Loans
C) Refinancings
D) Home Improvement Loans
F) Non-occupant Loans on < 5 Family Dwellings (A B C & D)
Number
Average Value
Number
Average Value
Number
Average Value
Number
Average Value
LOANS ORIGINATED
9
$480,278
25
$408,778
2
$314,925
5
$342,038
APPLICATIONS APPROVED, NOT ACCEPTED
1
$400,060
6
$383,877
1
$254,060
1
$229,420
APPLICATIONS DENIED
3
$671,183
9
$417,879
0
$0
2
$269,610
APPLICATIONS WITHDRAWN
2
$584,535
2
$322,320
0
$0
0
$0
FILES CLOSED FOR INCOMPLETENESS
0
$0
1
$450,490
0
$0
0
$0
Aggregated Statistics For Year 2007 (Based on 2 partial tracts)
B) Conventional Home Purchase Loans
C) Refinancings
D) Home Improvement Loans
F) Non-occupant Loans on < 5 Family Dwellings (A B C & D)
Number
Average Value
Number
Average Value
Number
Average Value
Number
Average Value
LOANS ORIGINATED
11
$504,646
33
$478,298
2
$404,605
3
$465,280
APPLICATIONS APPROVED, NOT ACCEPTED
3
$505,347
7
$566,633
0
$0
0
$0
APPLICATIONS DENIED
3
$549,080
16
$530,524
1
$189,600
0
$0
APPLICATIONS WITHDRAWN
3
$342,163
8
$542,019
1
$161,160
0
$0
FILES CLOSED FOR INCOMPLETENESS
0
$0
2
$385,265
0
$0
0
$0
Aggregated Statistics For Year 2006 (Based on 2 partial tracts)
B) Conventional Home Purchase Loans
C) Refinancings
D) Home Improvement Loans
F) Non-occupant Loans on < 5 Family Dwellings (A B C & D)
Number
Average Value
Number
Average Value
Number
Average Value
Number
Average Value
LOANS ORIGINATED
14
$551,438
46
$449,179
7
$238,137
4
$383,940
APPLICATIONS APPROVED, NOT ACCEPTED
6
$417,057
8
$517,987
0
$0
2
$309,050
APPLICATIONS DENIED
2
$612,410
19
$669,567
4
$439,020
1
$530,880
APPLICATIONS WITHDRAWN
3
$508,127
11
$544,773
1
$459,590
3
$471,977
FILES CLOSED FOR INCOMPLETENESS
0
$0
2
$440,250
0
$0
0
$0
Aggregated Statistics For Year 2005 (Based on 2 partial tracts)
B) Conventional Home Purchase Loans
C) Refinancings
D) Home Improvement Loans
F) Non-occupant Loans on < 5 Family Dwellings (A B C & D)
Number
Average Value
Number
Average Value
Number
Average Value
Number
Average Value
LOANS ORIGINATED
17
$497,734
61
$424,648
4
$154,335
3
$463,510
APPLICATIONS APPROVED, NOT ACCEPTED
2
$261,270
9
$474,253
0
$0
1
$189,600
APPLICATIONS DENIED
2
$676,680
14
$509,889
2
$298,620
1
$408,780
APPLICATIONS WITHDRAWN
3
$628,587
15
$391,385
2
$189,220
2
$301,655
FILES CLOSED FOR INCOMPLETENESS
1
$318,910
3
$303,740
1
$563,110
0
$0
Aggregated Statistics For Year 2004 (Based on 2 partial tracts)
B) Conventional Home Purchase Loans
C) Refinancings
D) Home Improvement Loans
E) Loans on Dwellings For 5+ Families
F) Non-occupant Loans on < 5 Family Dwellings (A B C & D)
Number
Average Value
Number
Average Value
Number
Average Value
Number
Average Value
Number
Average Value
LOANS ORIGINATED
22
$457,074
64
$374,057
5
$316,102
1
$511,160
3
$519,123
APPLICATIONS APPROVED, NOT ACCEPTED
3
$359,733
11
$401,263
1
$338,250
0
$0
1
$298,810
APPLICATIONS DENIED
8
$504,336
19
$426,101
2
$204,390
0
$0
2
$314,735
APPLICATIONS WITHDRAWN
2
$335,025
10
$389,438
2
$186,375
0
$0
1
$432,290
FILES CLOSED FOR INCOMPLETENESS
0
$0
5
$323,912
0
$0
0
$0
0
$0
Aggregated Statistics For Year 2003 (Based on 2 partial tracts)
B) Conventional Home Purchase Loans
C) Refinancings
D) Home Improvement Loans
F) Non-occupant Loans on < 5 Family Dwellings (A B C & D)
Number
Average Value
Number
Average Value
Number
Average Value
Number
Average Value
LOANS ORIGINATED
22
$399,505
154
$298,770
2
$181,635
15
$253,988
APPLICATIONS APPROVED, NOT ACCEPTED
5
$395,960
20
$305,502
0
$0
1
$120,210
APPLICATIONS DENIED
6
$319,350
25
$331,527
0
$0
3
$267,463
APPLICATIONS WITHDRAWN
2
$395,695
24
$288,240
0
$0
0
$0
FILES CLOSED FOR INCOMPLETENESS
0
$0
5
$226,762
0
$0
0
$0
Aggregated Statistics For Year 2002 (Based on 2 partial tracts)
B) Conventional Home Purchase Loans
C) Refinancings
D) Home Improvement Loans
F) Non-occupant Loans on < 5 Family Dwellings (A B C & D)
Number
Average Value
Number
Average Value
Number
Average Value
Number
Average Value
LOANS ORIGINATED
20
$406,900
118
$300,747
2
$26,165
8
$258,661
APPLICATIONS APPROVED, NOT ACCEPTED
6
$226,508
16
$281,390
0
$0
2
$252,360
APPLICATIONS DENIED
5
$255,126
19
$279,809
0
$0
3
$230,427
APPLICATIONS WITHDRAWN
4
$307,815
13
$241,288
0
$0
1
$128,930
FILES CLOSED FOR INCOMPLETENESS
1
$189,600
6
$294,322
0
$0
0
$0
Aggregated Statistics For Year 2001 (Based on 2 partial tracts)
B) Conventional Home Purchase Loans
C) Refinancings
D) Home Improvement Loans
E) Loans on Dwellings For 5+ Families
F) Non-occupant Loans on < 5 Family Dwellings (A B C & D)
Number
Average Value
Number
Average Value
Number
Average Value
Number
Average Value
Number
Average Value
LOANS ORIGINATED
9
$413,539
78
$303,287
9
$55,490
1
$151,680
4
$379,390
APPLICATIONS APPROVED, NOT ACCEPTED
2
$223,730
11
$279,160
1
$49,300
0
$0
0
$0
APPLICATIONS DENIED
4
$201,070
18
$256,002
3
$50,180
0
$0
2
$150,730
APPLICATIONS WITHDRAWN
2
$471,535
9
$287,981
1
$162,300
0
$0
0
$0
FILES CLOSED FOR INCOMPLETENESS
0
$0
3
$231,313
0
$0
0
$0
0
$0
Aggregated Statistics For Year 2000 (Based on 2 partial tracts)
B) Conventional Home Purchase Loans
C) Refinancings
D) Home Improvement Loans
F) Non-occupant Loans on < 5 Family Dwellings (A B C & D)
Number
Average Value
Number
Average Value
Number
Average Value
Number
Average Value
LOANS ORIGINATED
19
$375,448
26
$234,258
4
$53,278
3
$302,853
APPLICATIONS APPROVED, NOT ACCEPTED
5
$357,206
3
$201,357
2
$18,390
0
$0
APPLICATIONS DENIED
4
$275,015
6
$234,978
1
$66,360
0
$0
APPLICATIONS WITHDRAWN
2
$217,470
5
$161,690
0
$0
0
$0
FILES CLOSED FOR INCOMPLETENESS
0
$0
1
$296,910
0
$0
0
$0
Aggregated Statistics For Year 1999 (Based on 1 partial tract)
B) Conventional Home Purchase Loans
C) Refinancings
D) Home Improvement Loans
F) Non-occupant Loans on < 5 Family Dwellings (A B C & D)
Detailed PMIC statistics for the following Tracts:1130.00
2005 - 2018 National Fire Incident Reporting System (NFIRS) incidents
According to the data from the years 2005 - 2018 the average number of fires per year is 22. The highest number of fires - 58 took place in 2008, and the least - 7 in 2012. The data has an increasing trend.
When looking into fire subcategories, the most incidents belonged to: Outside Fires (82.7%), and Structure Fires (9.6%).
Fire incident types reported to NFIRS in Zip Code 94973


 Nearest zip codes: 94963, 94933, 94960, 94930, 94946, 94903.
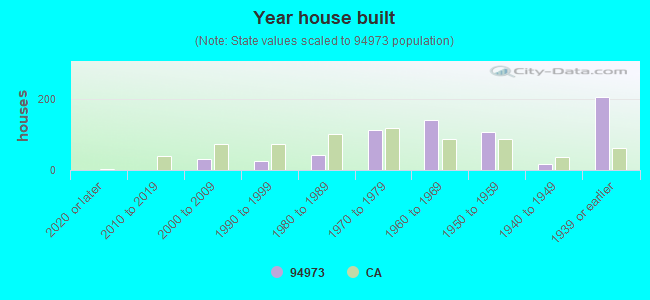


 According to the data from the years 2005 - 2018 the average number of fires per year is 22. The highest number of fires - 58 took place in 2008, and the least - 7 in 2012. The data has an increasing trend.
 When looking into fire subcategories, the most incidents belonged to: Outside Fires (82.7%), and Structure Fires (9.6%).