Estimated zip code population in 2022: 883 Zip code population in 2010: 912 Zip code population in 2000: 798
Houses and condos: 331 Renter-occupied apartments: 116
% of renters here:
36%
State:
44%
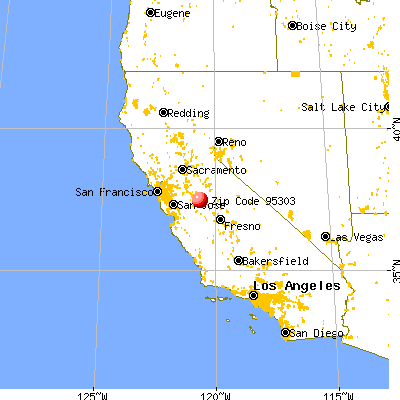
March 2022 cost of living index in zip code 95303: 94.6 (less than average, U.S. average is 100)
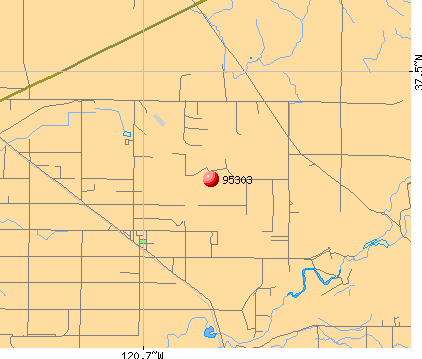
Land area: 39.0 sq. mi. Water area: 0.0 sq. mi.
Population density: 23 people per square mile
(very low).
OSM Map
General Map
Google Map
MSN Map
OSM Map
General Map
Google Map
MSN Map
OSM Map
General Map
Google Map
MSN Map
OSM Map
General Map
Google Map
MSN Map
Please wait while loading the map...
Real estate property taxes paid for housing units in 2022:
This zip code:
0.5% ($3,237)
California:
0.7% ($4,831)
Median real estate property taxes paid for housing units with mortgages in 2022: $2,678 (0.4%) Median real estate property taxes paid for housing units with no mortgage in 2022: $8,919 (0.7%)
Business Search- 14 Million verified businesses
Males: 482
(54.6%)
Females: 400
(45.4%)
For population 25 years and over in 95303:
High school or higher: 79.8%
Bachelor's degree or higher: 19.9%
Graduate or professional degree: 2.1%
Unemployed: 11.7%
Mean travel time to work (commute): 29.1 minutes
For population 15 years and over in 95303:
Never married: 33.8%
Now married: 46.0%
Separated: 0.0%
Widowed: 9.4%
Divorced: 10.8%
Zip code 95303 compared to state average:
Median household income above state average.
Unemployed percentage above state average.
Black race population percentage significantly below state average.
Median age above state average.
Length of stay since moving in significantly above state average.
Number of rooms per house above state average.
Percentage of population with a bachelor's degree or higher below state average.
Estimated median house/condo value in 2022: $691,143
95303:
$691,143
California:
$715,900
According to our research of California and other state lists, there was 1 registered sex offender living in 95303 zip code as of May 28, 2024. The ratio of all residents to sex offenders in zip code 95303 is 687 to 1. The ratio of registered sex offenders to all residents in this zip code is near the state average.
Median resident age:
This zip code:
44.1 years
California median age:
37.9 years
Average household size:
This zip code:
2.7 people
California:
2.8 people
Averages for the 2020 tax year for zip code 95303, filed in 2021:
Average Adjusted Gross Income (AGI) in 2020: $68,538 (Individual Income Tax Returns)
Here:
$68,538
State:
$95,910
Salary/wage: $50,497 (reported on 94.1% of returns)
Here:
$50,497
State:
$77,331
(% of AGI for various income ranges: 1910.0% for AGIs below $25k, 4188.6% for AGIs $25k-50k, 5271.7% for AGIs $50k-75k, 31220.0% for AGIs $100k-200k)
Taxable interest for individuals: $2,144 (reported on 26.5% of returns)
This zip code:
$2,144
California:
$2,294
(% of AGI for various income ranges: 12.9% for AGIs below $25k, 46.7% for AGIs $50k-75k, 780.0% for AGIs $100k-200k)
Ordinary dividends: $34,775 (reported on 11.8% of returns)
Here:
$34,775
State:
$10,949
(% of AGI for various income ranges: 177.1% for AGIs below $25k, 6335.0% for AGIs $100k-200k)
Net capital gain/loss in AGI: +$23,850 (reported on 11.8% of returns)
Here:
+$23,850
State:
+$49,306
(% of AGI for various income ranges: 4770.0% for AGIs $100k-200k)
Profit/loss from business: +$4,950 (reported on 11.8% of returns)
Here:
+$4,950
State:
+$15,671
(% of AGI for various income ranges: 282.9% for AGIs below $25k)
Total itemized deductions: $33,350 (reported on 5.9% of returns)
Here:
$33,350
State:
$39,517
(% of AGI for various income ranges: 952.9% for AGIs below $25k)
Earned income credit: $2,267 (reported on 17.6% of returns)
Here:
$2,267
State:
$2,074
(% of AGI for various income ranges: 127.1% for AGIs below $25k, 67.1% for AGIs $25k-50k)
Percentage of individuals using paid preparers for their 2020 taxes: 97.1%
Here:
97%
State:
92%
(% for various income ranges: 90.9% for AGIs below $25k, 100.0% for AGIs $25k-50k, 100.0% for AGIs $50k-75k, 100.0% for AGIs $75k-100k, 100.0% for AGIs $100k-200k)
Averages for the 2012 tax year for zip code 95303, filed in 2013:
Average Adjusted Gross Income (AGI) in 2012: $66,728 (Individual Income Tax Returns)
Here:
$66,728
State:
$72,726
Salary/wage: $40,806 (reported on 84.6% of returns)
Here:
$40,806
State:
$59,079
(% of AGI for various income ranges: 79.9% for AGIs below $25k, 88.7% for AGIs $25k-50k, 77.1% for AGIs $50k-75k, 62.4% for AGIs $75k-100k, 31.2% for AGIs $100k-200k)
Taxable interest for individuals: $2,020 (reported on 25.6% of returns)
This zip code:
$2,020
California:
$2,146
Ordinary dividends: $2,675 (reported on 10.3% of returns)
Here:
$2,675
State:
$9,308
Net capital gain/loss in AGI: +$31,060 (reported on 12.8% of returns)
Here:
+$31,060
State:
+$30,460
Profit/loss from business: +$6,450 (reported on 10.3% of returns)
Here:
+$6,450
State:
+$17,064
Total itemized deductions: $39,112 (20% of AGI, reported on 20.5% of returns)
Here:
$39,112
State:
$34,004
Here:
19.6% of AGI
State:
22.7% of AGI
(% of AGI for various income ranges: 21.9% for AGIs below $25k, 19.5% for AGIs $50k-75k, 15.3% for AGIs $100k-200k)
Charity contributions: $7,629 (reported on 17.9% of returns)
Here:
$7,629
State:
$4,659
Taxes paid: $15,975 (reported on 20.5% of returns)
95303:
$15,975
State:
$14,448
(% of AGI for various income ranges: 2.5% for AGIs below $25k, 4.2% for AGIs $50k-75k, 7.6% for AGIs $100k-200k)
Earned income credit: $2,225 (reported on 20.5% of returns)
Here:
$2,225
State:
$2,286
(% of AGI for various income ranges: 6.1% for AGIs below $25k, 1.3% for AGIs $25k-50k)
Percentage of individuals using paid preparers for their 2012 taxes: 74.4%
Here:
74%
State:
64%
(% for various income ranges: 64.3% for AGIs below $25k, 84.6% for AGIs $25k-50k, 75.0% for AGIs $50k-75k, 66.7% for AGIs $75k-100k, 80.0% for AGIs $100k-200k)
Averages for the 2004 tax year for zip code 95303, filed in 2005:
Average Adjusted Gross Income (AGI) in 2004: $37,287 (Individual Income Tax Returns)
Here:
$37,287
State:
$58,600
Salary/wage: $32,184 (reported on 84.5% of returns)
Here:
$32,184
State:
$49,455
(% of AGI for various income ranges: 80.3% for AGIs $10k-25k, 81.9% for AGIs $25k-50k, 76.0% for AGIs $50k-75k, 71.4% for AGIs $75k-100k, 46.2% for AGIs over 100k)
Taxable interest for individuals: $1,463 (reported on 38.5% of returns)
This zip code:
$1,463
California:
$2,365
(% of AGI for various income ranges: 0.4% for AGIs $10k-25k, 1.6% for AGIs $25k-50k, 0.7% for AGIs $50k-75k, 2.2% for AGIs over 100k)
Taxable dividends: $1,950 (reported on 17.2% of returns)
Here:
$1,950
State:
$4,746
(% of AGI for various income ranges: 0.4% for AGIs $25k-50k, 0.2% for AGIs $50k-75k, 1.3% for AGIs over 100k)
Net capital gain/loss: +$15,333 (reported on 16.4% of returns)
Here:
+$15,333
State:
+$23,418
Profit/loss from business: +$9,222 (reported on 7.8% of returns)
Here:
+$9,222
State:
+$16,826
Profit/loss from farming: +$3,306 (reported on 10.3% of returns)
Here:
+$3,306
State:
-$7,562
Total itemized deductions: $19,753 (23% of AGI, reported on 23.3% of returns)
Here:
$19,753
State:
$28,113
Here:
23.3% of AGI
State:
25.3% of AGI
(% of AGI for various income ranges: 11.6% for AGIs $10k-25k, 10.3% for AGIs $25k-50k, 17.9% for AGIs $50k-75k, 12.9% for AGIs over 100k)
Charity contributions deductions: $3,667 (4% of AGI, reported on 19.8% of returns)
Here:
$3,667
State:
$3,923
Here:
4.1% of AGI
State:
3.3% of AGI
(% of AGI for various income ranges: 0.8% for AGIs $25k-50k, 2.1% for AGIs $50k-75k, 3.6% for AGIs over 100k)
Total tax: $6,843 (reported on 60.3% of returns)
95303:
$6,843
State:
$10,761
(% of AGI for various income ranges: 3.2% for AGIs $10k-25k, 5.3% for AGIs $25k-50k, 9.0% for AGIs $50k-75k, 10.2% for AGIs $75k-100k, 19.8% for AGIs over 100k)
Earned income credit: $1,770 (reported on 25.0% of returns)
Here:
$1,770
State:
$1,763
Percentage of individuals using paid preparers for their 2004 taxes: 78.2%
Here:
78%
State:
66%
(% for various income ranges: 72.5% for AGIs below $10k, 77.3% for AGIs $10k-25k, 74.2% for AGIs $25k-50k, 112.5% for AGIs $50k-75k, 90.9% for AGIs over 100k)
Household received Food Stamps/SNAP in the past 12 months: 8 Household did not receive Food Stamps/SNAP in the past 12 months: 307
Women who did not have a birth in the past 12 months: 191 (80 now married, 110 unmarried)
Housing units in zip code 95303 with a mortgage: 140 (20 second mortgage, 16 both second mortgage and home equity loan) Median monthly owner costs for units with a mortgage: $2,223 Median monthly owner costs for units without a mortgage: $1,462
Residents with income below the poverty level in 2022:
This zip code:
14.1%
Whole state:
12.2%
Residents with income below 50% of the poverty level in 2022:
This zip code:
6.2%
Whole state:
6.2%
Median number of rooms in houses and condos:
Here:
6.9
State:
6.0
Median number of rooms in apartments:
Here:
4.5
State:
3.9
Notable locations in this zip code not listed on our city pages
Notable locations in zip code 95303: Veldhuis North Dairy (A), Merced County Fire Department Station 92 Ballico (B), Merced County Fire Department Station 64 Cressey (C). Display/hide their locations on the map
Size of family households: 69 2-persons, 68 3-persons, 47 4-persons, 31 5-persons, 11 6-persons
Size of nonfamily households: 71 1-person, 21 2-persons
110 married couples with children.
25 single-parent households (20 men, 5 women).
45.2% of residents of 95303 zip code speak English at home.
40.8% of residents speak Spanish at home (63% very well, 6% well, 17% not well, 14% not at all).
14.3% of residents speak other Indo-European language at home (83% very well, 10% well, 7% not at all).
Foreign born population: 284 (32.2%) (35.7% of them are naturalized citizens)
This zip code:
32.2%
Whole state:
26.7%
64%Honduras
19%Bhutan
12%Italy
7%Portugal
1%Denmark
1%El Salvador
7%Portuguese
6%German
3%Swiss
3%Swedish
2%Dutch
2%Irish
1%Russian
Year of entry for the foreign-born population
632010 or later
412000 to 2009
661990 to 1999
129Before 1990
Facilities with environmental interests located in this zip code:
BALLICO ELEMENTARY (11818 W. GREGG ST. in BALLICO, CA)
(National Center for Education Statistics) - STATE ID-6025381 Organizations: BALLICO-CRESSEY ELEMENTARY (SCHOOL DISTRICT)
FARM MANAGEMENT, INC. (11016 N. BALLICO AVENUE in BALLICO, CA)
CRITERIA AND HAZARDOUS AIR POLLUTANT INVENTORY (Inventory of air pollution sources)
37.1%Electricity
34.6%Other fuel
14.3%Wood
13.9%Bottled, tank, or LP gas
1.0%Utility gas
Population in 1990: 1,296.
Place of birth for U.S.-born residents:
This state: 556
Northeast: 15
Midwest: 1
South: 1
West: 10
80% of the 95303 zip code residents lived in the same house 5 years ago. Out of people who lived in different houses, 52% lived in this county. Out of people who lived in different counties, 50% lived in California.
89% of the 95303 zip code residents lived in the same house 1 year ago. Out of people who lived in different houses, 12% moved from this county. Out of people who lived in different houses, 89% moved from different county within same state.
Private vs. public school enrollment:
Students in private schools in grades 1 to 8 (elementary and middle school): 7
Here:
7.9%
California:
10.5%
Students in private schools in grades 9 to 12 (high school): 10
Here:
20.4%
California:
8.5%
Students in private undergraduate colleges: 7
Here:
18.1%
California:
15.9%
Occupation by median earnings in the past 12 months ($)
248,553Management occupations
80,223Education, training, and library occupations
73,589Farming, fishing, and forestry occupations
59,132Transportation occupations
50,578Sales and related occupations
37,632Construction and extraction occupations
Companies with federal contracts located in this zip code:
GOLDEN BY-PRODUCTS, INC (13000 NEWPORT RD in BALLICO, CA; small business) : $24,580 in 4 contractsin 2005
$8,160 with Defense Logistics Agency for Preparation and Disposal of Excess and Surplus Property. Signed on 2005-07-01. Completion date: 2006-06-28.
$6,800, same as above.Signed on 2005-07-01. Completion date: 2006-06-28.
$5,120, same as above.Signed on 2005-07-01. Completion date: 2006-06-28.
$4,500, same as above.Signed on 2005-07-01. Completion date: 2006-06-28.
Top industries in this zip code by the number of employees in 2005:
Other Services (except Public Administration): Car Washes (10-19: 1)
Other Services (except Public Administration): Commercial and Industrial Machinery and Equipment (except Automotive and Electronic) Repair and Maintenance (5-9: 1)
Professional, Scientific, and Technical Services: Veterinary Services (5-9: 1)
Wholesale Trade: Farm and Garden Machinery and Equipment Merchant Wholesalers (1-4: 2)
Wholesale Trade: Brick, Stone, and Related Construction Material Merchant Wholesalers (1-4: 1)
People in group quarters in 2000:
11 people in agriculture workers' dormitories on farms
Fatal accident statistics in 2013:
Fatal accident count: 2
Vehicles involved in fatal accidents: 3
Fatal accidents caused by drunken drivers: 0
Fatalities: 2
Persons involved in fatal accidents: 3
Pedestrians involved in fatal accidents: 0
Fatal accident statistics in 2011:
Fatal accident count: 1
Vehicles involved in fatal accidents: 1
Fatal accidents caused by drunken drivers: 1
Fatalities: 1
Persons involved in fatal accidents: 1
Pedestrians involved in fatal accidents: 0
Home Mortgage Disclosure Act Aggregated Statistics For Year 2009 (Based on 2 partial tracts)
A) FHA, FSA/RHS & VA Home Purchase Loans
B) Conventional Home Purchase Loans
C) Refinancings
D) Home Improvement Loans
E) Loans on Dwellings For 5+ Families
F) Non-occupant Loans on < 5 Family Dwellings (A B C & D)
G) Loans On Manufactured Home Dwelling (A B C & D)
Number
Average Value
Number
Average Value
Number
Average Value
Number
Average Value
Number
Average Value
Number
Average Value
Number
Average Value
LOANS ORIGINATED
112
$119,791
48
$106,953
48
$158,268
1
$198,540
0
$0
22
$86,786
1
$180,630
APPLICATIONS APPROVED, NOT ACCEPTED
8
$147,041
6
$82,975
7
$148,320
1
$85,840
1
$194,060
2
$77,625
1
$136,590
APPLICATIONS DENIED
18
$120,295
16
$130,154
42
$181,020
4
$77,440
0
$0
7
$133,819
3
$121,913
APPLICATIONS WITHDRAWN
13
$126,314
7
$101,084
22
$190,604
0
$0
0
$0
3
$92,057
0
$0
FILES CLOSED FOR INCOMPLETENESS
3
$191,823
2
$141,445
6
$256,140
0
$0
0
$0
1
$81,360
0
$0
Aggregated Statistics For Year 2008 (Based on 2 partial tracts)
A) FHA, FSA/RHS & VA Home Purchase Loans
B) Conventional Home Purchase Loans
C) Refinancings
D) Home Improvement Loans
F) Non-occupant Loans on < 5 Family Dwellings (A B C & D)
G) Loans On Manufactured Home Dwelling (A B C & D)
Number
Average Value
Number
Average Value
Number
Average Value
Number
Average Value
Number
Average Value
Number
Average Value
LOANS ORIGINATED
93
$151,680
66
$139,011
54
$199,925
8
$82,011
22
$158,305
2
$149,655
APPLICATIONS APPROVED, NOT ACCEPTED
7
$166,340
13
$124,419
16
$200,129
2
$95,910
3
$114,200
2
$96,660
APPLICATIONS DENIED
16
$137,151
30
$158,933
99
$215,204
16
$98,058
13
$159,098
5
$126,738
APPLICATIONS WITHDRAWN
5
$178,986
9
$123,404
31
$184,818
2
$275,050
4
$135,285
1
$37,320
FILES CLOSED FOR INCOMPLETENESS
4
$155,998
7
$194,170
13
$203,021
0
$0
4
$199,662
0
$0
Aggregated Statistics For Year 2007 (Based on 2 partial tracts)
A) FHA, FSA/RHS & VA Home Purchase Loans
B) Conventional Home Purchase Loans
C) Refinancings
D) Home Improvement Loans
E) Loans on Dwellings For 5+ Families
F) Non-occupant Loans on < 5 Family Dwellings (A B C & D)
G) Loans On Manufactured Home Dwelling (A B C & D)
Number
Average Value
Number
Average Value
Number
Average Value
Number
Average Value
Number
Average Value
Number
Average Value
Number
Average Value
LOANS ORIGINATED
1
$391,860
76
$215,179
183
$223,749
29
$97,521
1
$440,380
25
$203,290
4
$183,428
APPLICATIONS APPROVED, NOT ACCEPTED
0
$0
19
$221,170
57
$242,645
10
$129,276
0
$0
5
$302,142
1
$28,360
APPLICATIONS DENIED
1
$212,720
45
$235,249
222
$261,990
34
$159,005
0
$0
17
$226,818
4
$241,460
APPLICATIONS WITHDRAWN
1
$143,310
9
$232,297
87
$247,710
9
$159,149
0
$0
11
$177,915
1
$225,410
FILES CLOSED FOR INCOMPLETENESS
0
$0
8
$191,731
34
$262,184
0
$0
0
$0
4
$184,548
0
$0
Aggregated Statistics For Year 2006 (Based on 2 partial tracts)
A) FHA, FSA/RHS & VA Home Purchase Loans
B) Conventional Home Purchase Loans
C) Refinancings
D) Home Improvement Loans
F) Non-occupant Loans on < 5 Family Dwellings (A B C & D)
G) Loans On Manufactured Home Dwelling (A B C & D)
Number
Average Value
Number
Average Value
Number
Average Value
Number
Average Value
Number
Average Value
Number
Average Value
LOANS ORIGINATED
0
$0
247
$205,804
381
$230,547
65
$148,890
53
$221,427
2
$172,790
APPLICATIONS APPROVED, NOT ACCEPTED
0
$0
56
$216,336
97
$219,395
15
$129,028
10
$211,604
3
$74,390
APPLICATIONS DENIED
1
$89,570
91
$213,807
237
$262,572
54
$135,624
25
$213,620
3
$176,400
APPLICATIONS WITHDRAWN
1
$251,540
43
$204,774
166
$257,418
15
$168,736
12
$216,456
1
$298,560
FILES CLOSED FOR INCOMPLETENESS
0
$0
12
$198,418
34
$237,904
5
$193,914
2
$394,470
0
$0
Aggregated Statistics For Year 2005 (Based on 2 partial tracts)
B) Conventional Home Purchase Loans
C) Refinancings
D) Home Improvement Loans
E) Loans on Dwellings For 5+ Families
F) Non-occupant Loans on < 5 Family Dwellings (A B C & D)
G) Loans On Manufactured Home Dwelling (A B C & D)
Number
Average Value
Number
Average Value
Number
Average Value
Number
Average Value
Number
Average Value
Number
Average Value
LOANS ORIGINATED
345
$202,999
502
$206,988
65
$134,237
0
$0
58
$194,013
4
$190,518
APPLICATIONS APPROVED, NOT ACCEPTED
68
$204,009
86
$196,885
15
$104,944
0
$0
14
$180,682
3
$143,807
APPLICATIONS DENIED
119
$219,724
268
$218,637
50
$115,050
1
$149,280
34
$200,430
6
$75,510
APPLICATIONS WITHDRAWN
54
$206,615
193
$209,820
30
$181,475
0
$0
22
$212,622
1
$438,880
FILES CLOSED FOR INCOMPLETENESS
17
$209,212
60
$218,260
5
$99,720
0
$0
4
$183,800
0
$0
Aggregated Statistics For Year 2004 (Based on 2 partial tracts)
A) FHA, FSA/RHS & VA Home Purchase Loans
B) Conventional Home Purchase Loans
C) Refinancings
D) Home Improvement Loans
F) Non-occupant Loans on < 5 Family Dwellings (A B C & D)
G) Loans On Manufactured Home Dwelling (A B C & D)
Number
Average Value
Number
Average Value
Number
Average Value
Number
Average Value
Number
Average Value
Number
Average Value
LOANS ORIGINATED
4
$158,238
245
$153,405
431
$161,732
54
$110,979
34
$150,949
10
$179,211
APPLICATIONS APPROVED, NOT ACCEPTED
0
$0
58
$160,373
79
$155,657
4
$105,802
7
$126,354
6
$173,290
APPLICATIONS DENIED
0
$0
103
$173,629
213
$161,846
27
$80,003
24
$148,254
11
$110,738
APPLICATIONS WITHDRAWN
1
$370,210
43
$178,233
152
$169,006
18
$156,786
7
$147,894
2
$238,475
FILES CLOSED FOR INCOMPLETENESS
0
$0
6
$184,983
70
$169,220
1
$37,320
0
$0
1
$104,500
Aggregated Statistics For Year 2003 (Based on 2 partial tracts)
A) FHA, FSA/RHS & VA Home Purchase Loans
B) Conventional Home Purchase Loans
C) Refinancings
D) Home Improvement Loans
E) Loans on Dwellings For 5+ Families
F) Non-occupant Loans on < 5 Family Dwellings (A B C & D)
Number
Average Value
Number
Average Value
Number
Average Value
Number
Average Value
Number
Average Value
Number
Average Value
LOANS ORIGINATED
16
$139,250
262
$145,896
530
$131,350
23
$42,155
1
$7,105,730
39
$120,304
APPLICATIONS APPROVED, NOT ACCEPTED
1
$249,300
45
$142,363
76
$134,774
4
$23,885
0
$0
10
$133,904
APPLICATIONS DENIED
2
$132,860
63
$147,835
233
$139,602
18
$38,357
0
$0
10
$103,974
APPLICATIONS WITHDRAWN
3
$153,013
21
$172,454
151
$146,532
4
$97,778
0
$0
6
$162,467
FILES CLOSED FOR INCOMPLETENESS
0
$0
7
$178,923
25
$142,861
2
$27,245
0
$0
4
$139,762
Aggregated Statistics For Year 2002 (Based on 2 partial tracts)
A) FHA, FSA/RHS & VA Home Purchase Loans
B) Conventional Home Purchase Loans
C) Refinancings
D) Home Improvement Loans
F) Non-occupant Loans on < 5 Family Dwellings (A B C & D)
Number
Average Value
Number
Average Value
Number
Average Value
Number
Average Value
Number
Average Value
LOANS ORIGINATED
42
$144,464
166
$119,887
281
$117,466
14
$26,497
23
$111,149
APPLICATIONS APPROVED, NOT ACCEPTED
1
$217,200
28
$129,554
51
$123,419
8
$29,949
3
$161,720
APPLICATIONS DENIED
4
$142,002
56
$125,648
138
$132,854
19
$38,616
7
$108,334
APPLICATIONS WITHDRAWN
4
$140,882
19
$138,241
102
$122,966
7
$32,309
3
$110,717
FILES CLOSED FOR INCOMPLETENESS
1
$238,100
9
$121,414
28
$118,278
0
$0
4
$76,132
Aggregated Statistics For Year 2001 (Based on 2 partial tracts)
A) FHA, FSA/RHS & VA Home Purchase Loans
B) Conventional Home Purchase Loans
C) Refinancings
D) Home Improvement Loans
F) Non-occupant Loans on < 5 Family Dwellings (A B C & D)
Number
Average Value
Number
Average Value
Number
Average Value
Number
Average Value
Number
Average Value
LOANS ORIGINATED
43
$121,733
89
$110,752
214
$106,756
7
$22,071
15
$98,674
APPLICATIONS APPROVED, NOT ACCEPTED
1
$71,650
10
$74,043
39
$112,879
1
$16,420
3
$116,440
APPLICATIONS DENIED
1
$230,640
24
$108,228
151
$106,266
16
$19,686
7
$65,790
APPLICATIONS WITHDRAWN
6
$119,797
11
$117,321
116
$113,691
9
$23,304
1
$94,050
FILES CLOSED FOR INCOMPLETENESS
0
$0
3
$112,457
12
$74,764
0
$0
0
$0
Aggregated Statistics For Year 2000 (Based on 2 partial tracts)
A) FHA, FSA/RHS & VA Home Purchase Loans
B) Conventional Home Purchase Loans
C) Refinancings
D) Home Improvement Loans
E) Loans on Dwellings For 5+ Families
F) Non-occupant Loans on < 5 Family Dwellings (A B C & D)
Number
Average Value
Number
Average Value
Number
Average Value
Number
Average Value
Number
Average Value
Number
Average Value
LOANS ORIGINATED
69
$115,303
78
$87,243
38
$80,533
14
$30,602
0
$0
6
$77,625
APPLICATIONS APPROVED, NOT ACCEPTED
2
$105,990
13
$87,845
13
$77,970
10
$30,229
0
$0
1
$55,980
APPLICATIONS DENIED
6
$110,467
24
$71,312
84
$67,292
20
$24,146
1
$95,540
4
$75,200
APPLICATIONS WITHDRAWN
13
$98,352
15
$92,852
37
$81,015
4
$23,138
0
$0
1
$118,680
FILES CLOSED FOR INCOMPLETENESS
0
$0
4
$73,520
5
$100,166
0
$0
0
$0
0
$0
Aggregated Statistics For Year 1999 (Based on 1 partial tract)
A) FHA, FSA/RHS & VA Home Purchase Loans
B) Conventional Home Purchase Loans
C) Refinancings
D) Home Improvement Loans
E) Loans on Dwellings For 5+ Families
F) Non-occupant Loans on < 5 Family Dwellings (A B C & D)
Detailed PMIC statistics for the following Tracts:0002.00
2005 - 2018 National Fire Incident Reporting System (NFIRS) incidents
According to the data from the years 2005 - 2018 the average number of fires per year is 15. The highest number of reported fires - 34 took place in 2007, and the least - 2 in 2005. The data has a growing trend.
When looking into fire subcategories, the most reports belonged to: Outside Fires (47.6%), and Mobile Property/Vehicle Fires (36.8%).
Fire incident types reported to NFIRS in Zip Code 95303


+$3,306
-$7,562
 Nearest zip codes: 95312, 95316, 95388, 95315, 95323, 95334.


 According to the data from the years 2005 - 2018 the average number of fires per year is 15. The highest number of reported fires - 34 took place in 2007, and the least - 2 in 2005. The data has a growing trend.
 When looking into fire subcategories, the most reports belonged to: Outside Fires (47.6%), and Mobile Property/Vehicle Fires (36.8%).