Estimated zip code population in 2022: 1,503 Zip code population in 2010: 1,260 Zip code population in 2000: 1,052
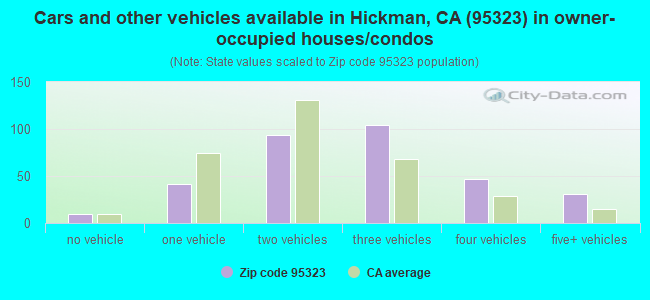
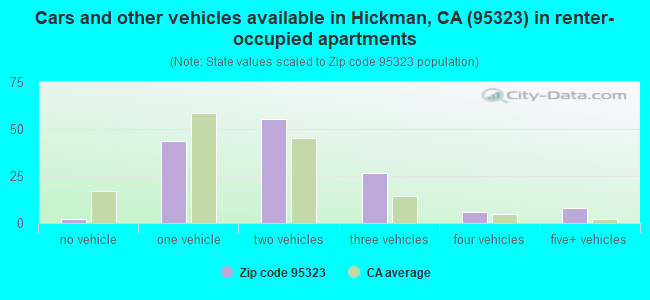
Houses and condos: 492 Renter-occupied apartments: 141
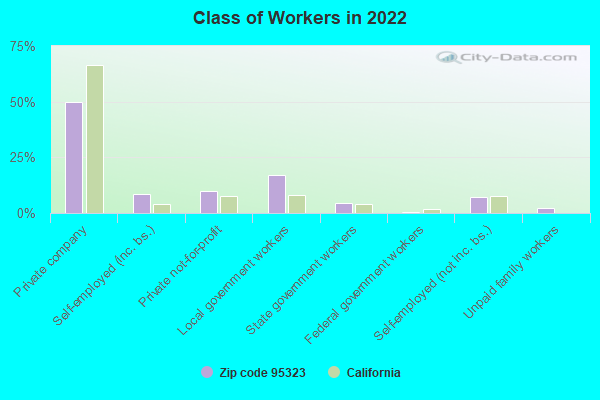
% of renters here:
30%
State:
44%
March 2022 cost of living index in zip code 95323: 96.8 (near average, U.S. average is 100)
Land area: 30.8 sq. mi. Water area: 0.2 sq. mi.
Population density: 49 people per square mile
(very low).
OSM Map
General Map
Google Map
MSN Map
OSM Map
General Map
Google Map
MSN Map
OSM Map
General Map
Google Map
MSN Map
OSM Map
General Map
Google Map
MSN Map
Please wait while loading the map...
Real estate property taxes paid for housing units in 2022:
This zip code:
0.8% ($4,388)
California:
0.7% ($4,831)
Median real estate property taxes paid for housing units with mortgages in 2022: $4,543 (0.8%) Median real estate property taxes paid for housing units with no mortgage in 2022: $4,184 (0.8%)
Business Search- 14 Million verified businesses
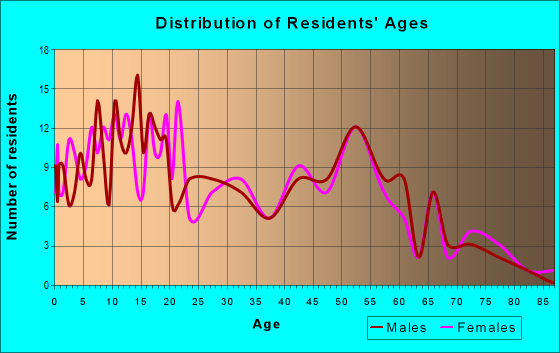
Males: 725
(48.3%)
Females: 777
(51.7%)
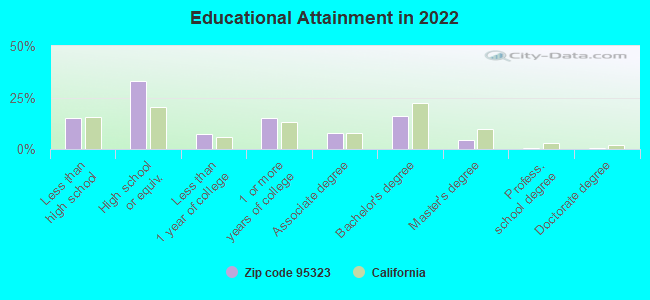
For population 25 years and over in 95323:
High school or higher: 83.7%
Bachelor's degree or higher: 21.2%
Graduate or professional degree: 5.3%
Unemployed: 11.9%
Mean travel time to work (commute): 28.5 minutes
For population 15 years and over in 95323:
Never married: 31.1%
Now married: 57.6%
Separated: 0.2%
Widowed: 2.6%
Divorced: 8.6%
Zip code 95323 compared to state average:
Unemployed percentage above state average.
Black race population percentage significantly below state average.
Foreign-born population percentage below state average.
House age below state average.
Percentage of population with a bachelor's degree or higher below state average.
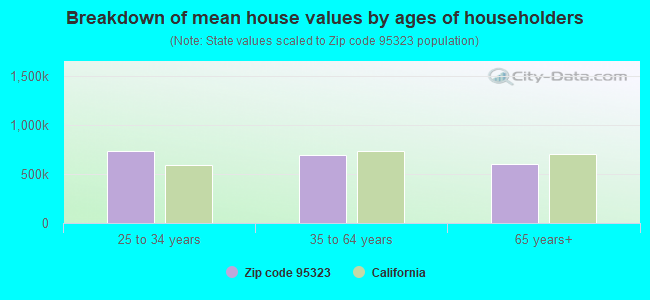
Estimated median house/condo value in 2022: $532,935
95323:
$532,935
California:
$715,900
According to our research of California and other state lists, there were 2 registered sex offenders living in 95323 zip code as of May 28, 2024. The ratio of all residents to sex offenders in zip code 95323 is 549 to 1. The ratio of registered sex offenders to all residents in this zip code is near the state average.
Median resident age:
This zip code:
41.0 years
California median age:
37.9 years
Average household size:
This zip code:
3.2 people
California:
2.8 people
Averages for the 2020 tax year for zip code 95323, filed in 2021:
Average Adjusted Gross Income (AGI) in 2020: $106,255 (Individual Income Tax Returns)
Here:
$106,255
State:
$95,910
Salary/wage: $63,100 (reported on 81.1% of returns)
Here:
$63,100
State:
$77,331
(% of AGI for various income ranges: 1193.3% for AGIs below $25k, 3948.2% for AGIs $25k-50k, 7662.0% for AGIs $50k-75k, 11026.7% for AGIs $75k-100k, 19667.5% for AGIs $100k-200k)
Taxable interest for individuals: $1,800 (reported on 32.1% of returns)
This zip code:
$1,800
California:
$2,294
(% of AGI for various income ranges: 3.3% for AGIs below $25k, 10.9% for AGIs $25k-50k, 16.0% for AGIs $50k-75k, 3.3% for AGIs $75k-100k, 302.5% for AGIs $100k-200k)
Ordinary dividends: $31,538 (reported on 15.1% of returns)
Here:
$31,538
State:
$10,949
(% of AGI for various income ranges: 19.1% for AGIs $25k-50k, 6255.0% for AGIs $100k-200k)
Net capital gain/loss in AGI: +$8,486 (reported on 13.2% of returns)
Here:
+$8,486
State:
+$49,306
(% of AGI for various income ranges: 232.0% for AGIs $50k-75k, 1195.0% for AGIs $100k-200k)
Profit/loss from business: +$4,533 (reported on 11.3% of returns)
Here:
+$4,533
State:
+$15,671
(% of AGI for various income ranges: 291.1% for AGIs below $25k, 20.0% for AGIs $50k-75k)
Taxable individual retirement arrangement distribution: $15,567 (reported on 5.7% of returns)
95323:
$15,567
California:
$23,505
(% of AGI for various income ranges: 424.5% for AGIs $25k-50k)
Total itemized deductions: $40,400 (reported on 9.4% of returns)
Here:
$40,400
State:
$39,517
(% of AGI for various income ranges: 5050.0% for AGIs $100k-200k)
Charity contributions: $16,725 (reported on 7.5% of returns)
Here:
$16,725
State:
$12,598
(% of AGI for various income ranges: 1672.5% for AGIs $100k-200k)
Taxes paid: $7,460 (reported on 9.4% of returns)
95323:
$7,460
State:
$8,807
(% of AGI for various income ranges: 932.5% for AGIs $100k-200k)
Earned income credit: $2,078 (reported on 17.0% of returns)
Here:
$2,078
State:
$2,074
(% of AGI for various income ranges: 63.3% for AGIs below $25k, 118.2% for AGIs $25k-50k)
Percentage of individuals using paid preparers for their 2020 taxes: 96.2%
Here:
96%
State:
92%
(% for various income ranges: 92.9% for AGIs below $25k, 93.8% for AGIs $25k-50k, 100.0% for AGIs $50k-75k, 100.0% for AGIs $75k-100k, 100.0% for AGIs $100k-200k, 100.0% for AGIs over 200k)
Averages for the 2012 tax year for zip code 95323, filed in 2013:
Average Adjusted Gross Income (AGI) in 2012: $64,262 (Individual Income Tax Returns)
Here:
$64,262
State:
$72,726
Salary/wage: $40,733 (reported on 85.7% of returns)
Here:
$40,733
State:
$59,079
(% of AGI for various income ranges: 80.0% for AGIs below $25k, 81.9% for AGIs $25k-50k, 79.2% for AGIs $50k-75k, 76.7% for AGIs $75k-100k, 33.9% for AGIs $100k-200k)
Taxable interest for individuals: $747 (reported on 30.4% of returns)
This zip code:
$747
California:
$2,146
(% of AGI for various income ranges: 0.5% for AGIs below $25k, 0.1% for AGIs $25k-50k, 0.3% for AGIs $50k-75k, 0.5% for AGIs $100k-200k)
Ordinary dividends: $3,283 (reported on 10.7% of returns)
Here:
$3,283
State:
$9,308
Net capital gain/loss in AGI: +$5,083 (reported on 10.7% of returns)
Here:
+$5,083
State:
+$30,460
Profit/loss from business: +$7,514 (reported on 12.5% of returns)
Here:
+$7,514
State:
+$17,064
(% of AGI for various income ranges: 5.8% for AGIs below $25k, 6.9% for AGIs $25k-50k)
Taxable individual retirement arrangement distribution: $8,200 (reported on 3.6% of returns)
95323:
$8,200
California:
$19,557
Total itemized deductions: $27,300 (18% of AGI, reported on 25.0% of returns)
Here:
$27,300
State:
$34,004
Here:
17.6% of AGI
State:
22.7% of AGI
(% of AGI for various income ranges: 13.5% for AGIs $25k-50k, 18.8% for AGIs $50k-75k, 11.2% for AGIs $100k-200k)
Charity contributions: $5,718 (reported on 19.6% of returns)
Here:
$5,718
State:
$4,659
(% of AGI for various income ranges: 1.0% for AGIs below $25k, 3.0% for AGIs $50k-75k, 2.4% for AGIs $100k-200k)
Taxes paid: $10,100 (reported on 25.0% of returns)
95323:
$10,100
State:
$14,448
(% of AGI for various income ranges: 1.9% for AGIs $25k-50k, 4.8% for AGIs $50k-75k, 5.5% for AGIs $100k-200k)
Earned income credit: $2,600 (reported on 19.6% of returns)
Here:
$2,600
State:
$2,286
(% of AGI for various income ranges: 5.9% for AGIs below $25k, 1.9% for AGIs $25k-50k)
Percentage of individuals using paid preparers for their 2012 taxes: 69.6%
Here:
70%
State:
64%
(% for various income ranges: 63.6% for AGIs below $25k, 64.7% for AGIs $25k-50k, 85.7% for AGIs $50k-75k, 66.7% for AGIs $75k-100k, 85.7% for AGIs $100k-200k)
Averages for the 2004 tax year for zip code 95323, filed in 2005:
Average Adjusted Gross Income (AGI) in 2004: $49,763 (Individual Income Tax Returns)
Here:
$49,763
State:
$58,600
Salary/wage: $38,069 (reported on 86.8% of returns)
Here:
$38,069
State:
$49,455
(% of AGI for various income ranges: 296.8% for AGIs below $10k, 81.9% for AGIs $10k-25k, 87.1% for AGIs $25k-50k, 80.4% for AGIs $50k-75k, 88.4% for AGIs $75k-100k, 38.1% for AGIs over 100k)
Taxable interest for individuals: $1,718 (reported on 40.0% of returns)
This zip code:
$1,718
California:
$2,365
(% of AGI for various income ranges: 15.4% for AGIs below $10k, 1.4% for AGIs $10k-25k, 0.5% for AGIs $25k-50k, 0.9% for AGIs $50k-75k, 0.9% for AGIs $75k-100k, 1.9% for AGIs over 100k)
Taxable dividends: $3,830 (reported on 16.5% of returns)
Here:
$3,830
State:
$4,746
(% of AGI for various income ranges: 0.3% for AGIs $10k-25k, 0.0% for AGIs $25k-50k, 0.2% for AGIs $50k-75k, 0.8% for AGIs $75k-100k, 2.7% for AGIs over 100k)
Net capital gain/loss: +$8,813 (reported on 14.1% of returns)
Here:
+$8,813
State:
+$23,418
(% of AGI for various income ranges: -1.3% for AGIs below $10k, -0.1% for AGIs $25k-50k, 0.6% for AGIs $50k-75k, 5.8% for AGIs over 100k)
Profit/loss from business: +$3,600 (reported on 10.3% of returns)
Here:
+$3,600
State:
+$16,826
Profit/loss from farming: +$9,811 (reported on 10.0% of returns)
Here:
+$9,811
State:
-$7,562
(% of AGI for various income ranges: -0.4% for AGIs $10k-25k, 2.0% for AGIs $50k-75k, 4.0% for AGIs over 100k)
Total itemized deductions: $22,067 (21% of AGI, reported on 30.6% of returns)
Here:
$22,067
State:
$28,113
Here:
21.0% of AGI
State:
25.3% of AGI
(% of AGI for various income ranges: 6.8% for AGIs $10k-25k, 11.7% for AGIs $25k-50k, 16.2% for AGIs $50k-75k, 19.9% for AGIs $75k-100k, 13.3% for AGIs over 100k)
Charity contributions deductions: $4,059 (4% of AGI, reported on 25.4% of returns)
Here:
$4,059
State:
$3,923
Here:
3.6% of AGI
State:
3.3% of AGI
(% of AGI for various income ranges: 1.2% for AGIs $25k-50k, 2.7% for AGIs $50k-75k, 2.4% for AGIs $75k-100k, 2.6% for AGIs over 100k)
Total tax: $9,510 (reported on 67.9% of returns)
95323:
$9,510
State:
$10,761
(% of AGI for various income ranges: 2.6% for AGIs below $10k, 4.4% for AGIs $10k-25k, 5.0% for AGIs $25k-50k, 7.8% for AGIs $50k-75k, 9.4% for AGIs $75k-100k, 21.9% for AGIs over 100k)
Earned income credit: $1,712 (reported on 19.5% of returns)
Here:
$1,712
State:
$1,763
Percentage of individuals using paid preparers for their 2004 taxes: 69.2%
Here:
69%
State:
66%
(% for various income ranges: 57.0% for AGIs below $10k, 67.6% for AGIs $10k-25k, 65.0% for AGIs $25k-50k, 76.6% for AGIs $50k-75k, 80.6% for AGIs $75k-100k, 87.5% for AGIs over 100k)
Household received Food Stamps/SNAP in the past 12 months: 26 Household did not receive Food Stamps/SNAP in the past 12 months: 437
Women who had a birth in the past 12 months: 15 (15 now married, 0 unmarried) Women who did not have a birth in the past 12 months: 405 (170 now married, 234 unmarried)
Housing units in zip code 95323 with a mortgage: 240 (20 second mortgage, 20 both second mortgage and home equity loan) Houses without a mortgage: 3
Median monthly owner costs for units with a mortgage: $2,280 Median monthly owner costs for units without a mortgage: $683
Residents with income below the poverty level in 2022:
This zip code:
10.0%
Whole state:
12.2%
Residents with income below 50% of the poverty level in 2022:
This zip code:
6.6%
Whole state:
6.2%
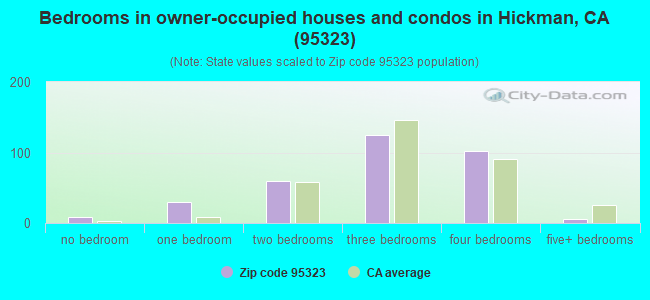
Median number of rooms in houses and condos:
Here:
5.8
State:
6.0
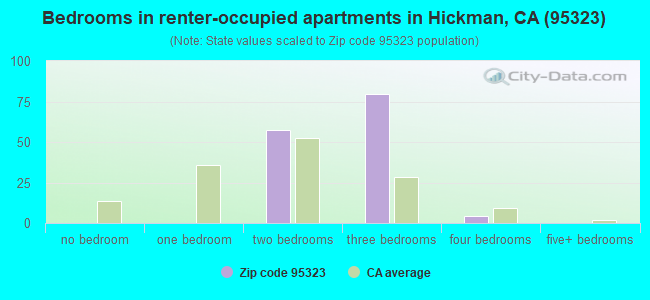
Median number of rooms in apartments:
Here:
4.9
State:
3.9
Notable locations in this zip code not listed on our city pages
Size of family households: 116 2-persons, 117 3-persons, 94 4-persons, 30 5-persons, 19 6-persons, 10 7-or-more-persons
Size of nonfamily households: 70 1-person, 8 2-persons
300 married couples with children.
24 single-parent households (24 women).
74.3% of residents of 95323 zip code speak English at home.
21.0% of residents speak Spanish at home (45% very well, 19% well, 14% not well, 21% not at all).
4.1% of residents speak other Indo-European language at home (84% very well, 9% well, 7% not well).
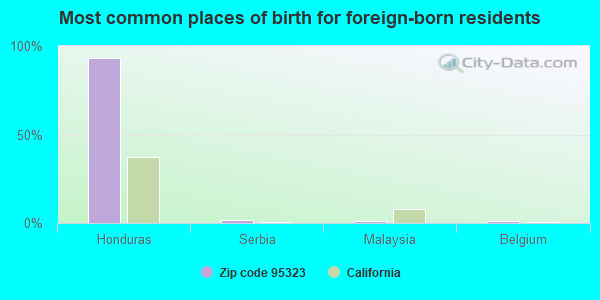
Foreign born population: 219 (14.6%) (22.5% of them are naturalized citizens)
This zip code:
14.6%
Whole state:
26.7%
93%Honduras
2%Serbia
1%Malaysia
1%Belgium
0%France
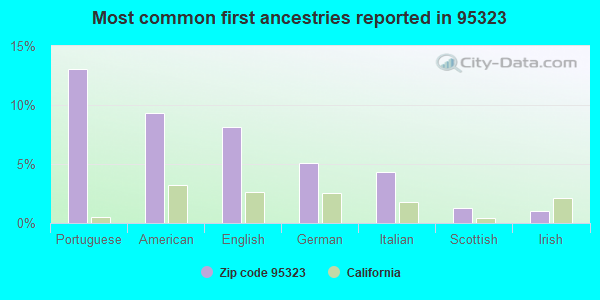
13%Portuguese
9%American
8%English
5%German
4%Italian
1%Scottish
1%Irish
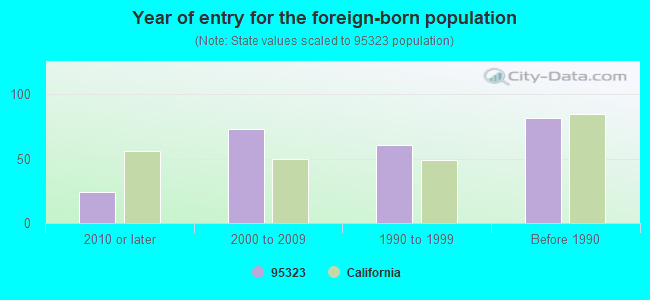
Year of entry for the foreign-born population
242010 or later
732000 to 2009
611990 to 1999
82Before 1990
Facilities with environmental interests located in this zip code:
HICKMAN CHARTER (13306 FOURTH ST in HICKMAN, CA)
(National Center for Education Statistics) - STATE ID-6112627 Organizations: HICKMAN COMMUNITY CHARTER SCHOOL (SCHOOL DISTRICT)
HICKMAN ELEMENTARY (13306 FOURTH ST. in HICKMAN, CA)
(National Center for Education Statistics) - STATE ID-6052559 Organizations: HICKMAN COMMUNITY CHARTER SCHOOL (SCHOOL DISTRICT)
HICKMAN MIDDLE (13306-C FOURTH ST. in HICKMAN, CA)
(National Center for Education Statistics) - STATE ID-6116388 Organizations: HICKMAN COMMUNITY CHARTER SCHOOL (SCHOOL DISTRICT)
FOSTER FARMS DAIRY #2 (1530 HALL RD in HICKMAN, CA)
National Pollutant Discharge Elimination System NON-MAJOR (Tracking pollutant discharge elimination systems) - permit Business SIC classification: DAIRY FARMS Alternative names: MILLER, RICH
FOSTER FARMS DAIRY #3 (1845 HICKMAN RD in HICKMAN, CA)
National Pollutant Discharge Elimination System NON-MAJOR (Tracking pollutant discharge elimination systems) - permit Business SIC classification: DAIRY FARMS Alternative names: MILLER, RICH
FOSTER FARMS DAIRY #4 (5372 HICKMAN RD in HICKMAN, CA)
National Pollutant Discharge Elimination System NON-MAJOR (Tracking pollutant discharge elimination systems) - permit Business SIC classification: DAIRY FARMS Alternative names: MILLER, RICH
Housing units lacking complete plumbing facilities: 0.4% Housing units lacking complete kitchen facilities: 0.4%
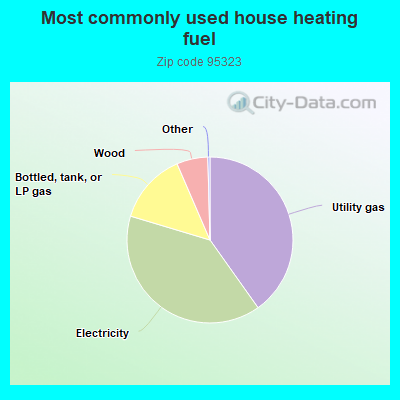
40.3%Utility gas
39.6%Electricity
13.9%Bottled, tank, or LP gas
6.1%Wood
Population in 1990: 1,405.
Place of birth for U.S.-born residents:
This state: 1,161
Northeast: 6
Midwest: 6
South: 32
West: 53
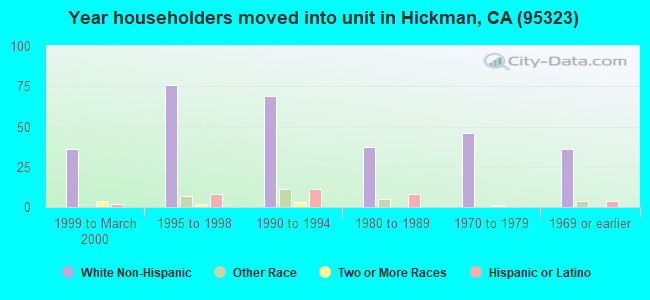
65% of the 95323 zip code residents lived in the same house 5 years ago. Out of people who lived in different houses, 79% lived in this county. Out of people who lived in different counties, 50% lived in California.
95% of the 95323 zip code residents lived in the same house 1 year ago. Out of people who lived in different houses, 63% moved from this county. Out of people who lived in different houses, 42% moved from different county within same state.
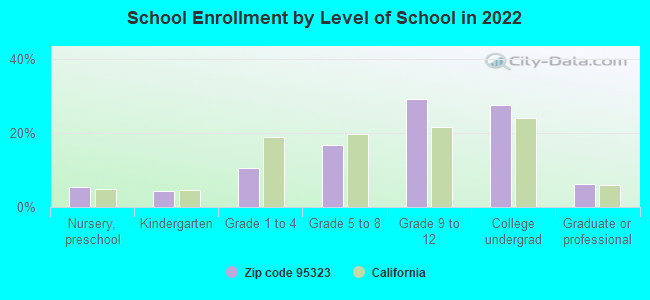
Private vs. public school enrollment:
Students in private schools in grades 1 to 8 (elementary and middle school): 19
Here:
15.1%
California:
10.5%
Students in private schools in grades 9 to 12 (high school): 11
Here:
8.5%
California:
8.5%
Students in private undergraduate colleges: 28
Here:
21.4%
California:
15.9%
Occupation by median earnings in the past 12 months ($)
250,007Sales and related occupations
103,614Education, training, and library occupations
86,543Transportation occupations
67,708Business and financial operations occupations
55,709Management occupations
53,134Health diagnosing and treating practitioners and other technical occupations
Companies with federal contracts located in this zip code:
FRANTZ WHOLESALE NURSERY LLC (12161 DELAWARE RD in HICKMAN, CA; small business)
$26,387 with Army for Seeds and Nursery Stock. Signed on 2005-04-25. Completion date: 2005-04-27.
Top industries in this zip code by the number of employees in 2005:
Construction: Plumbing, Heating, and Air-Conditioning Contractors (20-49 employees: 1 establishment)
Other Services (except Public Administration): Religious Organizations (10-19: 1)
Construction: Commercial and Institutional Building Construction (5-9: 1)
Wholesale Trade: Other Chemical and Allied Products Merchant Wholesalers (1-4: 1)
Real Estate and Rental and Leasing: Other Activities Related to Real Estate (1-4: 1)
Fatal accident statistics in 2012:
Fatal accident count: 1
Vehicles involved in fatal accidents: 1
Fatal accidents caused by drunken drivers: 0
Fatalities: 2
Persons involved in fatal accidents: 3
Pedestrians involved in fatal accidents: 0
Home Mortgage Disclosure Act Aggregated Statistics For Year 2009 (Based on 2 partial tracts)
A) FHA, FSA/RHS & VA Home Purchase Loans
B) Conventional Home Purchase Loans
C) Refinancings
D) Home Improvement Loans
F) Non-occupant Loans on < 5 Family Dwellings (A B C & D)
G) Loans On Manufactured Home Dwelling (A B C & D)
Number
Average Value
Number
Average Value
Number
Average Value
Number
Average Value
Number
Average Value
Number
Average Value
LOANS ORIGINATED
9
$186,186
5
$270,354
33
$228,790
1
$90,240
2
$75,595
1
$170,320
APPLICATIONS APPROVED, NOT ACCEPTED
1
$192,430
0
$0
4
$265,632
1
$140,440
1
$152,990
0
$0
APPLICATIONS DENIED
1
$383,060
2
$306,870
22
$286,006
1
$16,140
1
$133,260
0
$0
APPLICATIONS WITHDRAWN
2
$212,445
2
$191,830
11
$310,915
1
$150,600
2
$103,385
0
$0
FILES CLOSED FOR INCOMPLETENESS
0
$0
0
$0
2
$296,410
1
$125,500
0
$0
0
$0
Aggregated Statistics For Year 2008 (Based on 2 partial tracts)
A) FHA, FSA/RHS & VA Home Purchase Loans
B) Conventional Home Purchase Loans
C) Refinancings
D) Home Improvement Loans
F) Non-occupant Loans on < 5 Family Dwellings (A B C & D)
G) Loans On Manufactured Home Dwelling (A B C & D)
Number
Average Value
Number
Average Value
Number
Average Value
Number
Average Value
Number
Average Value
Number
Average Value
LOANS ORIGINATED
4
$139,240
10
$263,422
21
$410,409
3
$142,427
2
$1,005,165
3
$742,220
APPLICATIONS APPROVED, NOT ACCEPTED
1
$58,560
2
$181,970
7
$310,240
0
$0
1
$216,930
1
$67,530
APPLICATIONS DENIED
1
$213,940
8
$253,830
16
$275,792
8
$234,931
1
$251,590
2
$76,495
APPLICATIONS WITHDRAWN
1
$109,960
2
$145,815
7
$237,161
1
$247,410
0
$0
0
$0
FILES CLOSED FOR INCOMPLETENESS
0
$0
2
$165,535
5
$260,554
2
$216,330
0
$0
0
$0
Aggregated Statistics For Year 2007 (Based on 2 partial tracts)
B) Conventional Home Purchase Loans
C) Refinancings
D) Home Improvement Loans
F) Non-occupant Loans on < 5 Family Dwellings (A B C & D)
G) Loans On Manufactured Home Dwelling (A B C & D)
Number
Average Value
Number
Average Value
Number
Average Value
Number
Average Value
Number
Average Value
LOANS ORIGINATED
8
$302,685
42
$315,889
10
$152,866
4
$223,502
1
$122,510
APPLICATIONS APPROVED, NOT ACCEPTED
2
$288,340
9
$378,347
2
$45,420
1
$121,310
1
$221,110
APPLICATIONS DENIED
5
$236,530
35
$433,858
7
$165,450
2
$153,585
0
$0
APPLICATIONS WITHDRAWN
4
$234,858
13
$327,852
2
$220,515
1
$149,400
0
$0
FILES CLOSED FOR INCOMPLETENESS
2
$276,990
10
$382,643
0
$0
0
$0
0
$0
Aggregated Statistics For Year 2006 (Based on 2 partial tracts)
B) Conventional Home Purchase Loans
C) Refinancings
D) Home Improvement Loans
F) Non-occupant Loans on < 5 Family Dwellings (A B C & D)
G) Loans On Manufactured Home Dwelling (A B C & D)
Number
Average Value
Number
Average Value
Number
Average Value
Number
Average Value
Number
Average Value
LOANS ORIGINATED
16
$337,458
62
$281,518
17
$106,830
5
$232,586
3
$190,633
APPLICATIONS APPROVED, NOT ACCEPTED
4
$320,462
14
$306,654
2
$145,515
2
$253,380
1
$59,760
APPLICATIONS DENIED
19
$463,801
34
$300,452
7
$196,269
2
$271,910
2
$328,080
APPLICATIONS WITHDRAWN
4
$254,578
34
$233,837
2
$337,945
2
$212,150
0
$0
FILES CLOSED FOR INCOMPLETENESS
1
$136,250
6
$279,278
0
$0
0
$0
0
$0
Aggregated Statistics For Year 2005 (Based on 2 partial tracts)
B) Conventional Home Purchase Loans
C) Refinancings
D) Home Improvement Loans
E) Loans on Dwellings For 5+ Families
F) Non-occupant Loans on < 5 Family Dwellings (A B C & D)
G) Loans On Manufactured Home Dwelling (A B C & D)
Number
Average Value
Number
Average Value
Number
Average Value
Number
Average Value
Number
Average Value
Number
Average Value
LOANS ORIGINATED
54
$277,320
84
$268,159
14
$191,958
0
$0
12
$195,963
0
$0
APPLICATIONS APPROVED, NOT ACCEPTED
9
$290,699
13
$315,211
5
$231,630
0
$0
2
$329,875
1
$29,880
APPLICATIONS DENIED
17
$366,962
36
$291,596
7
$156,999
1
$298,800
4
$153,435
2
$138,645
APPLICATIONS WITHDRAWN
10
$253,621
30
$286,250
3
$75,100
0
$0
3
$360,950
1
$47,210
FILES CLOSED FOR INCOMPLETENESS
2
$226,490
8
$339,288
2
$120,415
0
$0
1
$218,120
0
$0
Aggregated Statistics For Year 2004 (Based on 2 partial tracts)
B) Conventional Home Purchase Loans
C) Refinancings
D) Home Improvement Loans
F) Non-occupant Loans on < 5 Family Dwellings (A B C & D)
G) Loans On Manufactured Home Dwelling (A B C & D)
Number
Average Value
Number
Average Value
Number
Average Value
Number
Average Value
Number
Average Value
LOANS ORIGINATED
39
$224,897
82
$207,170
10
$143,304
8
$211,550
4
$171,362
APPLICATIONS APPROVED, NOT ACCEPTED
5
$250,156
11
$174,988
3
$55,977
2
$94,720
2
$85,455
APPLICATIONS DENIED
11
$159,885
32
$249,199
5
$82,946
5
$224,100
4
$103,085
APPLICATIONS WITHDRAWN
9
$184,791
29
$247,901
3
$68,327
2
$186,150
1
$90,240
FILES CLOSED FOR INCOMPLETENESS
1
$600
8
$234,484
1
$8,960
0
$0
0
$0
Aggregated Statistics For Year 2003 (Based on 2 partial tracts)
A) FHA, FSA/RHS & VA Home Purchase Loans
B) Conventional Home Purchase Loans
C) Refinancings
D) Home Improvement Loans
F) Non-occupant Loans on < 5 Family Dwellings (A B C & D)
Number
Average Value
Number
Average Value
Number
Average Value
Number
Average Value
Number
Average Value
LOANS ORIGINATED
2
$146,410
39
$250,348
144
$186,576
10
$88,266
8
$160,605
APPLICATIONS APPROVED, NOT ACCEPTED
0
$0
8
$176,441
25
$177,344
4
$63,795
1
$135,060
APPLICATIONS DENIED
0
$0
10
$226,968
48
$202,624
9
$60,756
1
$108,170
APPLICATIONS WITHDRAWN
0
$0
6
$292,625
39
$230,306
2
$53,785
1
$164,340
FILES CLOSED FOR INCOMPLETENESS
0
$0
0
$0
4
$196,162
0
$0
0
$0
Aggregated Statistics For Year 2002 (Based on 2 partial tracts)
A) FHA, FSA/RHS & VA Home Purchase Loans
B) Conventional Home Purchase Loans
C) Refinancings
D) Home Improvement Loans
F) Non-occupant Loans on < 5 Family Dwellings (A B C & D)
Number
Average Value
Number
Average Value
Number
Average Value
Number
Average Value
Number
Average Value
LOANS ORIGINATED
2
$150,595
19
$178,777
90
$176,910
7
$31,246
3
$134,260
APPLICATIONS APPROVED, NOT ACCEPTED
0
$0
4
$119,820
8
$150,595
2
$28,085
0
$0
APPLICATIONS DENIED
0
$0
10
$170,017
25
$167,448
4
$18,228
2
$190,335
APPLICATIONS WITHDRAWN
0
$0
5
$156,690
20
$216,809
1
$11,950
0
$0
FILES CLOSED FOR INCOMPLETENESS
0
$0
2
$138,940
6
$181,870
0
$0
0
$0
Aggregated Statistics For Year 2001 (Based on 2 partial tracts)
A) FHA, FSA/RHS & VA Home Purchase Loans
B) Conventional Home Purchase Loans
C) Refinancings
D) Home Improvement Loans
F) Non-occupant Loans on < 5 Family Dwellings (A B C & D)
Number
Average Value
Number
Average Value
Number
Average Value
Number
Average Value
Number
Average Value
LOANS ORIGINATED
4
$110,705
32
$160,754
66
$171,656
2
$19,125
4
$96,512
APPLICATIONS APPROVED, NOT ACCEPTED
0
$0
8
$82,918
11
$181,779
0
$0
1
$128,480
APPLICATIONS DENIED
0
$0
10
$149,699
29
$184,679
11
$31,565
1
$108,170
APPLICATIONS WITHDRAWN
0
$0
4
$172,855
24
$182,990
2
$34,360
1
$261,150
FILES CLOSED FOR INCOMPLETENESS
0
$0
0
$0
2
$165,535
0
$0
0
$0
Aggregated Statistics For Year 2000 (Based on 2 partial tracts)
A) FHA, FSA/RHS & VA Home Purchase Loans
B) Conventional Home Purchase Loans
C) Refinancings
D) Home Improvement Loans
F) Non-occupant Loans on < 5 Family Dwellings (A B C & D)
Number
Average Value
Number
Average Value
Number
Average Value
Number
Average Value
Number
Average Value
LOANS ORIGINATED
1
$132,070
21
$155,660
20
$121,253
5
$35,258
4
$80,228
APPLICATIONS APPROVED, NOT ACCEPTED
0
$0
5
$66,812
9
$82,137
1
$59,760
1
$13,150
APPLICATIONS DENIED
1
$71,110
4
$169,270
20
$118,354
4
$24,650
0
$0
APPLICATIONS WITHDRAWN
0
$0
2
$51,990
11
$100,832
1
$14,940
0
$0
FILES CLOSED FOR INCOMPLETENESS
0
$0
1
$136,850
3
$87,450
0
$0
1
$50,800
Aggregated Statistics For Year 1999 (Based on 1 partial tract)
A) FHA, FSA/RHS & VA Home Purchase Loans
B) Conventional Home Purchase Loans
C) Refinancings
D) Home Improvement Loans
F) Non-occupant Loans on < 5 Family Dwellings (A B C & D)
Detailed PMIC statistics for the following Tracts:0029.01
2005 - 2018 National Fire Incident Reporting System (NFIRS) incidents
According to the data from the years 2005 - 2018 the average number of fire incidents per year is 9. The highest number of reported fires - 27 took place in 2005, and the least - 0 in 2009. The data has a declining trend.
When looking into fire subcategories, the most reports belonged to: Outside Fires (58.7%), and Mobile Property/Vehicle Fires (27.8%).
Fire incident types reported to NFIRS in Zip Code 95323


+$9,811
-$7,562
(% of AGI for various income ranges: -0.4% for AGIs $10k-25k, 2.0% for AGIs $50k-75k, 4.0% for AGIs over 100k) Nearest zip codes: 95316, 95386, 95303, 95326, 95382, 95312.
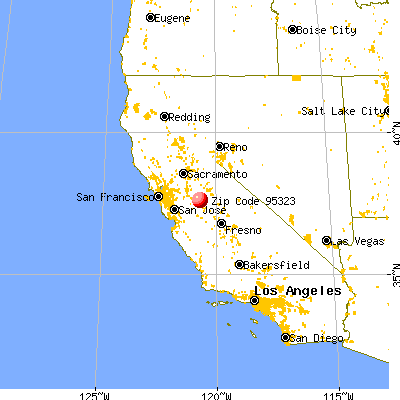
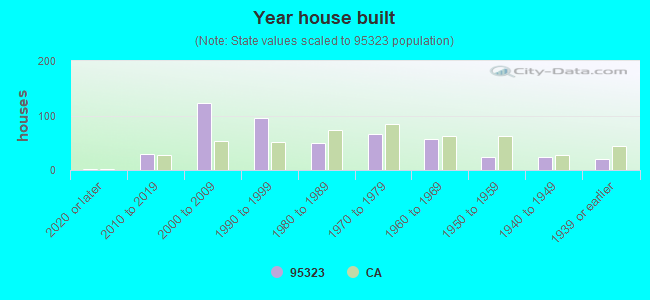


 According to the data from the years 2005 - 2018 the average number of fire incidents per year is 9. The highest number of reported fires - 27 took place in 2005, and the least - 0 in 2009. The data has a declining trend.
 When looking into fire subcategories, the most reports belonged to: Outside Fires (58.7%), and Mobile Property/Vehicle Fires (27.8%).