Estimated zip code population in 2022: 2,163 Zip code population in 2010: 2,197 Zip code population in 2000: 2,256
Houses and condos: 1,547 Renter-occupied apartments: 137
% of renters here:
13%
State:
44%
March 2022 cost of living index in zip code 95311: 94.6 (less than average, U.S. average is 100)
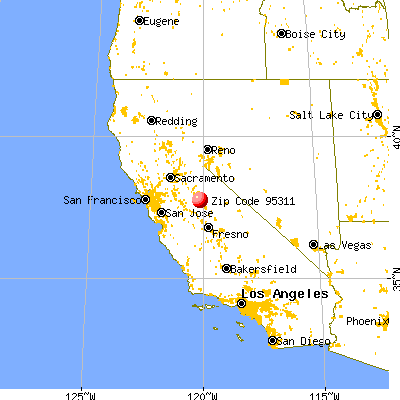
Land area: 239.6 sq. mi. Water area: 3.0 sq. mi.
Population density: 9 people per square mile
(very low).
OSM Map
General Map
Google Map
MSN Map
OSM Map
General Map
Google Map
MSN Map
OSM Map
General Map
Google Map
MSN Map
OSM Map
General Map
Google Map
MSN Map
Please wait while loading the map...
Real estate property taxes paid for housing units in 2022:
This zip code:
0.6% ($1,766)
California:
0.7% ($4,831)
Median real estate property taxes paid for housing units with mortgages in 2022: $1,735 (0.6%) Median real estate property taxes paid for housing units with no mortgage in 2022: $1,880 (0.9%)
Business Search- 14 Million verified businesses
Males: 1,120
(51.8%)
Females: 1,043
(48.2%)
For population 25 years and over in 95311:
High school or higher: 87.8%
Bachelor's degree or higher: 17.3%
Graduate or professional degree: 7.3%
Unemployed: 2.4%
Mean travel time to work (commute): 49.2 minutes
For population 15 years and over in 95311:
Never married: 30.3%
Now married: 53.2%
Separated: 0.8%
Widowed: 8.8%
Divorced: 6.9%
Zip code 95311 compared to state average:
Median household income below state average.
Median house value significantly below state average.
Unemployed percentage below state average.
Black race population percentage significantly below state average.
Median age significantly above state average.
Foreign-born population percentage significantly below state average.
Renting percentage significantly below state average.
Length of stay since moving in above state average.
House age below state average.
Number of college students significantly below state average.
Percentage of population with a bachelor's degree or higher below state average.
Averages for the 2020 tax year for zip code 95311, filed in 2021:
Average Adjusted Gross Income (AGI) in 2020: $49,260 (Individual Income Tax Returns)
Here:
$49,260
State:
$95,910
Salary/wage: $43,181 (reported on 65.9% of returns)
Here:
$43,181
State:
$77,331
(% of AGI for various income ranges: 909.5% for AGIs below $25k, 3533.8% for AGIs $25k-50k, 6154.3% for AGIs $50k-75k, 8950.0% for AGIs $75k-100k, 16426.0% for AGIs $100k-200k)
Taxable interest for individuals: $1,079 (reported on 34.1% of returns)
This zip code:
$1,079
California:
$2,294
(% of AGI for various income ranges: 43.2% for AGIs below $25k, 28.5% for AGIs $25k-50k, 24.3% for AGIs $50k-75k, 42.0% for AGIs $75k-100k, 290.0% for AGIs $100k-200k)
Ordinary dividends: $2,673 (reported on 13.4% of returns)
Here:
$2,673
State:
$10,949
(% of AGI for various income ranges: 62.6% for AGIs below $25k, 94.3% for AGIs $50k-75k, 218.0% for AGIs $100k-200k)
Net capital gain/loss in AGI: +$12,320 (reported on 12.2% of returns)
Here:
+$12,320
State:
+$49,306
(% of AGI for various income ranges: 18.4% for AGIs below $25k, 100.0% for AGIs $50k-75k, 2254.0% for AGIs $100k-200k)
Profit/loss from business: +$6,067 (reported on 18.3% of returns)
Here:
+$6,067
State:
+$15,671
(% of AGI for various income ranges: 145.8% for AGIs below $25k, 333.1% for AGIs $25k-50k, 252.9% for AGIs $50k-75k, 46.0% for AGIs $100k-200k)
Taxable individual retirement arrangement distribution: $16,275 (reported on 9.8% of returns)
95311:
$16,275
California:
$23,505
(% of AGI for various income ranges: 465.4% for AGIs $25k-50k, 1394.0% for AGIs $75k-100k)
Total itemized deductions: $26,100 (reported on 6.1% of returns)
Here:
$26,100
State:
$39,517
(% of AGI for various income ranges: 2610.0% for AGIs $75k-100k)
Charity contributions: $1,875 (reported on 4.9% of returns)
Here:
$1,875
State:
$12,598
(% of AGI for various income ranges: 150.0% for AGIs $75k-100k)
Taxes paid: $7,180 (reported on 6.1% of returns)
95311:
$7,180
State:
$8,807
(% of AGI for various income ranges: 718.0% for AGIs $75k-100k)
Earned income credit: $1,800 (reported on 17.1% of returns)
Here:
$1,800
State:
$2,074
(% of AGI for various income ranges: 83.7% for AGIs below $25k, 71.5% for AGIs $25k-50k)
Percentage of individuals using paid preparers for their 2020 taxes: 90.2%
Here:
90%
State:
92%
(% for various income ranges: 87.5% for AGIs below $25k, 90.0% for AGIs $25k-50k, 100.0% for AGIs $50k-75k, 88.9% for AGIs $75k-100k, 90.0% for AGIs $100k-200k)
Averages for the 2012 tax year for zip code 95311, filed in 2013:
Average Adjusted Gross Income (AGI) in 2012: $42,790 (Individual Income Tax Returns)
Here:
$42,790
State:
$72,726
Salary/wage: $36,828 (reported on 67.1% of returns)
Here:
$36,828
State:
$59,079
(% of AGI for various income ranges: 51.5% for AGIs below $25k, 58.8% for AGIs $25k-50k, 59.5% for AGIs $50k-75k, 66.0% for AGIs $75k-100k, 54.1% for AGIs $100k-200k)
Taxable interest for individuals: $1,140 (reported on 35.7% of returns)
This zip code:
$1,140
California:
$2,146
(% of AGI for various income ranges: 1.7% for AGIs below $25k, 2.3% for AGIs $25k-50k, 0.4% for AGIs $50k-75k, 0.7% for AGIs $100k-200k)
Ordinary dividends: $2,010 (reported on 14.3% of returns)
Here:
$2,010
State:
$9,308
(% of AGI for various income ranges: 1.4% for AGIs below $25k, 1.7% for AGIs $25k-50k, 1.0% for AGIs $75k-100k)
Profit/loss from business: +$6,833 (reported on 17.1% of returns)
Here:
+$6,833
State:
+$17,064
(% of AGI for various income ranges: 8.9% for AGIs below $25k, 4.0% for AGIs $25k-50k, 4.0% for AGIs $75k-100k)
Taxable individual retirement arrangement distribution: $12,633 (reported on 12.9% of returns)
95311:
$12,633
California:
$19,557
(% of AGI for various income ranges: 5.4% for AGIs below $25k, 6.1% for AGIs $25k-50k, 10.4% for AGIs $75k-100k)
Total itemized deductions: $25,095 (31% of AGI, reported on 28.6% of returns)
Here:
$25,095
State:
$34,004
Here:
31.4% of AGI
State:
22.7% of AGI
(% of AGI for various income ranges: 19.9% for AGIs below $25k, 14.5% for AGIs $25k-50k, 13.1% for AGIs $50k-75k, 16.8% for AGIs $75k-100k, 18.7% for AGIs $100k-200k)
Charity contributions: $2,883 (reported on 25.7% of returns)
Here:
$2,883
State:
$4,659
(% of AGI for various income ranges: 1.1% for AGIs below $25k, 1.2% for AGIs $25k-50k, 1.7% for AGIs $50k-75k, 2.0% for AGIs $75k-100k, 2.2% for AGIs $100k-200k)
Taxes paid: $6,335 (reported on 28.6% of returns)
95311:
$6,335
State:
$14,448
(% of AGI for various income ranges: 2.8% for AGIs below $25k, 2.3% for AGIs $25k-50k, 3.6% for AGIs $50k-75k, 4.7% for AGIs $75k-100k, 6.1% for AGIs $100k-200k)
Earned income credit: $2,227 (reported on 21.4% of returns)
Here:
$2,227
State:
$2,286
(% of AGI for various income ranges: 6.4% for AGIs below $25k, 1.1% for AGIs $25k-50k)
Percentage of individuals using paid preparers for their 2012 taxes: 54.3%
Here:
54%
State:
64%
(% for various income ranges: 45.5% for AGIs below $25k, 64.3% for AGIs $25k-50k, 66.7% for AGIs $50k-75k, 57.1% for AGIs $75k-100k, 57.1% for AGIs $100k-200k)
Averages for the 2004 tax year for zip code 95311, filed in 2005:
Average Adjusted Gross Income (AGI) in 2004: $38,487 (Individual Income Tax Returns)
Here:
$38,487
State:
$58,600
Salary/wage: $33,542 (reported on 71.1% of returns)
Here:
$33,542
State:
$49,455
(% of AGI for various income ranges: 78.8% for AGIs below $10k, 53.4% for AGIs $10k-25k, 68.3% for AGIs $25k-50k, 75.1% for AGIs $50k-75k, 64.6% for AGIs $75k-100k, 39.9% for AGIs over 100k)
Taxable interest for individuals: $1,534 (reported on 44.8% of returns)
This zip code:
$1,534
California:
$2,365
(% of AGI for various income ranges: 5.0% for AGIs below $10k, 2.9% for AGIs $10k-25k, 2.0% for AGIs $25k-50k, 0.4% for AGIs $50k-75k, 0.9% for AGIs $75k-100k, 2.9% for AGIs over 100k)
Taxable dividends: $1,451 (reported on 18.6% of returns)
Here:
$1,451
State:
$4,746
(% of AGI for various income ranges: 4.2% for AGIs below $10k, 1.4% for AGIs $10k-25k, 0.9% for AGIs $25k-50k, 0.4% for AGIs $50k-75k, 0.7% for AGIs $75k-100k)
Net capital gain/loss: +$19,946 (reported on 16.8% of returns)
Here:
+$19,946
State:
+$23,418
(% of AGI for various income ranges: -3.3% for AGIs below $10k, -0.3% for AGIs $10k-25k, 1.0% for AGIs $25k-50k, -0.3% for AGIs $50k-75k, 8.7% for AGIs $75k-100k, 34.4% for AGIs over 100k)
Profit/loss from business: +$6,144 (reported on 20.6% of returns)
Here:
+$6,144
State:
+$16,826
(% of AGI for various income ranges: 8.2% for AGIs below $10k, 6.4% for AGIs $10k-25k, 5.6% for AGIs $25k-50k, 0.5% for AGIs $50k-75k, 4.0% for AGIs $75k-100k, 1.6% for AGIs over 100k)
IRA payment deduction: $2,933 (reported on 1.9% of returns)
95311:
$2,933
California:
$3,192
Total itemized deductions: $18,859 (30% of AGI, reported on 35.7% of returns)
Here:
$18,859
State:
$28,113
Here:
29.7% of AGI
State:
25.3% of AGI
(% of AGI for various income ranges: 20.9% for AGIs $10k-25k, 16.2% for AGIs $25k-50k, 18.9% for AGIs $50k-75k, 18.9% for AGIs $75k-100k, 16.4% for AGIs over 100k)
Charity contributions deductions: $2,844 (4% of AGI, reported on 29.8% of returns)
Here:
$2,844
State:
$3,923
Here:
4.5% of AGI
State:
3.3% of AGI
(% of AGI for various income ranges: 1.8% for AGIs $10k-25k, 1.6% for AGIs $25k-50k, 2.1% for AGIs $50k-75k, 2.5% for AGIs $75k-100k, 3.3% for AGIs over 100k)
Total tax: $4,811 (reported on 71.5% of returns)
95311:
$4,811
State:
$10,761
(% of AGI for various income ranges: 3.1% for AGIs below $10k, 3.5% for AGIs $10k-25k, 6.4% for AGIs $25k-50k, 8.5% for AGIs $50k-75k, 10.2% for AGIs $75k-100k, 15.1% for AGIs over 100k)
Earned income credit: $1,641 (reported on 16.9% of returns)
Here:
$1,641
State:
$1,763
Percentage of individuals using paid preparers for their 2004 taxes: 61.2%
Here:
61%
State:
66%
(% for various income ranges: 51.5% for AGIs below $10k, 62.9% for AGIs $10k-25k, 61.7% for AGIs $25k-50k, 62.7% for AGIs $50k-75k, 75.5% for AGIs $75k-100k, 69.4% for AGIs over 100k)
Household received Food Stamps/SNAP in the past 12 months: 113 Household did not receive Food Stamps/SNAP in the past 12 months: 960
Women who did not have a birth in the past 12 months: 426 (99 now married, 329 unmarried)
Housing units in zip code 95311 with a mortgage: 468 (24 second mortgage, 12 both second mortgage and home equity loan) Median monthly owner costs for units with a mortgage: $1,579 Median monthly owner costs for units without a mortgage: $491
Residents with income below the poverty level in 2022:
This zip code:
21.6%
Whole state:
12.2%
Residents with income below 50% of the poverty level in 2022:
This zip code:
15.1%
Whole state:
6.2%
Median number of rooms in houses and condos:
Here:
4.9
State:
6.0
Median number of rooms in apartments:
Here:
4.4
State:
3.9
Notable locations in this zip code not listed on our city pages
Notable locations in zip code 95311: Moore Creek Campground (A), Virginia Mine (B), Cat Town (C), Goat Camp (D), Hazel Green Ranch (E), Jenkins Ranch (F), Kinsley (G), McCauley Ranch (H), McDiermid Guard Station (I), Greeley Hill Community Club (J), Coulterville Community Club House (K), Department of Forestry and Fire Protection Coulterville Fire Station (L), Mariposa County Fire Department Company 26 Coulterville (M), Mariposa County Fire Department Company 31 Greeley Hill (N), Hayden Cabin Interpretive Site (O). Display/hide their locations on the map
Rivers and creeks: Sweetwater Creek (A), Sherlock Creek (B), North Fork Merced River (C), Feliciana Creek (D), Dutch Creek (E), Cuneo Creek (F), Buckhorn Creek (G), Boneyard Creek (H), Blacks Creek (I). Display/hide their locations on the map
Parks in zip code 95311 include: Coulterville Main Street Historic District (1), Coulterville Park (2), Horseshoe Bend Recreation Area (3). Display/hide their locations on the map
201 married couples with children.
83 single-parent households (83 women).
85.9% of residents of 95311 zip code speak English at home.
14.0% of residents speak Spanish at home (68% very well, 24% well, 8% not well).
0.2% of residents speak other Indo-European language at home (100% very well).
0.1% of residents speak Asian or Pacific Island language at home (100% not well).
Foreign born population: 141 (6.6%) (54.7% of them are naturalized citizens)
This zip code:
6.6%
Whole state:
26.7%
87%Honduras
2%Germany
19%Irish
8%English
5%Portuguese
3%German
3%Dutch
2%European
2%Scottish
Year of entry for the foreign-born population
42010 or later
32000 to 2009
581990 to 1999
80Before 1990
Facilities with environmental interests located in this zip code:
CAL TRANS (HWY AND JCT HWY 49 in COULTERVILLE, CA)
Small Quantity Generators, between 100 kg and 1000 kg of hazardous waste/month (Resource Conservation and Recovery Act (tracking hazardous waste)) - notification Organizations: CALIFORNIA STATE OF (CONTACT/OWNER)
GREELEY HILL SEVENTH-DAY ADVENTIST (5801 CUNEO RD in COULTERVILLE, CA)
COMPLIANCE ACTIVITY (Tracking inspections of insecticide, fungicide, and rodenticide, and toxic substances)
Housing units lacking complete plumbing facilities: 6.3% Housing units lacking complete kitchen facilities: 3.6%
57.2%Bottled, tank, or LP gas
29.3%Wood
9.1%Electricity
3.2%Utility gas
1.4%Fuel oil, kerosene, etc.
Population in 1990: 2,384.
Place of birth for U.S.-born residents:
This state: 1,511
Northeast: 66
Midwest: 219
South: 167
West: 35
54% of the 95311 zip code residents lived in the same house 5 years ago. Out of people who lived in different houses, 31% lived in this county. Out of people who lived in different counties, 50% lived in California.
93% of the 95311 zip code residents lived in the same house 1 year ago. Out of people who lived in different houses, 64% moved from this county. Out of people who lived in different houses, 26% moved from different county within same state. Out of people who lived in different houses, 8% moved from different state. Out of people who lived in different houses, 2% moved from abroad.
Private vs. public school enrollment:
Students in private schools in grades 1 to 8 (elementary and middle school):
Here:
0.0%
California:
10.5%
Students in private schools in grades 9 to 12 (high school):
Here:
0.0%
California:
8.5%
Students in private undergraduate colleges:
Here:
0.0%
California:
15.9%
Occupation by median earnings in the past 12 months ($)
76,686Building and grounds cleaning and maintenance occupations
68,864Management occupations
44,544Community and social service occupations
26,655Sales and related occupations
17,529Education, training, and library occupations
17,275Office and administrative support occupations
Top industries in this zip code by the number of employees in 2005:
Accommodation and Food Services: Hotels (except Casino Hotels) and Motels (5-9: 1)
Construction: New Single-Family Housing Construction (except Operative Builders) (1-4: 2)
Construction: Site Preparation Contractors (1-4: 1)
Finance and Insurance: Insurance Agencies and Brokerages (1-4: 1)
Arts, Entertainment, and Recreation: Museums (1-4: 1)
Real Estate and Rental and Leasing: Lessors of Other Real Estate Property (1-4: 1)
People in group quarters in 2000:
14 people in other noninstitutional group quarters
Fatal accident statistics in 2012:
Fatal accident count: 1
Vehicles involved in fatal accidents: 1
Fatal accidents caused by drunken drivers: 1
Fatalities: 1
Persons involved in fatal accidents: 1
Pedestrians involved in fatal accidents: 0
Fatal accident statistics in 2010:
Fatal accident count: 1
Vehicles involved in fatal accidents: 1
Fatal accidents caused by drunken drivers: 1
Fatalities: 1
Persons involved in fatal accidents: 1
Pedestrians involved in fatal accidents: 0
2005 - 2018 National Fire Incident Reporting System (NFIRS) incidents
Based on the data from the years 2005 - 2018 the average number of fire incidents per year is 18. The highest number of reported fire incidents - 30 took place in 2005, and the least - 9 in 2010. The data has a dropping trend.
When looking into fire subcategories, the most reports belonged to: Outside Fires (68.1%), and Structure Fires (15.7%).
Fire incident types reported to NFIRS in Zip Code 95311


 Nearest zip codes: 95345, 95321, 95305, 95338, 95379, 95325.


 Based on the data from the years 2005 - 2018 the average number of fire incidents per year is 18. The highest number of reported fire incidents - 30 took place in 2005, and the least - 9 in 2010. The data has a dropping trend.
 When looking into fire subcategories, the most reports belonged to: Outside Fires (68.1%), and Structure Fires (15.7%).